

Sarcopenic obesity in older adults: aetiology, epidemiology and treatment strategies
- PMID: 30065268
- PMCID: PMC6241236
- DOI: 10.1038/s41574-018-0062-9
Sarcopenic obesity in older adults: aetiology, epidemiology and treatment strategies
Abstract
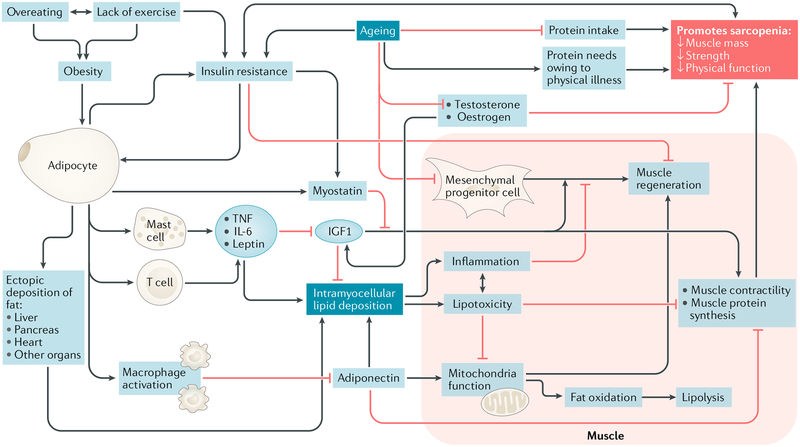
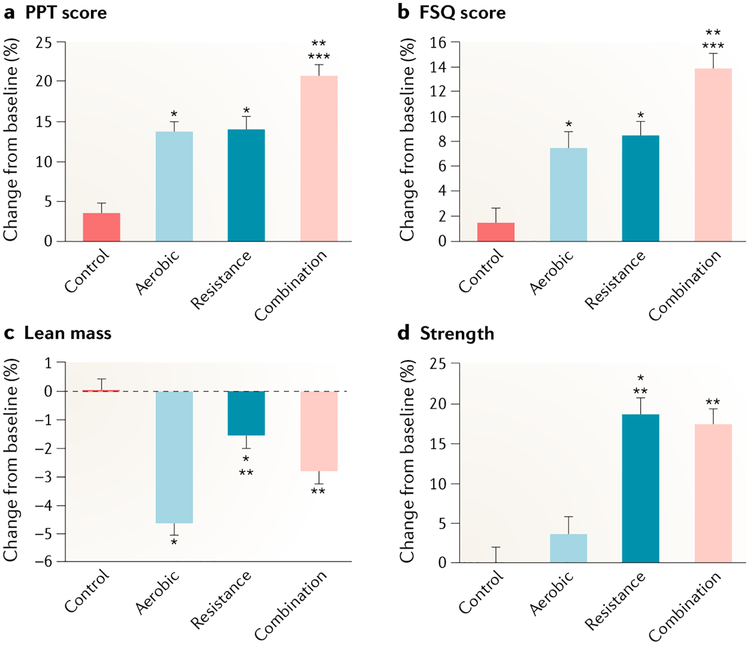
The prevalence of obesity in combination with sarcopenia (the age-related loss of muscle mass and strength or physical function) is increasing in adults aged 65 years and older. A major subset of adults over the age of 65 is now classified as having sarcopenic obesity, a high-risk geriatric syndrome predominantly observed in an ageing population that is at risk of synergistic complications from both sarcopenia and obesity. This Review discusses pathways and mechanisms leading to muscle impairment in older adults with obesity. We explore sex-specific hormonal changes, inflammatory pathways and myocellular mechanisms leading to the development of sarcopenic obesity. We discuss the evolution, controversies and challenges in defining sarcopenic obesity and present current body composition modalities used to assess this condition. Epidemiological surveys form the basis of defining its prevalence and consequences beyond comorbidity and mortality. Current treatment strategies, and the evidence supporting them, are outlined, with a focus on calorie restriction, protein supplementation and aerobic and resistance exercises. We also describe weight loss-induced complications in patients with sarcopenic obesity that are relevant to clinical management. Finally, we review novel and potential future therapies including testosterone, selective androgen receptor modulators, myostatin inhibitors, ghrelin analogues, vitamin K and mesenchymal stem cell therapy.
Conflict of interest statement
Competing interests
The authors declare no competing interests.
Figures
References
-
- Nations United, Department of Economic Population Division. World Population Prospects: The 2017 Revision, Key Findings and Advance Tables. Working Paper No. ESA/P/WP/248 (United Nations, 2017).
-
- Johnson NB, Hayes LD, Brown K, Hoo EC & Ethier KA CDC National Health Report: leading causes of morbidity and mortality and associated behavioral risk and protective factors—United States, 2005–2013. MMWR Suppl 63, 3–27 (2014). - PubMed
-
-
Hales CM, Carroll MD, Fryar CD & Ogden CL Prevalence of obesity among adults and youth: United States, 2015–2016. Centers for Disease Control and Prevention https://www.cdc.gov/nchs/data/databriefs/db288.pdf (2017).
These are the most updated prevalence rates of the obesity epidemic in the United States.
-
-
- Organisation for Economic Co-operation and Development. Obesity Update 2017. OECD www.oecd.org/health/obesity-update.htm (2017).
Publication types
MeSH terms
Grants and funding
LinkOut - more resources
Full Text Sources
Other Literature Sources
Medical
