

doi: 10.1038/s41592-018-0076-1.
Water content, not stiffness, dominates Brillouin spectroscopy measurements in hydrated materials
Affiliations
- PMID: 30065366
- PMCID: PMC6554225
- DOI: 10.1038/s41592-018-0076-1
Item in Clipboard
Water content, not stiffness, dominates Brillouin spectroscopy measurements in hydrated materials
Nat Methods.
2018 Aug.
No abstract available
Conflict of interest statement
Competing interests
The authors declare no competing interests.
Figures
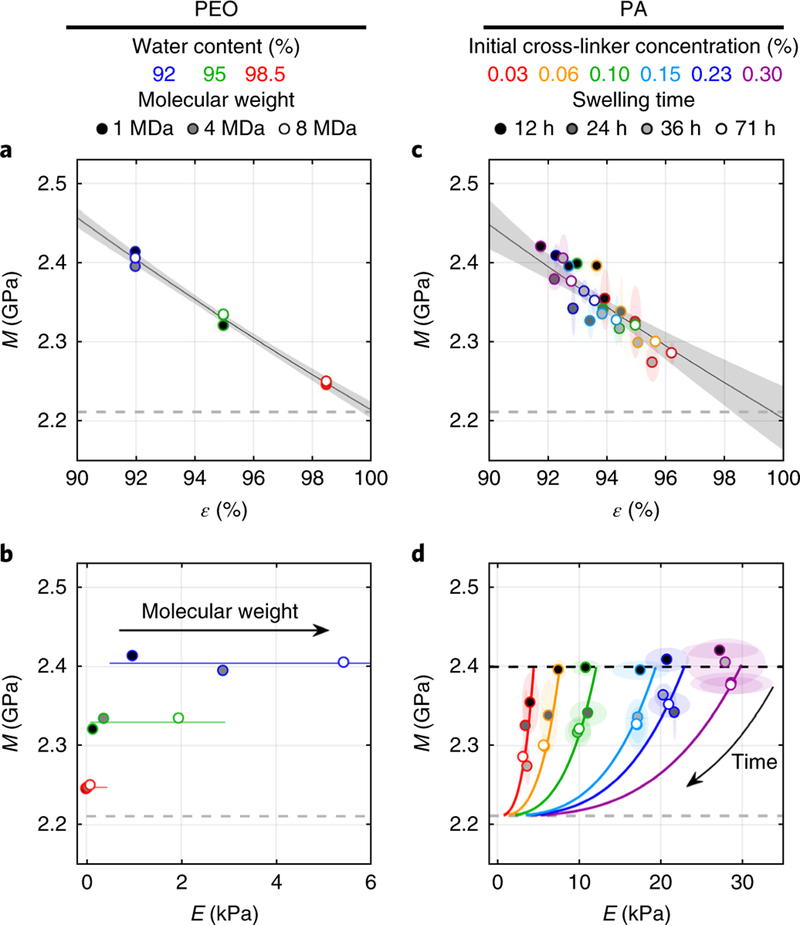
a, M for PEO of the indicated molecular
weight, measured at different ε. The fit to equation (2) is shown
(R =0.97;
one hydrogel per data point).b, M is plotted
versus E (color code as in a;one hydrogel per data
point). Lines represent values of constant ε.
c, M over all swelling times (shading within
symbols) and cross-linker concentrations (colored symbols), plotted versus
ε for PA. The fit to equation (2) is shown
(R
=0.78; four hydrogels per data point, mean ±2 s. d.).d,
Relationships between M and E at various PA
hydrogel compositions. Changes in M and E
during swelling were consistent with predictions of equations (2) and (3) using
Mf =2.21 GPa and
Ms =16.35 GPa (curves; four
hydrogels per data point, mean ±2 s. d.). Dashed gray lines represent the
value of M for pure water. The black dashed line in
d represents the estimated initial value of M
at the start of swelling when ε0 =0.9 for all
hydrogels. Elliptical regions surrounding data points in c and
d represent 2 s.d. Shaded regions in a and
c represent 95% confidence bounds on the fit by equation (2).
Comment in
-
Reply to 'Water content, not stiffness, dominates Brillouin spectroscopy measurements in hydrated materials'.Nat Methods. 2018 Aug;15(8):562-563. doi: 10.1038/s41592-018-0075-2. Nat Methods. 2018. PMID: 30065365 No abstract available.
References
-
- Koski KJ & Yarger JL Appl. Phys. Lett 87, 061903 (2005).
Publication types
MeSH terms
Substances
Grants and funding
LinkOut - more resources
Full Text Sources
Other Literature Sources
