. 2018 Jul 17:9:1022.
doi: 10.3389/fpls.2018.01022. eCollection 2018.

NMR Metabolomics Defining Genetic Variation in Pea Seed Metabolites

Affiliations

NMR Metabolomics Defining Genetic Variation in Pea Seed Metabolites

Noel Ellis et al. Front Plant Sci. .

Abstract

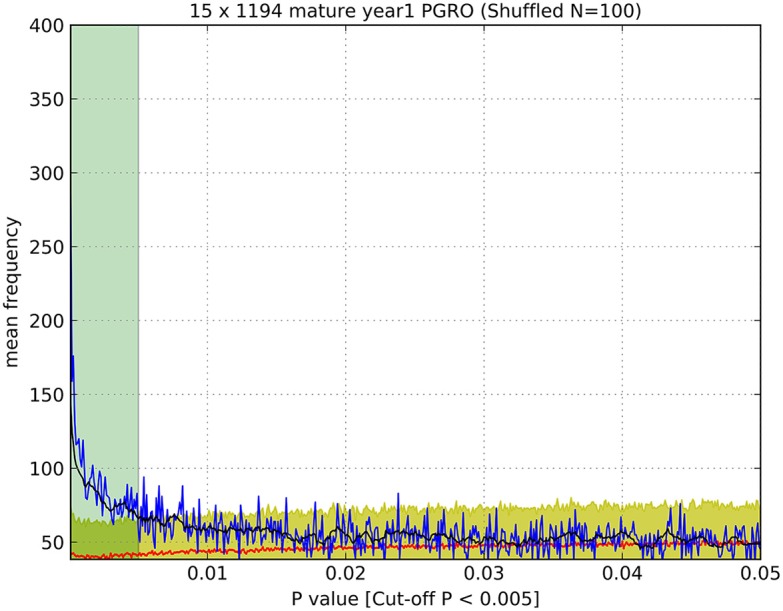
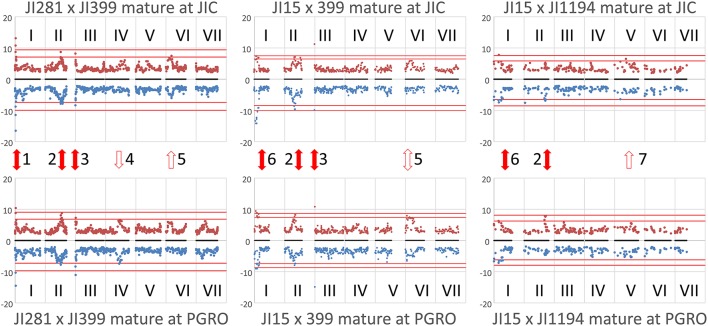
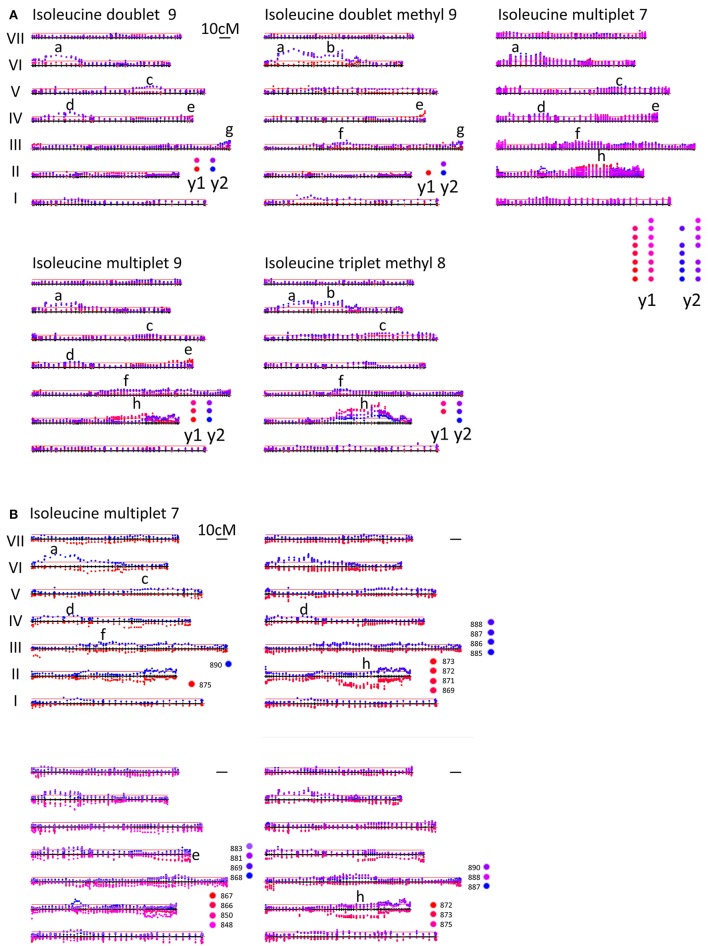
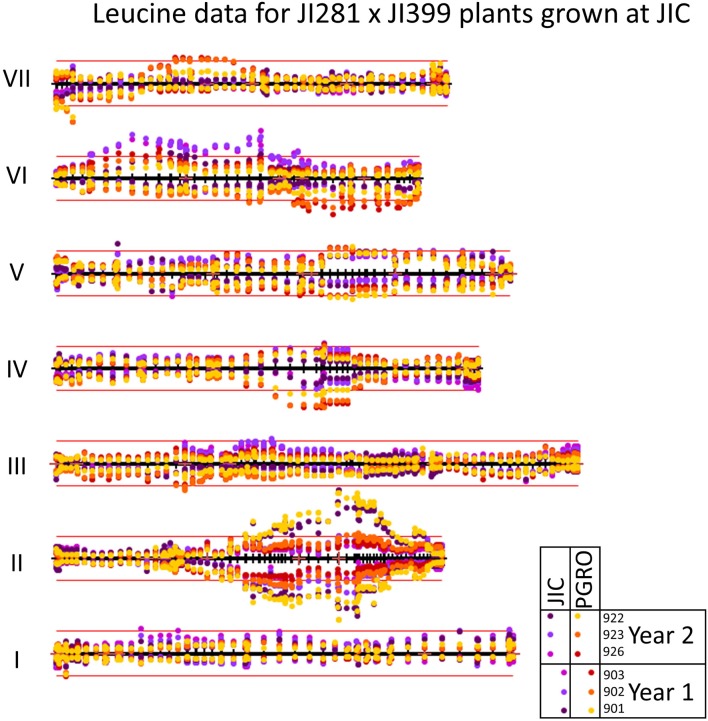
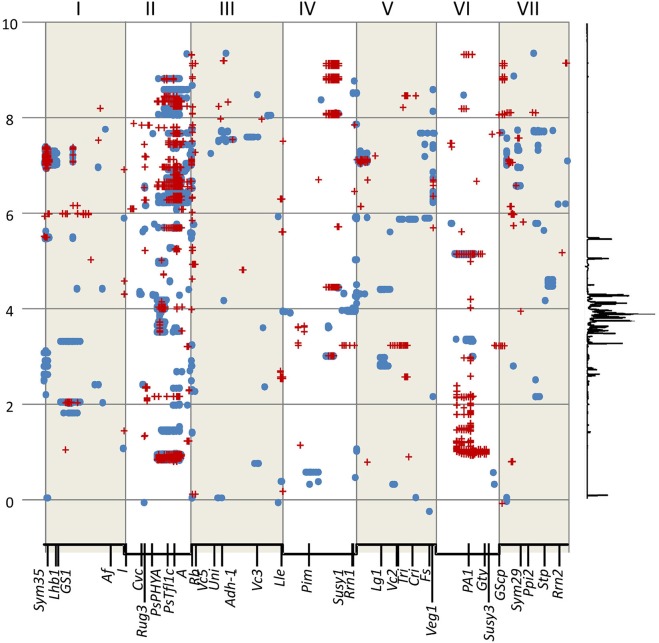
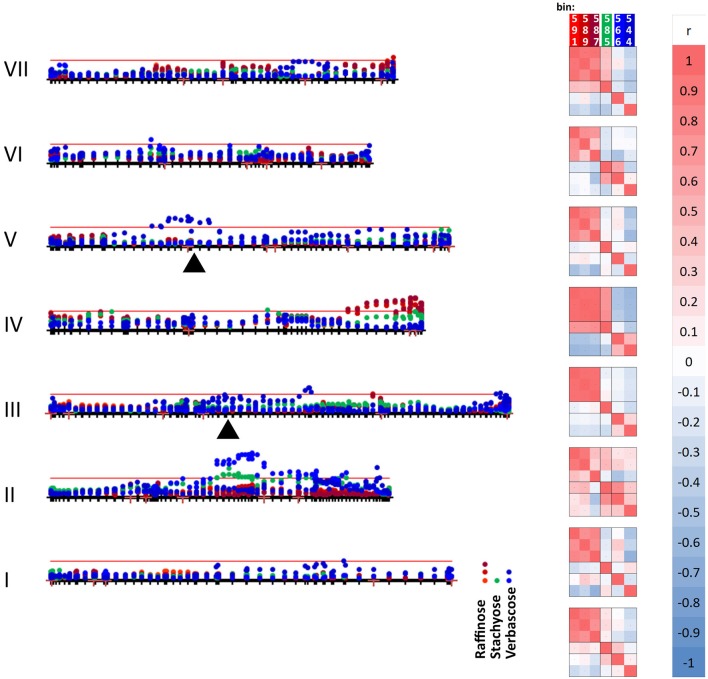
Nuclear magnetic resonance (NMR) spectroscopy profiling was used to provide an unbiased assessment of changes to the metabolite composition of seeds and to define genetic variation for a range of pea seed metabolites. Mature seeds from recombinant inbred lines, derived from three mapping populations for which there is substantial genetic marker linkage information, were grown in two environments/years and analyzed by non-targeted NMR. Adaptive binning of the NMR metabolite data, followed by analysis of quantitative variation among lines for individual bins, identified the main genomic regions determining this metabolic variability and the variability for selected compounds was investigated. Analysis by t-tests identified a set of bins with highly significant associations to genetic map regions, based on probability (p) values that were appreciably lower than those determined for randomized data. The correlation between bins showing high mean absolute deviation and those showing low p-values for marker association provided an indication of the extent to which the genetics of bin variation might be explained by one or a few loci. Variation in compounds related to aromatic amino acids, branched-chain amino acids, sucrose-derived metabolites, secondary metabolites and some unidentified compounds was associated with one or more genetic loci. The combined analysis shows that there are multiple loci throughout the genome that together impact on the abundance of many compounds through a network of interactions, where individual loci may affect more than one compound and vice versa. This work therefore provides a framework for the genetic analysis of the seed metabolome, and the use of genetic marker data in the breeding and selection of seeds for specific seed quality traits and compounds that have high commercial value.

Keywords: genetic map; genetic variation; metabolite; nuclear magnetic resonance; pea; seed.


Figures

Figure 1
Figure 1
Determination of significance values (as listed in Table 1). An example of a plot of the observed number of p-values (blue line) of a given value (<0.05) compared to the number of p-values of that magnitude from randomized data (red line), which enabled the estimation of a cut-off value above which p-values were indistinguishable from random values. Black line: average of ten successive intervals, Yellow shadow: error (±3 S.D.) of 100 times resampled data, Green shadow: cut off point of p-values above the significance threshold. Data were determined for JI 15 × JI 1194 RILs, mature seeds, year 1, PGRO location.
Figure 2
Figure 2
Locating the genomic regions with the most contrasting alleles. Genetic maps (linkage groups identified by roman numerals, I–VII) of the three populations analyzed (left to right JI 281 × JI399, JI 15 × JI 399, JI 15 × JI 1194) grown at JIC (Top) and PGRO (Bottom) are shown and the common logarithm of minimum p-value [–log10 (p)] for each marker is plotted (in blue, below the map for year 1 data, and −1 times this value in brown above the map for year 2 data). The red lines correspond to +3 and +5 standard deviations of all p-values for that population and location. Solid red arrows indicate marker-NMR resonance associations that are consistent between years, open arrows indicate those that reach the threshold value in 1 year, all numbered for reference in the text.
Figure 3
Figure 3
(A) Mapping variation attributed to isoleucine. LG I–VII of the genetic map of the JI 281 × JI 399 RIL population are displayed horizontally from bottom to top for each isoleucine signal. The –log10 (p)-values for each marker are plotted above the genetic map for NMR resonances associated with different parts of the isoleucine molecule. Different bins are plotted with a slightly different color, those from year 1 in red and those in year 2 in blue. Overall, the identified peaks (labeled a–h) are different between years, with the exception of peak h. The multiple bins assigned to isoleucine multiplet 7 are deconvoluted in (B). Mapping variation attributed to isoleucine multiplet 7. LG I–VII of the genetic map of the JI 281 × JI 399 RIL population are displayed horizontally from bottom to top. The –log10 (p)-values for each marker are plotted above the genetic map for year 2 data and below the genetic map for year 1 data. The color coding for the various bins is indicated adjacent to the relevant map. The bin groupings are according to the correlations given in Supplementary Table 4. The peaks (labeled a–h) correspond to those identified in (A) for isoleucine multiplet 7. The red lines above the map correspond to 3 SD units for the variation in p-values.
Figure 4
Figure 4
Mapping variation attributed to leucine. The seven linkage groups (I–VII) of the JI 281 × JI 399 genetic map are displayed horizontally from bottom to top. The –log10 (p) values for each marker are plotted above the genetic map for year 2 data and below the genetic map for year 1 data. The color coding for the various bins is indicated adjacent in the boxed section. The bins that contain the same resonance in year 1 and year 2 are given the same color. The red lines above and below the map correspond to 3 SD units for the variation in p-values for year 2 and year 1, respectively.
Figure 5
Figure 5
Significant genetic marker-NMR bin associations in the JI 281 × JI 399 RILs. The x axis represents a concatenated genetic map for LG I–VII in numerical order. Below the axis several reference genetic loci are indicated. The y axis represents the NMR spectrum in ppm. To the right of the graph a representative trace of the NMR spectrum is shown vertically to indicate relative signal intensity. The blue spots represent the upper and lower bounds of a selected year 1 bin and the red crosses are the upper and lower bounds of selected year 2 bins (both JIC location). Bins were selected that had –log10 (p) values greater than the mean plus 5 SD units.
Figure 6
Figure 6
Mapping variation attributed to oligosaccharides. The seven linkage groups (I–VII) of the JI 281 × JI 399 genetic map are displayed horizontally from bottom to top. The –log10 (p) values for each oligosaccharide bin/marker are plotted above the genetic map (year 1, JIC). The threshold value for p determined from the randomization and t-test is indicated by the red horizontal line. The positions of raffinose synthase and stachyose synthase genes on linkage groups III and V are indicated by black triangles. The three bins assigned to raffinose (591, 589, and 587) are indicated in shades of red, stachyose (585) in green, and the two verbascose bins (566 and 544) in blue. On the right of the genetic map, a correlation analysis of the p-values for each bin within each linkage group is indicated, together with a color scale for the correlation range −1 to +1. At the bottom of the correlation scores, the correlation between the bins for the whole linkage map is given.

References

    1. Aubert G., Morin J., Jacquin F., Loridon K., Quillet M. C., Petit A., et al. . (2006). Functional mapping in pea, as an aid to the candidate gene selection and for investigating synteny with the model legume Medicago truncatula. Theor. Appl. Genet. 112, 1024–1041. 10.1007/s00122-005-0205-y - DOI - PubMed
    1. Baker J. M., Hawkins N. D., Ward J. L., Lovegrove A., Napier J. A., Shewry P. R., et al. . (2006). A metabolomic study of substantial equivalence of field-grown genetically modified wheat. Plant Biotechnol. J. 4, 381–392. 10.1111/j.1467-7652.2006.00197.x - DOI - PubMed
    1. Belton P. S., Ratcliffe R. G. (1985). NMR and compartmentation in biological tissues. Prog. Nucl. Mag. Res. Sp. 17, 241–279. 10.1016/0079-6565(85)80010-8 - DOI
    1. Bhattacharyya M. K., Smith A. M., Ellis T. H. N., Hedley C., Martin C. (1990). The wrinkled-seed character of pea described by Mendel is caused by a transposon-like insertion in a gene encoding starch-branching enzyme. Cell 60, 115–122. 10.1016/0092-8674(90)90721-P - DOI - PubMed
    1. Cao T., Lahiri I., Vingh V., Louis J., Shah J., Ayre B. G. (2013). Metabolic engineering of raffinose-family oligosaccharides in the phloem reveals alterations in carbon partitioning and enhances resistance to green peach aphid. Front. Plant Sci. 4:263. 10.3389/fpls.2013.00263 - DOI - PMC - PubMed

LinkOut - more resources