. 2018 Oct;4(4):262-273.
doi: 10.1002/cjp2.112. Epub 2018 Sep 21.

Breast cancer biomarkers in clinical testing: analysis of a UK national external quality assessment scheme for immunocytochemistry and in situ hybridisation database containing results from 199 300 patients

Affiliations

Breast cancer biomarkers in clinical testing: analysis of a UK national external quality assessment scheme for immunocytochemistry and in situ hybridisation database containing results from 199 300 patients

Andrew Dodson et al. J Pathol Clin Res. 2018 Oct.

Abstract

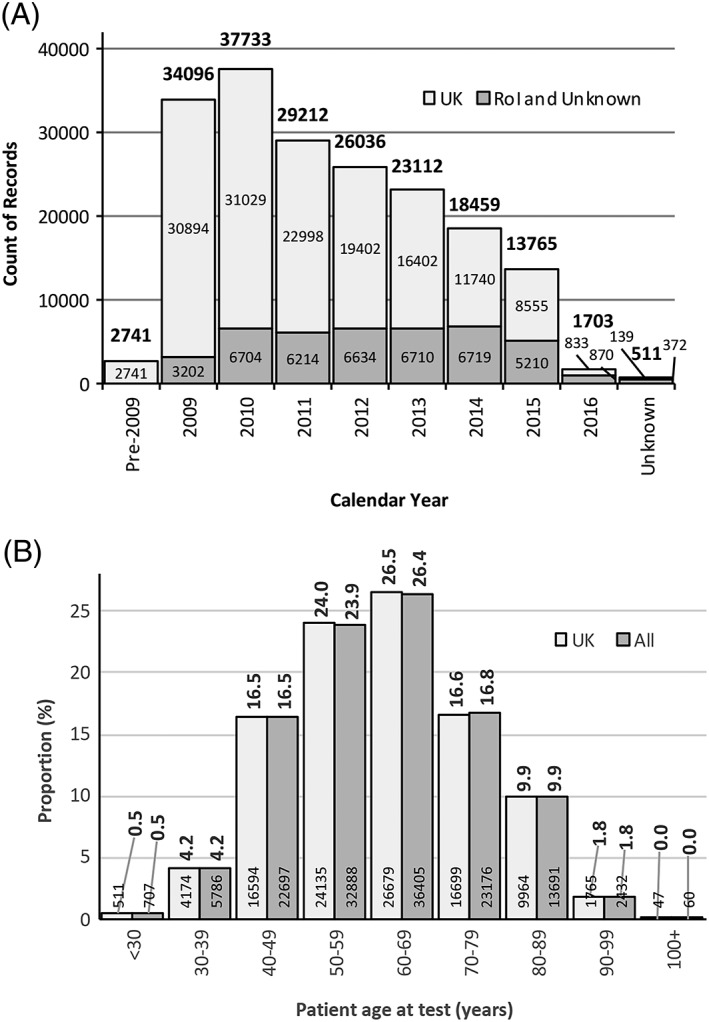
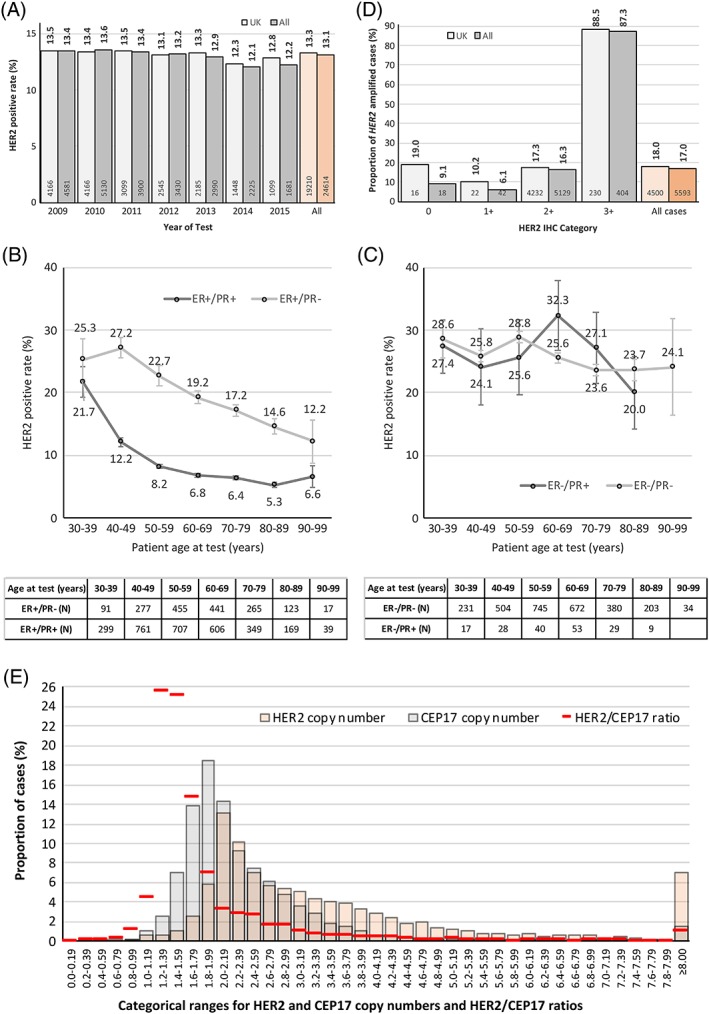
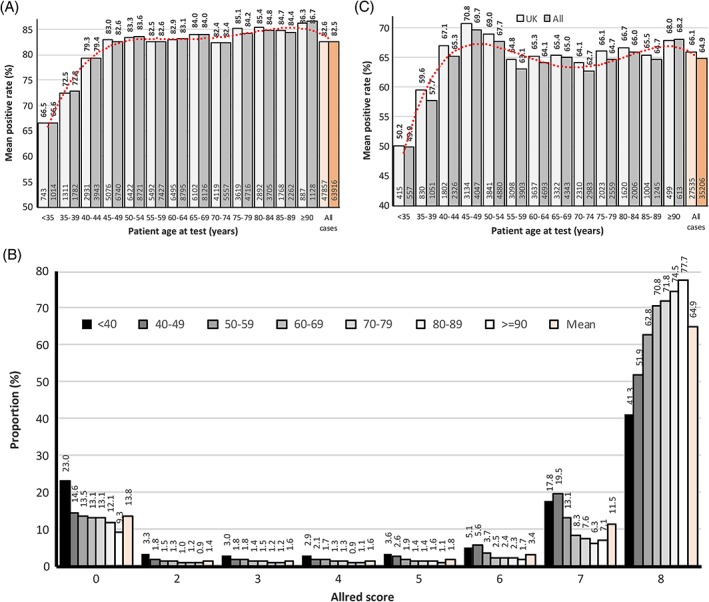
We describe a collated data set of results from clinical testing of breast cancers carried out between 2009 and 2016 in the United Kingdom and Republic of Ireland. More than 199 000 patient biomarker data sets, together with clinicopathological parameters were collected. Our analyses focused on human epidermal growth factor receptor-2 (HER2), oestrogen receptor (ER) and progesterone receptor (PR), with the aim of the study being to provide robust confirmatory evidence on known associations in these biomarkers and to uncover new data on previously undescribed or unconfirmed associations, thus strengthening the evidence-base in clinical breast cancer testing. Overall, 13.1% of tumours were HER2-positive; 10.6% in ER-positive tumours, and 25.5% in ER-negative tumours. Higher rates of HER2 positivity were significantly associated with patient age <56 years versus age ≥56 years, symptomatic versus screen-detected tumours, testing of involved axillary node versus primary breast cancer, invasive ductal carcinoma (not otherwise specified) versus other histological types, higher histological grade, increasing tumour size, increasing nodal involvement, ER-negative versus ER-positive tumour status, PR-negative versus PR-positive tumour status. Where ER status was known, 82.7% of tumours were ER-positive; 80.9% in women age <56 years, and 83.6% in those age ≥56 years (ER-positive cut-off ≥1.0% positive tumour cells or equivalent). Where PR status was known, 64.9% of tumours were PR-positive; 65.8% in women age <56 years, and 64.4% in women age ≥56 years (PR-positive cut off ≥10.0% or equivalent). These analyses of clinical test results provide contemporary benchmarking data for HER2, ER and PR positive rates.

Keywords: ER; HER2; PR; biomarkers; breast cancer; clinical testing; external quality assessment; human epidermal growth factor receptor-2; oestrogen receptor; progesterone receptor.


Figures

Figure 1
Figure 1
(A) Total number of records submitted in each calendar year. Those shown as ‘Unknown’ represent records entered with no date or with an unfeasible date. Numbers above columns are overall totals, those within columns indicate total number of patients submitted by UK centres, records submitted by RoI centres have been grouped with those where the location of the centre was unknown. (B) Distributions of patient age at date of HER2 testing. Median age in the UK and the total patient populations was 61 years (IQR: 51–71 years). Numbers above columns are proportions (%), those within column base are counts of patients.
Figure 2
Figure 2
(A) HER2‐positive rates for records grouped by year of test. Figures above columns indicate positivity‐rates, those at bases of columns show the total number of HER2‐positive patients in that group. The data shown are for centre‐assigned HER2 status, and exclude tests conducted pre‐2009 and in 2016 where insufficient numbers of tests were present to allow reliable analysis. In the indicated date‐range the mean HER2‐positive rate for UK patients was 13.2% [IQR: 12.8–13.5%; standard deviation (SD) = 0.44%], and for all patients it was 13.2% (IQR: 12.2–13.4%; SD = 0.60%). The mean HER2‐positive rate for all UK patients (light‐orange column) was 13.3%, and for all patients (orange column) it was 13.1%. (B) Mean HER2‐positive rates for patients with ages between 30 and 99 years in 10‐year groupings. This figure is for ER‐positive patients stratified by PR status and should be compared with figure (C), which shows similar data for ER‐negative patients. This is an analysis of the whole population to maintain adequate patient numbers in some sub‐groups. The table indicates number of HER2‐positive patients in group. Error bars indicate standard error of the mean. (C) Mean HER2‐positive rates for patients with ages between 30 and 99 years in 10‐year groupings (90–99 group omitted for ER‐negative/PR‐positive patients due insufficient numbers in group). This figure, which is for ER‐negative patients, should be compared with figure (B), which shows ER‐positive patients. This is an analysis of the whole population to maintain adequate patient numbers in some sub‐groups. The table indicates number of HER2‐positive patients in group. Error bars indicate standard error of the mean, ER‐negative/PR‐positive status is uncommonly encountered and hence the patient population is comparatively small, leading to large standard errors. (D) HER2 gene amplification rates by HER2 IHC category. The distribution of cases is very heavily weighted towards HER2 2+, which comprise slightly less than 96% of cases (98% for UK data) in the analysis. The figures above columns indicate proportions of amplified cases, those within the bases of columns show number of amplified cases. A small number of centres also used non‐standard ‘1+/2+’ and ‘2+/3+’ categories; these are not recognised in any published HER2 assessment guidelines and have been excluded (UK cases, n = 1837); All cases, n = 2000). See also Supplementary material, Table 5B,C. (E) Distribution of HER2 gene and CEP17 copy numbers, and HER2/CEP17 ratio for cases where these data were reported (n = 12 049). Median number of HER2 copies per cell was 2.73 (IQR: 1.55–11.75); for CEP17 it was 1.90 (IQR: 1.24–3.80). Median HER2/CEP17 ratio was 1.33 (IQR: 0.96–4.36).
Figure 3
Figure 3
(A) Distribution of ER‐positive rates by patient age at test. The final categorical status has been used to define ER positivity. Data are shown for UK and for all patients. A polynomial trend‐line (red dotted‐line) is displayed for the all patient data set. Figures above the columns are proportions of tumours, those inside the base of the columns are counts of ER‐positive tumours. (B) Allred scores for ER expression by patient age. This is for all patients where ER status was categorised by Allred score (n = 56 282). Data are presented as patients <40 years and ≥90 years, with those from 40 to 89 being grouped in 10‐year intervals. Figures above the bars on the graph indicate proportion (%) within that group. (C) Distribution of PR‐positive rates by patient age at test. The final categorical status has been used to define PR positivity. Data are shown for UK and for all patients. A polynomial trend‐line (red dotted‐line) is displayed for the all patient data set. Figures above the columns are proportions of patients, those inside the base of the columns are numbers of PR‐positive patients.

References

    1. UK‐NEQAS ICC & ISH . [Accessed 01 May 2018]. Available from: http://www.ukneqasiccish.org
    1. Ibrahim M, Herriot K, Parry S, et al Audit of breast biomarkers markers, HER2.ER & PR in the UK: an update by the UK National External Quality Assessment Scheme for Immunocytochemistry and In Situ Hybridisation (UK NEQAS ICC & ISH) Virchows Archiv 2011; 459: S74.
    1. Bartlett JM, Ellis IO, Dowsett M, et al Human epidermal growth factor receptor 2 status correlates with lymph node involvement in patients with estrogen receptor (ER) negative, but with grade in those with ER‐positive early‐stage breast cancer suitable for cytotoxic chemotherapy. J Clin Oncol 2007; 25: 4423–4430. - PubMed
    1. Kaufman PA, Bloom KJ, Burris H, et al Assessing the discordance rate between local and central HER2 testing in women with locally determined HER2‐negative breast cancer. Cancer 2014; 120: 2657–2664. - PMC - PubMed
    1. Rakha EA, Pinder SE, Bartlett JM, et al Updated UK recommendations for HER2 assessment in breast cancer. J Clin Pathol 2015; 68: 93–99. - PMC - PubMed

Publication types

MeSH terms