

Trends and inequalities in the burden of mortality in Scotland 2000-2015
- PMID: 30067740
- PMCID: PMC6070167
- DOI: 10.1371/journal.pone.0196906
Trends and inequalities in the burden of mortality in Scotland 2000-2015
Abstract
Background: Cause-specific mortality trends are routinely reported for Scotland. However, ill-defined deaths are not routinely redistributed to more precise and internationally comparable categories nor is the mortality reported in terms of years of life lost to facilitate the calculation of the burden of disease. This study describes trends in Years of Life Lost (YLL) for specific causes of death in Scotland from 2000 to 2015.
Methods: We obtained records of all deaths in Scotland by age, sex, area and underlying cause of death between 2000 and 2015. We redistributed Ill-Defined Deaths (IDDs) to more exact and meaningful causes using internationally accepted methods. Years of Life Lost (YLL) using remaining life expectancy by sex and single year of age from the 2013 Scottish life table were calculated for each death. These data were then used to calculate the crude and age-standardised trends in YLL by age, sex, cause, health board area, and area deprivation decile.
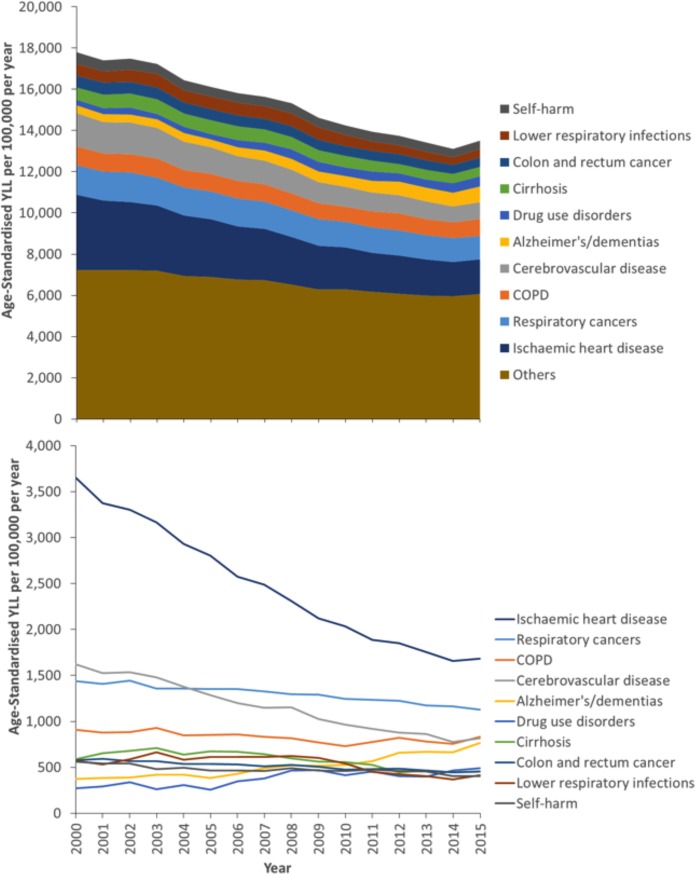
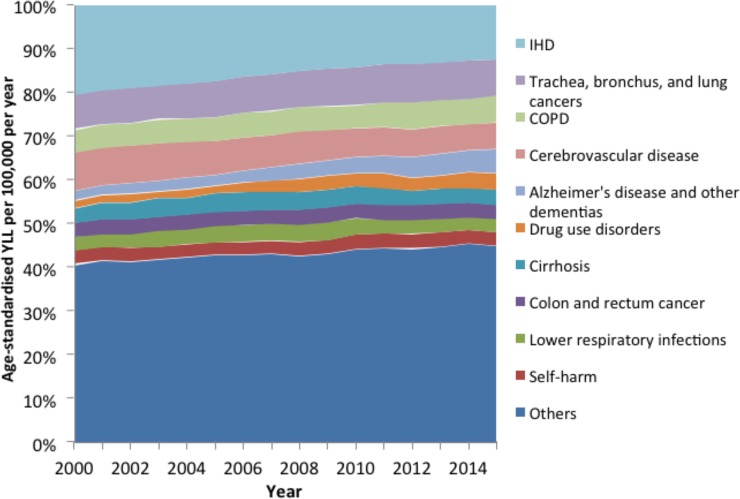
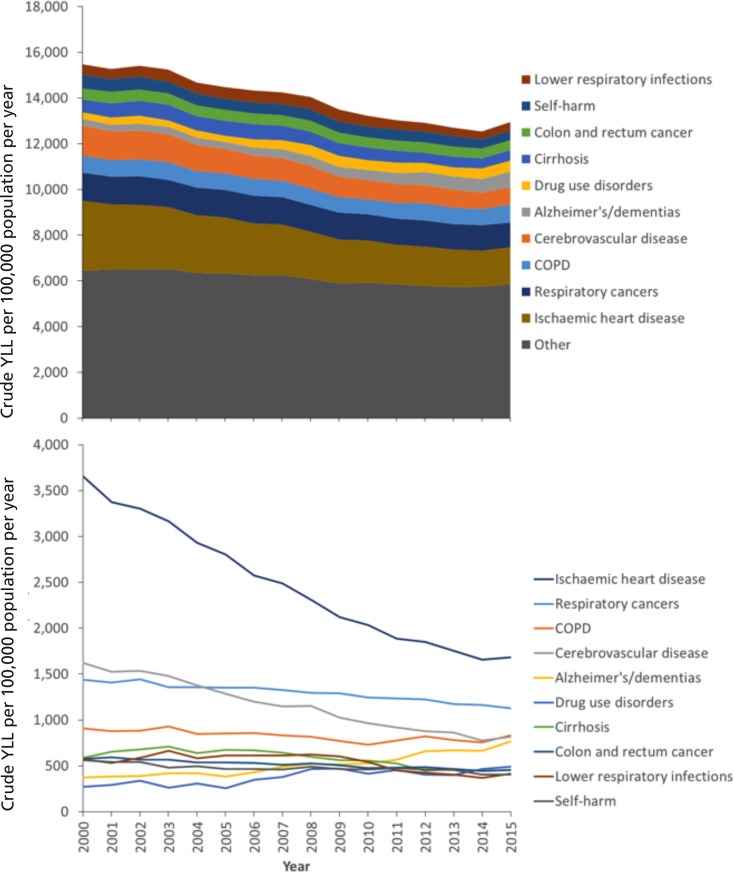
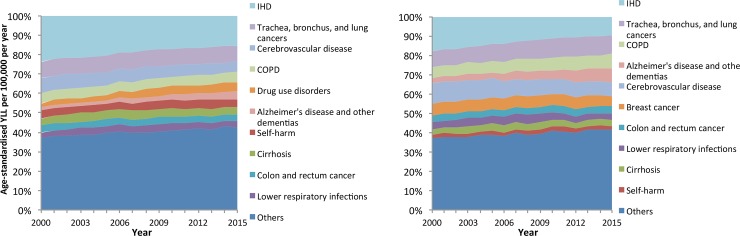
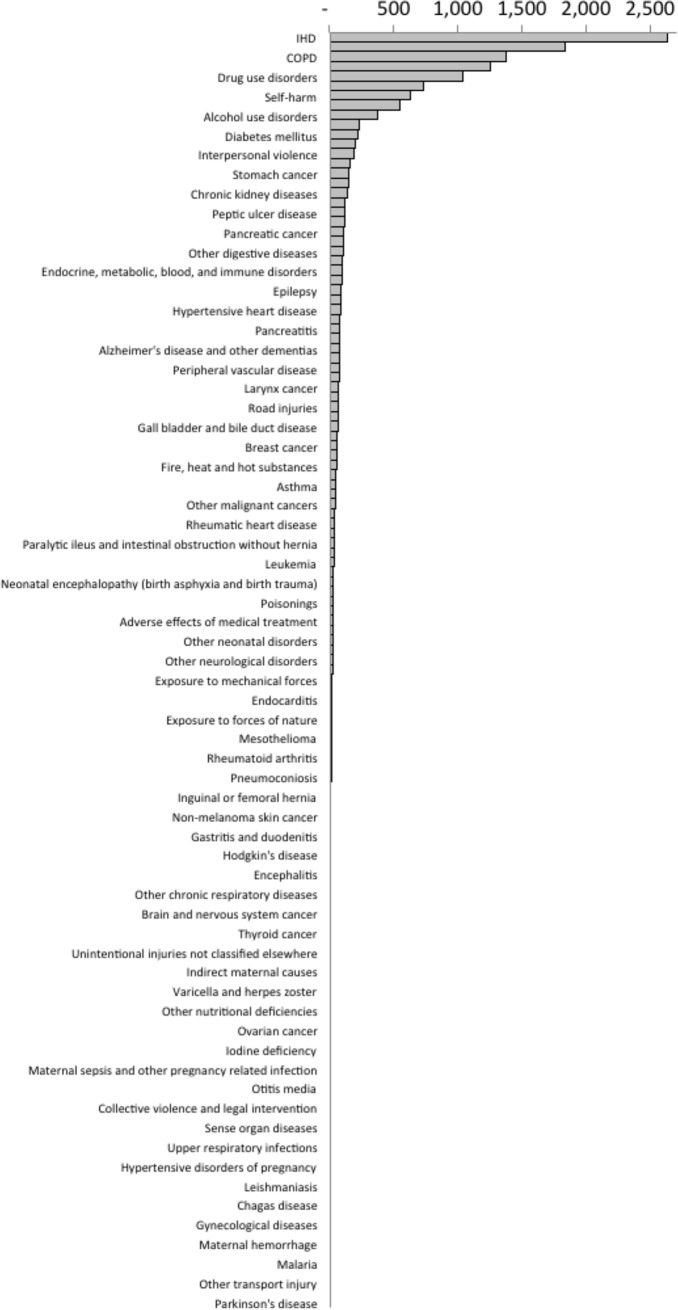
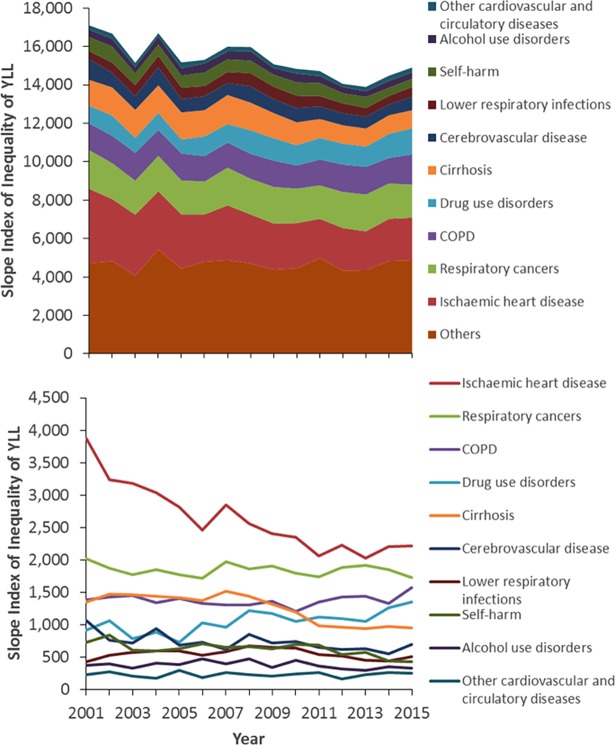
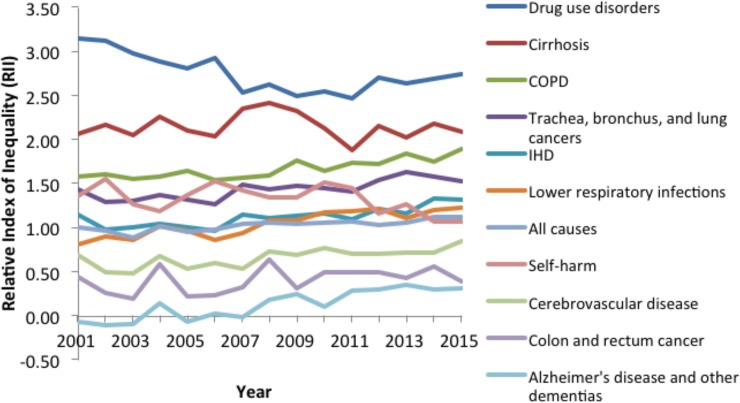
Results: Between 2000 and 2015, the annual percentage of deaths that were ill-defined varied between 10% and 12%. The proportion of deaths that were IDDs increased over time and were more common: in women; amongst those aged 1-4 years, 25-34 years and >80 years; in more deprived areas; and in the island health boards. The total YLL fell from around 17,800 years per 100,000 population in 2000 to around 13,500 years by 2015. The largest individual contributors to YLL were Ischaemic Heart Disease (IHD), respiratory cancers, Chronic Obstructive Pulmonary Disease (COPD), cerebrovascular disease and Alzheimer's/dementia. The proportion of total YLL due to IHD and stroke declined over time, but increased for Alzheimer's/dementia and drug use disorders. There were marked absolute inequalities in YLL by area deprivation, with a mean Slope Index of Inequality (SII) for all causes of 15,344 YLL between 2001 and 2015, with IHD and COPD the greatest contributors. The Relative Index of Inequality (RII) for YLL was highest for self-harm and lower respiratory infections.
Conclusion: The total YLL per 100,000 population in Scotland has declined over time. The YLL in Scotland is predominantly due to a wide range of chronic diseases, substance misuse, self-harm and increasingly Alzheimer's disease and dementia. Inequalities in YLL, in both relative and absolute terms, are stark.
Conflict of interest statement
The authors have declared that no competing interests exist.
Figures
References
-
- Mathers C, Boerma T, Ma Fat D. The Global Burden of Disease: 2004 update. 2008.
-
- Lim SS, Vos T, Flaxman AD, Danaei G, Shibuya K, Adair-Rohani H, et al. A comparative risk assessment of burden of disease and injury attributable to 67 risk factors and risk factor clusters in 21 regions, 1990–2010: a systematic analysis for the Global Burden of Disease Study 2010. Lancet. 2013;380: 2224–2260. - PMC - PubMed
Publication types
MeSH terms
Grants and funding
LinkOut - more resources
Full Text Sources
Other Literature Sources
