. 2018 Aug 1;13(7):e0199239.
doi: 10.1371/journal.pone.0199239. eCollection 2018.

Optimizing colormaps with consideration for color vision deficiency to enable accurate interpretation of scientific data

Affiliations

Optimizing colormaps with consideration for color vision deficiency to enable accurate interpretation of scientific data

Jamie R Nuñez et al. PLoS One. .

Abstract

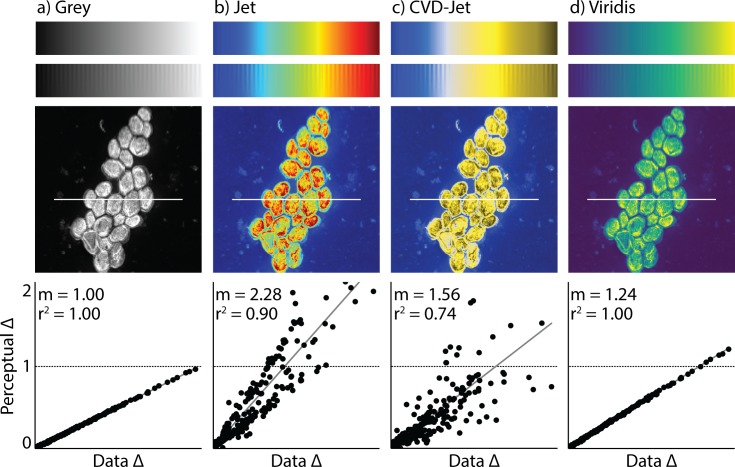
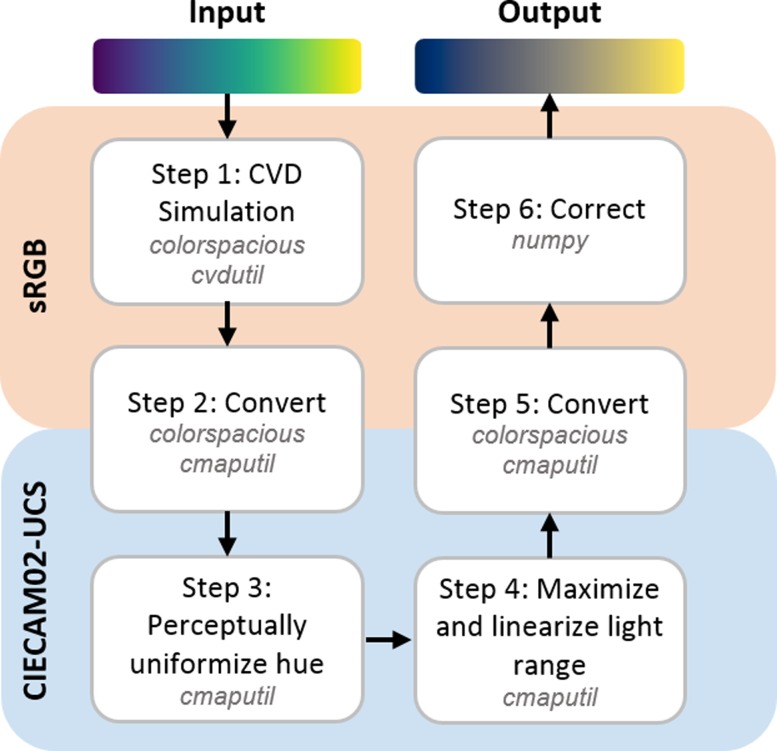
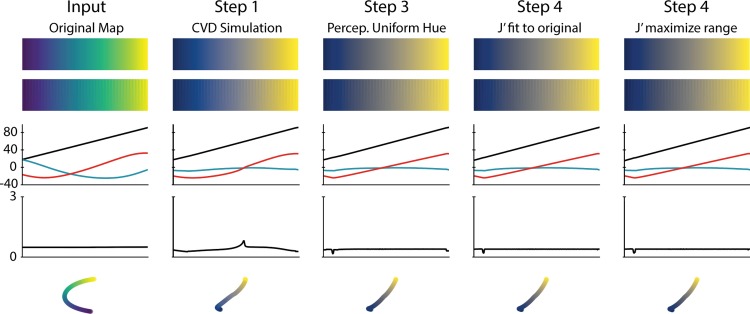
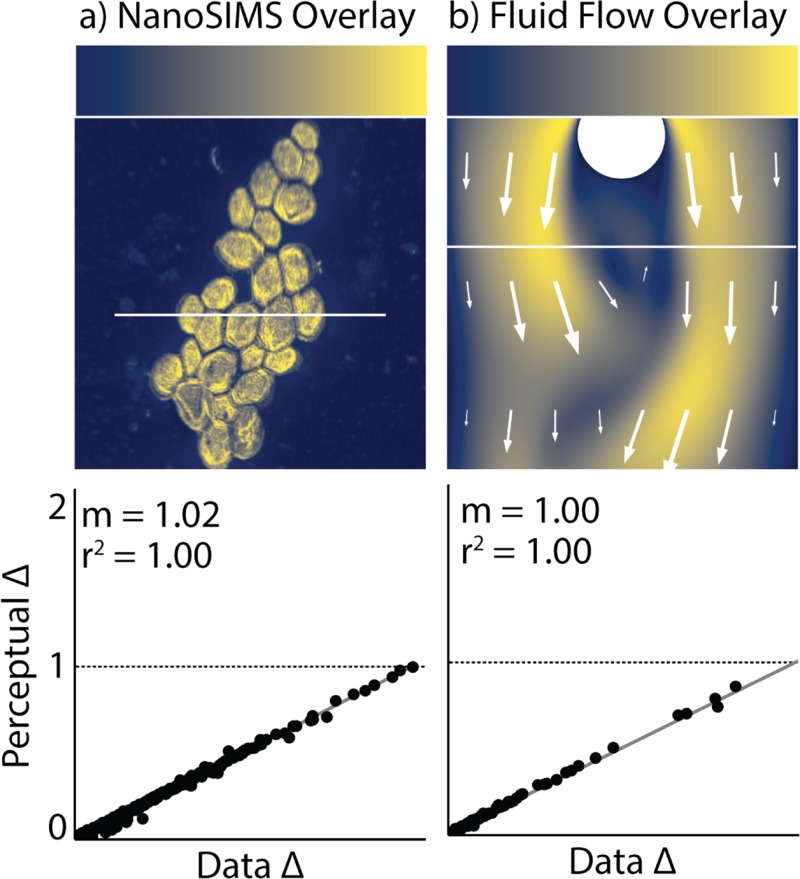
Color vision deficiency (CVD) affects more than 4% of the population and leads to a different visual perception of colors. Though this has been known for decades, colormaps with many colors across the visual spectra are often used to represent data, leading to the potential for misinterpretation or difficulty with interpretation by someone with this deficiency. Until the creation of the module presented here, there were no colormaps mathematically optimized for CVD using modern color appearance models. While there have been some attempts to make aesthetically pleasing or subjectively tolerable colormaps for those with CVD, our goal was to make optimized colormaps for the most accurate perception of scientific data by as many viewers as possible. We developed a Python module, cmaputil, to create CVD-optimized colormaps, which imports colormaps and modifies them to be perceptually uniform in CVD-safe colorspace while linearizing and maximizing the brightness range. The module is made available to the science community to enable others to easily create their own CVD-optimized colormaps. Here, we present an example CVD-optimized colormap created with this module that is optimized for viewing by those without a CVD as well as those with red-green colorblindness. This colormap, cividis, enables nearly-identical visual-data interpretation to both groups, is perceptually uniform in hue and brightness, and increases in brightness linearly.


Conflict of interest statement

The authors have declared that no competing interests exist.

Figures

Fig 1
Fig 1. Example of a misleading colormap.
Comparison between different colormaps overlaid onto the test image by Kovesi and a nanoscale secondary ion mass spectrometry image. Colormaps are as follows: (a) perceptually uniform grayscale, (b) jet, (c) jet as it appears to someone with red-green colorblindness, and (d) viridis [1], the current gold standard colormap. Below each NanoSIMS image is a corresponding “colormap-data perceptual sensitivity” (CDPS) plot, which compares perceptual differences of the colormap to actual, underlying data differences. m is the slope of the fitted line and r2 is the coefficient of determination calculated using a simple linear regression. An example of how the data may be misinterpreted are evident in the bright yellow spots in (b) and (c), which appear to represent significantly higher values than the surrounding regions. However, in fact, the dark red (in b) and dark yellow (in c) actually represent the highest values. For someone who is red-green colorblind, this is made even more difficult to interpret due to the broad, bright band in the center of the colormap with values that are difficult to distinguish.
Fig 2
Fig 2. CVD-safe colorspace in CIECAM02-UCS.
Visual of how limited color vision is for those with CVD. (a) 2D-representation of area of colorspace accessible to those without (black) and with (gray) complete red-green colorblindness as a function of the CIECAM02-UCS parameters (J′, a′, and b′). (b) Fraction of sRGB colors visible as a function of deuteranomaly severity. A severity of 0 corresponds to normal color vision whereas a severity of 100 corresponds to complete dichromacy (i.e. red-green colorblindness in this case).
Fig 3
Fig 3. Script pipeline.
Schematic of our script and how it optimizes colormaps for CVD. The colorspace, either sRGB or CIECAM02-UCS, where each operation takes place is shown along with the Python packages specifically required for each step.
Fig 4
Fig 4. Colormap adjustment iterations.
In this example, the viridis colormap is taken through each stage of our pipeline. From top to bottom, the image plotted is the colormap (i) as it was input, (ii) overlaid on the test image discussed by Peter Kovesi [21], and (iii-v) based on the method presented by the Smith group [1], these show the values of this colormap in CIECAM02-UCS space, with (iii) comparing individual values J′ (black), a′ (blue), and b′ (red) across the map, (iv) showing the perceptual deltas between each point on the map, calculated as the Euclidean distance between each point, and (v) providing a three dimensional view of the colormap in this space.
Fig 5
Fig 5. Our optimal colormap, cividis.
Colormap shown overlaid onto a a) NanoSIMS image and b) fluid velocity map from COMSOL. Below is each corresponding CDPS plot for data along the white lines.

References

    1. Smith N, van der Walt S. mpl colormaps http://bids.github.io/colormap2015.
    1. Rogowitz B, Treinish L, Bryson S. How not to lie with visualization. Comput Phys. 1996;10(3):268–73. 10.1063/1.4822401 - DOI
    1. Nunez J, Renslow R, Cliff III J, Anderton C. NanoSIMS for biological applications: current practices and analyses. Biointerphases. 2018;13(3):03B301 10.1116/1.4993628 - DOI - PubMed
    1. Szafir DA. Modeling Color Difference for Visualization Design. IEEE Transactions on Visualization and Computer Graphics. 2018;24(1):392–401. 10.1109/TVCG.2017.2744359 - DOI - PubMed
    1. Bujack R, Turton TL, Samsel F, Ware C, Rogers DH, Ahrens J. The Good, the Bad, and the Ugly: A Theoretical Framework for the Assessment of Continuous Colormaps. IEEE Transactions on Visualization and Computer Graphics. 2018;24(1):923–33. 10.1109/TVCG.2017.2743978 - DOI - PubMed

Publication types