. 2018 Jul 31;24(5):1105-1112.e5.
doi: 10.1016/j.celrep.2018.06.110.

Ki67 is a Graded Rather than a Binary Marker of Proliferation versus Quiescence

Affiliations

Ki67 is a Graded Rather than a Binary Marker of Proliferation versus Quiescence

Iain Miller et al. Cell Rep. .

Abstract

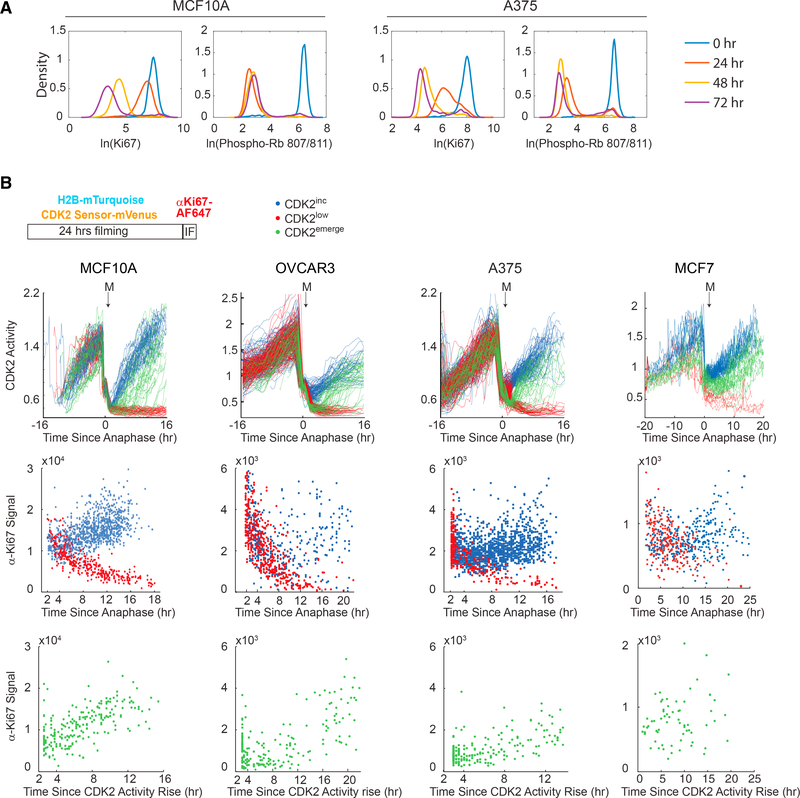
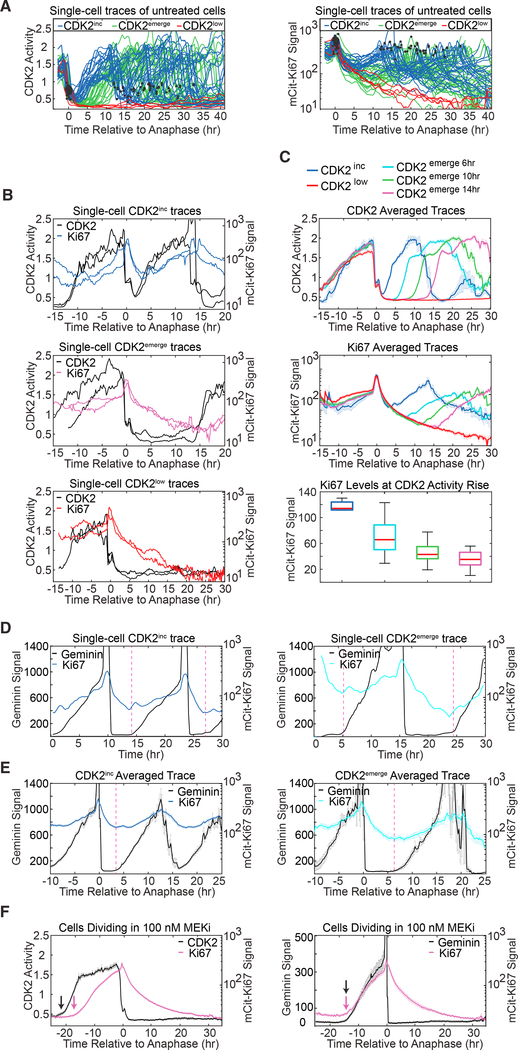
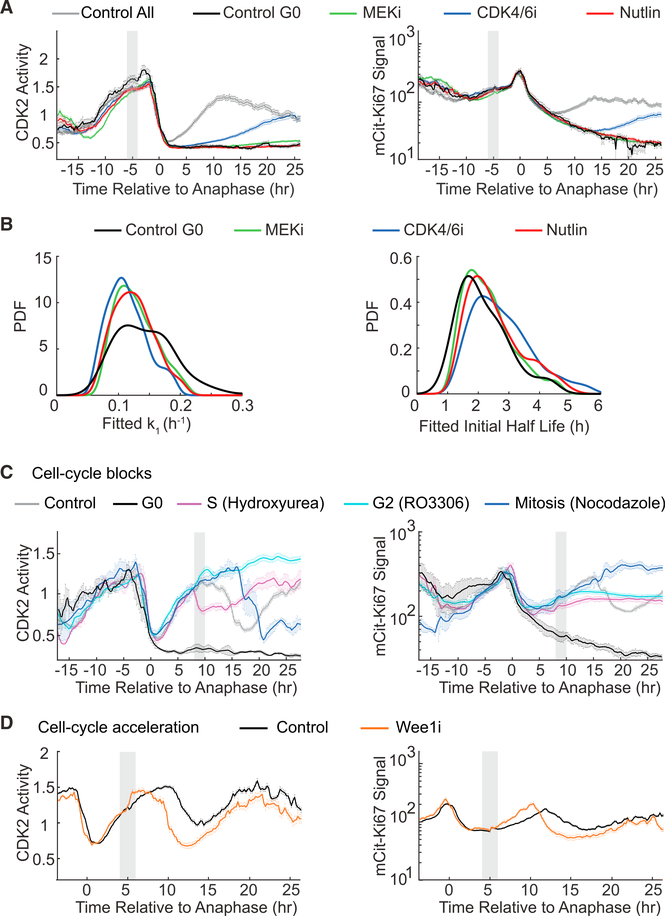
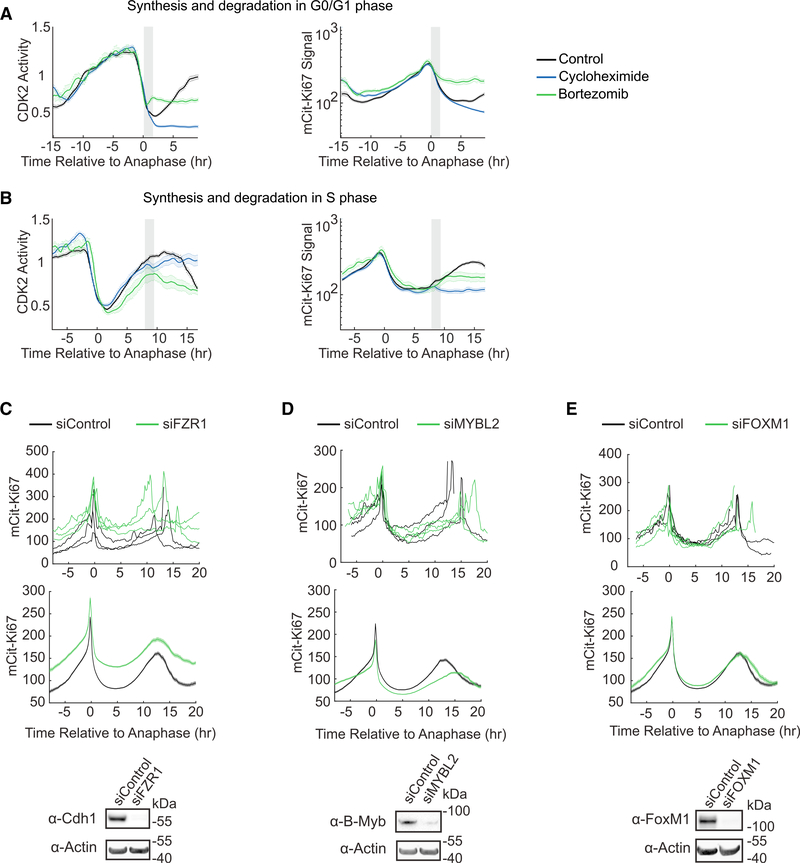
Ki67 staining is widely used as a proliferation indicator in the clinic, despite poor understanding of this protein's function or dynamics. Here, we track Ki67 levels under endogenous control in single cells over time and find that Ki67 accumulation occurs only during S, G2, and M phases. Ki67 is degraded continuously in G1 and G0 phases, regardless of the cause of entry into G0/quiescence. Consequently, the level of Ki67 during G0 and G1 in individual cells is highly heterogeneous and depends on how long an individual cell has spent in G0. Thus, Ki67 is a graded rather than a binary marker both for cell-cycle progression and time since entry into quiescence.

Keywords: CDK2 activity; Ki67; heterogeneity; quiescence; single-cell tracking; time-lapse imaging.


Conflict of interest statement

DECLARATION OF INTERESTS

The authors declare no competing interests.

Figures

Figure 1.
Figure 1.. ΚI67 Is a Graded Rather than a Binary Marker of Proliferation
(A) Probability density of Ki67 and phospho-Rb S807/811 intensity in MCF10A (left) and A375 cells (right) treated with 100 nM MEK inhibitor or 1 μΜ dabrafenib, respectively, for 0, 24, 48, or 72 hr. x-axis units are arbitrary fluorescence units in natural log. n > 1,000 for each condition. (B) Time-lapse imaging and single-cell tracking of CDK2 activity followed by immunofluorescence for Ki67 in MCF10A, OVCAR3, A375, and MCF7 cells. Top: representative traces were computationally aligned to time of anaphase and classified as CDK2lnc (blue), CDk2emerge (green), and CDK2low (red) (Table S1). Middle: α-Ki67 signal was reconstructed as a function of time since anaphase for CDK2inc and CDK2low cells. n = 200–1000. Bottom: CDk2emergecell traces were aligned to the time of CDK2 activity rise, and α-Ki67 signal was reconstructed as a function of time since CDK2 activity rise as in Gookin et al. (2017). n = 70–200. See also Table S1.
Figure 2.
Figure 2.. Ki67 Continuously Decreases in G0/G1 and Rises upon S Phase Entry
(A) Single-cell traces of CDK2 activity (left) and mCitrine- Ki67 (right) for asynchronously cycling MCF10A cells. Cells were selected based on their time of anaphase and then classified as CDK2inc, CDK2emerge, or CDK2low based on CDK2 activity (STAR Methods). Black dots indicate individual mitosis events. Only CDK2emerge cells re-entering the cell cycle within 12 hr of their previous mitosis are shown here for clarity. CDK2inc, n = 40; CDK2emerge, n = 40; CDK2low, n = 4. (B) CDK2 activity and mCitrine-Ki67 traces in MCF10A for two individual CDK2inc cells (top), CDK2emerge cells re-entering the cell cycle 14 hr after mitosis (middle), and CDK2low cells (bottom). (C) Averaged single-cell MCF10A traces of CDK2 activity (top) or mCitrine-Ki67 (middle) computationally aligned to time of anaphase, for each group of cells indicated. Boxplot quantifies Ki67 levels at the time CDK2 activity begins to rise (bottom). CDK2inc, n = 7; CDK2emerge 6hr, n = 66; CDK2emerge 10hr, n = 69; CDK2emerge 14hr, n = 56; and CDK2low, n = 84. (D) Single-cell traces of MCF10A mCitrine-Ki67 knock-in cells stably expressing mCherry-Geminin are plotted for one rapidly cycling cell (left) and one cell entering S phase 8 hr after anaphase (right). Geminin is rapidly degraded in anaphase. The dashed vertical lines mark the Geminin rise time and start of S phase, which occurs concurrently with the rise in Ki67. (E) Averaged single-cell traces of Geminin and Ki67 aligned to anaphase for cells entering S phase 4 hr (left; n = 13) or 7–8 hr (right; n = 9) after anaphase. Dashed line denotes the start of S phase based on the Geminin signal. (F) Rare mCitrine-Ki67 knockin MCF10A cells that escape from 100 nM MEK inhibitor after a long quiescence. Cells were treated with MEK inhibitor for 48 hr prior to live-cell imaging. Left: MCF10A mCitrine-Ki67 knockin cells expressing the CDK2 activity sensor; the black arrow marks the CDK2 activity rise time, and the magenta arrow marks the Ki67 rise time; n = 57. Right: mCitirine-Ki67 knockin cells expressing the Geminin FUCCI sensor; black and magenta arrows mark the Geminin rise time and the Ki67 rise time, respectively, which coincide with the start of S phase. n = 20. (C, E, and F) Error bars represent standard error of mean (SEM).
Figure 3.
Figure 3.. Ki67 Levels Are Hardwired into Cell-Cycle Progression and Cell-Cycle Exit
(A, C, and D) Averaged single-cell MCF10A traces for CDK2 activity (left column) or mCitrine-Ki67 (right column) computationally aligned to time of anaphase. Gray boxes indicate windows of drug addition. Error bars represent SEM. (A) Averaged traces of all untreated cells (Control All; n = 200); untreated spontaneous CDK2low cells (Control G0; n = 18); or cells exposed to MEK inhibitor(n = 200), CDK4/6 inhibitor (n = 200), or Nutlin (n = 88). The rise of CDK2 acitivity and Ki67 under CDK4/6i treatment results from a few cells escaping drug action. (B) Distribution of fitted Ki67 decay parameters are similar across different quiescence-inducing conditions. Single-cell Ki67 traces were fit with first-order kinetics (left) or second-order kinetics (right) from 2 hr after mitosis until the end of the traces. PDF, probability density function. (C) Averaged traces of untreated CDK2inc cells (Control; n = 67); untreated spontaneous CDK2low cells (G0; n = 7); or CDK2inc cells blocked by hydroxyurea in S phase (n = 7), RO3306 in G2 phase (n = 16), or nocodazole in mitosis (n = 6). (D) CDK2inc cells treated with Wee1 inhibitor (n = 428) or left untreated (n = 25).
Figure 4.
Figure 4.. Cell-Cycle-Dependent Synthesis and Degradation Regulate Ki67 Dynamics
(A and B) Averaged CDK2 (left) or mCitrine-Ki67 (right) traces of untreated cells, cells treated with cycloheximide, or cells treated with bortezomib in G0/G1 (A) (top, n = 136, 80, 27, respectively) or S phase (B) (bottom, n = 151, 142, and 28, respectively). Gray boxes indicate windows of drug addition. Error bars represent SEM. (C-E) Dynamics of mCitrine-Ki67 after FZR1 (C), MYBL2 (D), or FOXM1 (E) knockdown: three randomly selected single cells (top), mean ± SEM of atleast 1,000 single-cell traces (middle), and immunoblots from cells transfected with the indicated siRNAs to confirm knockdown (bottom).

Comment in

References

    1. Cappell SD, Chung M, Jaimovich A, Spencer SL, and Meyer T (2016). Irreversible APC(Cdh1) inactivation underlies the point of no return for cell-cycle entry. Cell 166, 167–180. - PMC - PubMed
    1. Cidado J, Wong HY, Rosen DM, Cimino-Mathews A, Garay JP, Fessler AG, Rasheed ZA, Hicks J, Cochran RL, Croessmann S, et al. (2016). Ki-67 is required for maintenance of cancer stem cells but not cell proliferation. Oncotarget 7, 6281–6293. - PMC - PubMed
    1. Cuylen S, Blaukopf C, Politi AZ, M€uller-Reichert T, Neumann B, Poser I, Ellenberg J, Hyman AA, and Gerlich DW (2016). Ki-67 acts as a biological surfactant to disperse mitotic chromosomes. Nature 535, 308–312. - PMC - PubMed
    1. Dowsett M, and Dunbier AK (2008). Emerging biomarkers and new understanding of traditional markers in personalized therapy for breast cancer. Clin. Cancer Res 14, 8019–8026. - PubMed
    1. Fischer M, Grossmann P, Padi M, and DeCaprio JA (2016). Integration of TP53, DREAM, MMB-FOXM1 and RB-E2F target gene analyses identifies cell cycle gene regulatory networks. Nucleic Acids Res. 44, 6070–6086. - PMC - PubMed

Publication types