. 2018 Jul 31;24(5):1136-1150.
doi: 10.1016/j.celrep.2018.06.065.

Autophagy Is a Tolerance-Avoidance Mechanism that Modulates TCR-Mediated Signaling and Cell Metabolism to Prevent Induction of T Cell Anergy

Affiliations

Autophagy Is a Tolerance-Avoidance Mechanism that Modulates TCR-Mediated Signaling and Cell Metabolism to Prevent Induction of T Cell Anergy

Enric Mocholi et al. Cell Rep. .

Abstract

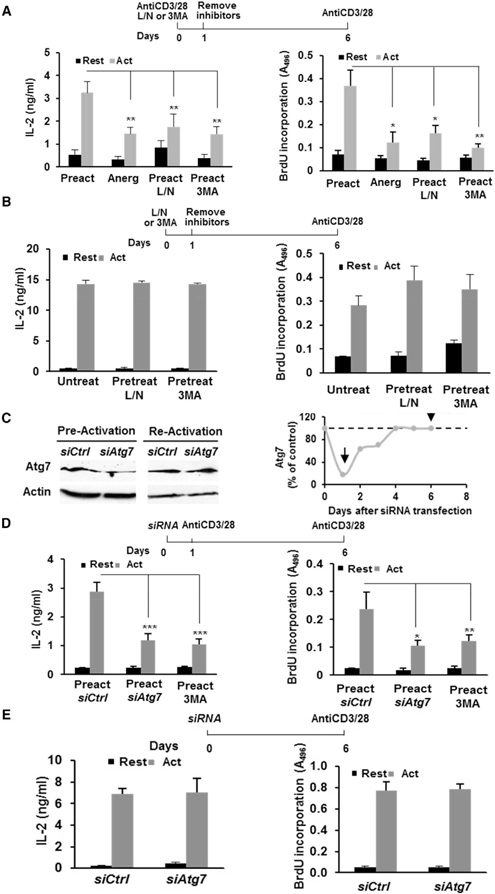
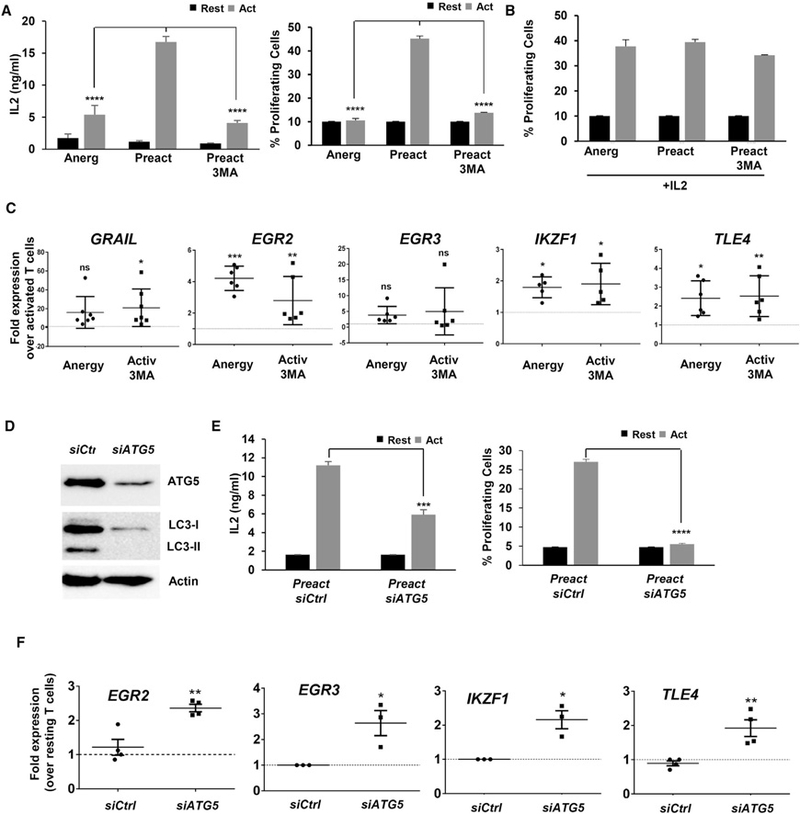
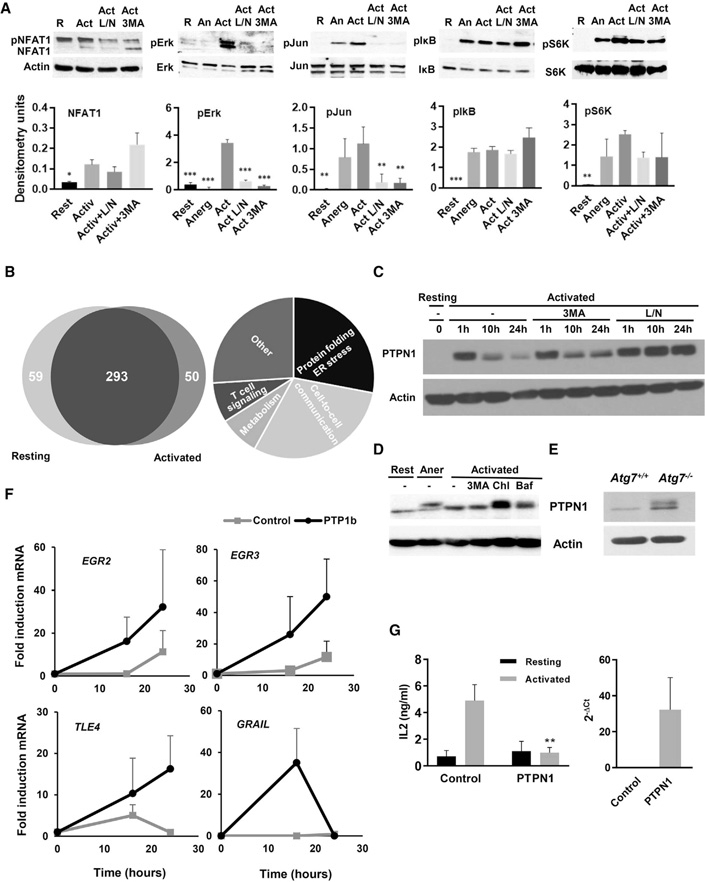
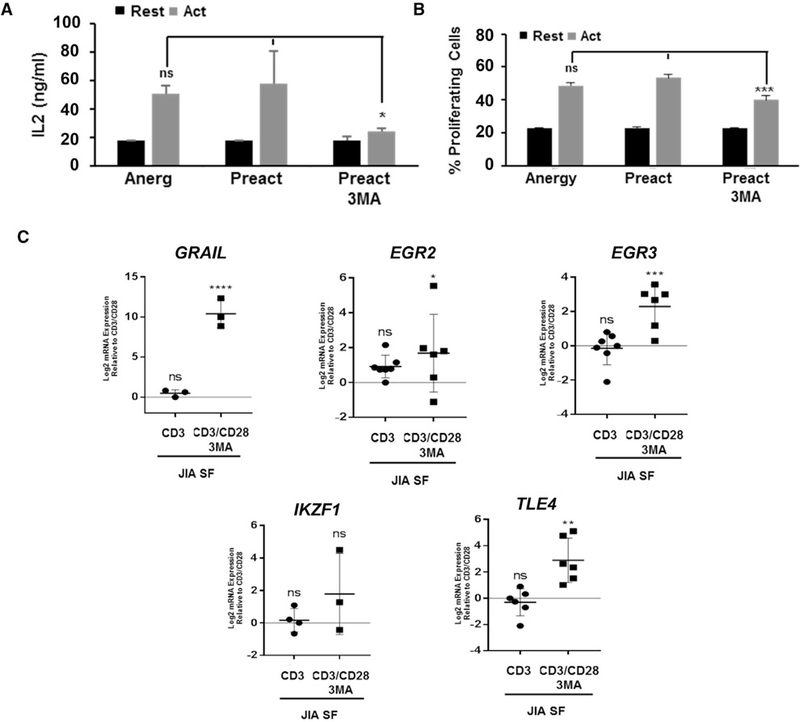
In response to activation, CD4+ T cells upregulate autophagy. However, the functional consequences of that upregulation have not been fully elucidated. In this study, we identify autophagy as a tolerance-avoidance mechanism. Our data show that inhibition of autophagy during CD4+ T cell activation induces a long-lasting state of hypo-responsiveness that is accompanied by the expression of an anergic gene signature. Cells unable to induce autophagy after T cell receptor (TCR) engagement show inefficient mitochondrial respiration and decreased turnover of the protein tyrosine phosphatase PTPN1, which translates into defective TCR-mediated signaling. In vivo, inhibition of autophagy during antigen priming induces T cell anergy and decreases the severity of disease in an experimental autoimmune encephalomyelitis mouse model. Interestingly, CD4+ T cells isolated from the synovial fluid of juvenile idiopathic arthritis patients, while resistant to suboptimal stimulation-induced anergy, can be tolerized with autophagy inhibitors. We propose that autophagy constitutes a tolerance-avoidance mechanism, which determines CD4+ T cell fate.

Keywords: T cell; anergy; autoimmunity; autophagy.


Conflict of interest statement

DECLARATION OF INTERESTS

The authors declare no competing interests.

Figures

Figure 1.
Figure 1.. Inhibition of Autophagy during Activation Induces a Hyporesponsive State in T Helper Cells
(A) IL-2 production and cell proliferation in Th1 cells pre-activated (Preact) for 24 hr in the presence or absence of L/N or 3MA or anergized (Anerg) with anti-CD3, washed, and re-stimulated after 5 days. (B)IL-2 production and cell proliferation in Th1 cells cultured in the presence of L/N or 3MA for 24 hr (Pretreat), washed to remove inhibitors, and stimulated. (C)Immunoblot showing Atg7 levels in Th1 cells transfected with a non-targeting (Ctrl) or an Atg7-specific siRNA, 1 or 6 days after transfection. β-Actin was used as control. Quantification of relative Atg7 levels at different time points after transfection is also shown. Arrows mark times of pre- and re-stimulation. (D and E) IL-2 production and cell proliferation in Th1 cells transfected with Ctrl or Atg7 siRNAs, pre-activated 1 day after transfection (D) or left untreated (E), and then re-stimulated. T cells pre-activated in the presence of 3MA as in (A) are included as a control. Data represent mean and SEM from 5 (A), 3 (B), 4 (D), or 3 (E) different experiments. *p < 0.05; **p < 0.01, ANOVA with Tukey post-test for (A)–(D); two-tailed t test for (E). Act, stimulated; Rest, resting. See also Figures S1 and S2.
Figure 2.
Figure 2.. Autophagy Inhibition during Stimulation Induces T Cell Anergy
(A) Expression of anergy-associated genes (qPCR) in Th1 cells activated in the presence or absence of L/N or 3MA. (B) Expression of anergy-associated genes (qPCR) in cells transfected with non-targeting (Ctrl) or Atg7-specific siRNAs and activated for 24 hr. (C) Foxp3 gene expression (qPCR) in Th1 cells activated in the presence or absence of 3MA. mRNA obtained from purified Tregs is included as control. (D)Th1 cells were anergized with anti-CD3 (Anerg), activated in the absence (Preact) or presence of L/N (Preact-L/N) or 3MA (Preact-3MA) for 24 hr. Cells were washed to remove inhibitors, cultured for 5 days with 50 ng/mL IL-2, and re-stimulated. IL-2 production and cell proliferation were measured. (E) IL-2 and cell proliferation were measured as in (D) in cells transfected with Ctrl or Atg7 siRNAs 24 hr prior to pre-activation. (F) Wild-type or NFAT1-deficient Th1 cells were stimulated for 24 hr in the presence or absence of 3MA. Cells were washed and re-stimulated after 5 days to measure IL-2 production and cell proliferation. Data represent mean + SEM from 3 (A–C), 4 (D and E), or 5 (F) different experiments. *p < 0.05; **p < 0.01; ***p < 0.001, ANOVA with Tukey post-test for (A), (C), (D), and (F); two-tailed t test for (B) and (E). See also Figures S2–S4.
Figure 3.
Figure 3.. Inhibition of Autophagy during Activation Induces an Anergic State in Human T Cells
(A) Human CD4+ T cells were stimulated for 24 hr in the presence or absence of 3MA. Cells were washed to remove inhibitors and re-stimulated after 5 days. IL-2 production and cell proliferation were measured after 48 hr and 4 days, respectively. Data show mean + SEM of three experiments. ****p < 0.0001 (ANOVA). (B) Human CD4+ T cells were activated in the presence or absence 3MA as in (A). After washing, cells were grown for 5 days with 50 ng/mL IL-2 and re-stimulated. Cell proliferation was measured. (C) Expression of anergy-associated gene (qPCR) in human CD4+ T cells activated in the presence or absence of 3MA for 24 hr. B2M expression was used as normalization control. Values (mean ± SEM) from three experiments are expressed as fold increase relative to control cells activated in the absence of any inhibitor. *p < 0.05; **p < 0.01; ***p < 0.001 (ANOVA). ns, not significant. (D and E) Human CD4+ T cells activated and transfected with either a non-targeting (Ctrl) or an ATG5-specific siRNA. (D) ATG5 and LC3 detected by immunoblot after activation 24 hr post-siRNA transfection. β-ACTIN was used as control. (E) IL-2 production and cell proliferation in cells re-stimulated 5 days after siRNA transfection. Data are mean + SEM of three experiments. ***p < 0.001; ****p < 0.0001 (two-tailed t test). (F) Expression of anergy-associated genes (qPCR) in control or ATG5 siRNA-transfected cells activated for 24 hr. B2M expression was used as normalization control. Values (mean ± SEM) of three different experiments are expressed as fold increase relative to control untransfected cells. *p < 0.05; **p < 0.01. Act, stimulated; Rest, resting.
Figure 4.
Figure 4.. In Vivo Inhibition of Autophagy Induces CD4+ T Cell Tolerance and Decreases the Severity of MOG-Induced EAE
(A–C) Wild-type or NFAT1-deficient OT-II (CD90.2+) T cells were transferred into congenic C57BL/6 (CD90.1+) mice (A). 24 hours later, mice were challenged with subcutaneous OVA323–339 in CFA. For each group, half of the mice were randomly treated with chloroquine and half with PBS for 6 days. IL-2 production (B) and Grail and Egr2 expression (C) were determined in purified OT-II T cells from the draining lymph nodes and stimulated ex vivo with T cell-depleted splenocytes loaded with OVA323–339. (D) Atg7 content and autophagy flux (LC3-II turnover) measured by immunoblot in resting and activated CD4+ T cells isolated from Atg7/ or wild-type mice. (E) EAE scores of Atg7/ or wild-type littermate mice immunized with MOG35–55 peptide. (F) Histological analyses of lumbar spinal cord sections from EAE Atg7/ or wild-type mice. (G) EAE was induced in C57BL/6 mice that were divided in two groups that received daily injections of PBS or chloroquine in PBS (Chloro). EAE scores were recorded daily. (H) Histological analyses of lumbar spinal cord sections from untreated and chloroquine-treated EAE mice. (I and J) Experiments were performed as in (G) and (H) but using NFAT1-deficent mice. Data represent mean + SEM from four different experiments (B and C). *p < 0.05; **p < 0.01; ns, not significant (ANOVA with Tukey post-test in B and two-tailed t test in C). For (E)–(G), data represent mean and SEM from 8 (E), 10 (G), or 4 (I) different mice from 2 independent experiments. *p < 0.05; **p < 0.01; ***p < 0.001 (Mann-Whitney test). See also Figure S4.
Figure 5.
Figure 5.. Inhibition of Autophagy during T Cell Activation Results in Decreased Metabolic Output
(A and B) OCR (A) and ECAR (B) measured in activated Th1 cells in the absence or presence of 3MA or L/N. (C and D) IL-2 production (C) and cell proliferation (D) of Th1 cells pre-activated in the presence or absence of oligomycin (Oligo) or 2-deoxyglucose (2DG) for 24 hr, washed, and re-stimulated 5 days later. (E and F) IL-2 production (E) and cell proliferation (F) of Th1 cells left untreated or treated with oligomycin for 24 hr, washed, and stimulated 5 days later. Data represent mean + SEM from four (A and B) or three (C–F) different experiments. *p < 0.05; **p < 0.01 (ANOVA with Tukey post-test). See also Figure S5.
Figure 6.
Figure 6.. Autophagy Regulates PTPN1 Turnover in T Helper Cells
(A) Immunoblots using total cell lysates prepared from resting T cells (R), and cells anergized by stimulation with anti-CD3 (An) or activated for 8–12 hr in the absence (Act) or presence of either leupeptin and L/N or 3MA. Graph bars show mean + SD of quantifications of immunoblots from three different experiments. ANOVA with Tukey post hoc test: *p < 0.05; **p < 0.01; ***p < 0.001, relative to activated cells. (B) Analysis of the proteome of autophagosomes isolated from resting or activated Th1 cells, showing functional groups representing those proteins enriched in autophagosomes in activated T cells. (C) Immunoblot of PTPN1 on total cell lysates from resting Th1 cells or cells activated at different time points in the presence or absence of 3MA or L/N. (D) Immunoblot of PTPN1 on total cell lysates from human resting CD4+ T cells or cells activated in the presence or absence of 3MA, chloroquine (Chl), or bafilomycin (Baf). (E) Immunoblot of PTPN1 on lysates from CD4+ T cells isolated from Atg7+/+ or Atg7−/− mice. (F) Expression of EGR2, EGR3, TLE4, and GRAIL (qPCR) at different time points following activation with anti-CD3 and anti-CD28 in human CD4+ T cells transfected with a control plasmid or a plasmid expressing human PTPN1. Data show mean ± SEM from three independent experiments. (G) IL-2 and PTPN1 expression in human CD4+ T cells transfected with a control plasmid or a plasmid expressing human PTPN1 and stimulated 24 hr later with plate-bound anti-CD3 and anti-CD28 for 24 hr. Data represent mean + SEM from three different experiments (t test; **p < 0.01, comparing activated samples). See also Figure S6.
Figure 7.
Figure 7.. Autophagy Inhibitors Induce Anergy in T Cells from JIA Patients Resistant to Canonical Anergy Induction
(A and B) IL-2 production (A) and cell proliferation (B) measured in synovial fluid (SF) CD4+ T cells obtained from JIA patients pre-stimulated with plate-bound anti-CD3 and anti-CD28 antibodies for 24 hr (Preact) in the presence or absence of 3MA, washed to remove the inhibitors, and re-stimulated 5 days later. Data show mean ± SEM from three independent experiments. *p < 0.05; ***p < 0.001 (ANOVA). ns, not significant. (C) Anergy-associated gene expression (qPCR) in SF JIA CD4+ T cells activated with anti-CD3 or with anti-CD3 and anti-CD28 in the presence or absence of 3MA. B2M expression was used as normalization control. Values (mean ± SEM) are expressed as fold increase relative to control activated cells. *p < 0.05; **p < 0.01; ***p < 0.001; ****p < 0.0001 (ANOVA). See also Figure S7.

References

    1. Ben-Zvi I, Kivity S, Langevitz P, and Shoenfeld Y (2012). Hydroxychloroquine: from malaria to autoimmunity. Clin. Rev. Allergy Immunol 42, 145–153. - PMC - PubMed
    1. Botbol Y, Patel B, and Macian F (2015). Common γ-chain cytokine signaling is required for macroautophagy induction during CD4+ T-cell activation. Autophagy 11, 1864–1877. - PMC - PubMed
    1. Boussiotis VA, Freeman GJ, Berezovskaya A, Barber DL, and Nadler LM (1997). Maintenance of human T cell anergy: blocking of IL-2 gene transcription by activated Rap1. Science 278, 124–128. - PubMed
    1. Carr EL, Kelman A, Wu GS, Gopaul R, Senkevitch E, Aghvanyan A, Turay AM, and Frauwirth KA (2010). Glutamine uptake and metabolism are coordinately regulated by ERK/MAPK during T lymphocyte activation. J. Immunol 185, 1037–1044. - PMC - PubMed
    1. Chang CH, Curtis JD, Maggi LB Jr., Faubert B, Villarino AV, O’Sullivan D, Huang SC, van der Windt GJ, Blagih J, Qiu J, et al. (2013). Post-transcriptional control of T cell effector function by aerobic glycolysis. Cell 153, 1239–1251. - PMC - PubMed

Publication types

Substances