

Estimating dengue incidence and hospitalization in Malaysia, 2001 to 2013
- PMID: 30068318
- PMCID: PMC6090758
- DOI: 10.1186/s12889-018-5849-z
Estimating dengue incidence and hospitalization in Malaysia, 2001 to 2013
Abstract
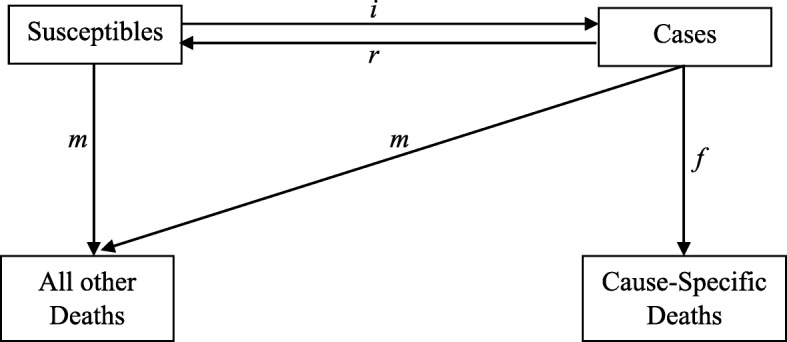
Background: Epidemiologic measures of the dengue burden such as prevalence and incidence are important for policy-making and monitoring the progress of disease control. It is a common practice where epidemiologic and economic research estimate dengue burden based on notification data. However, a basic challenge in estimating the incidence of dengue is that a significant proportion of infected population are asymptomatic. It can be overcome by using mathematical models that relate observed prevalence and mortality to incidence. In this study, we estimate the trend of dengue incidence and hospitalization in Malaysia.
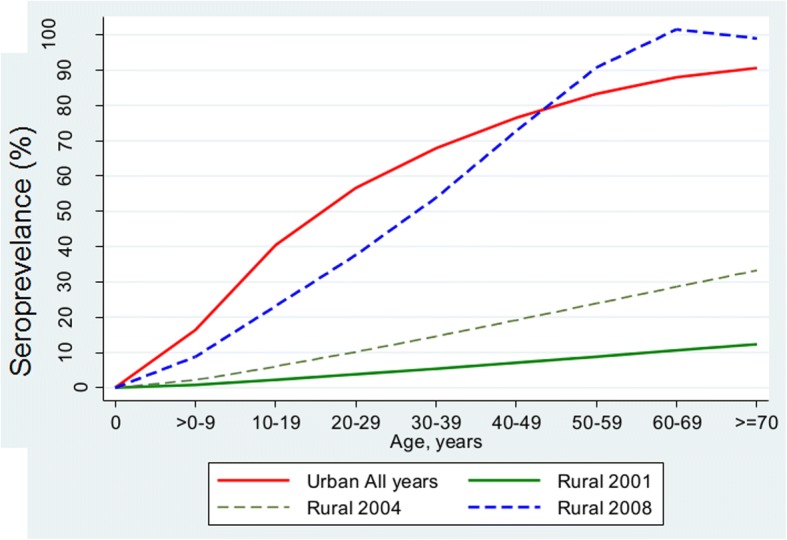
Methods: This study is based entirely on the available secondary data sources on dengue in Malaysia. The age-specific incidence of dengue between 2001 and 2013 was estimated using the prevalence and mortality estimates in an incidence-prevalence-mortality (IPM) model. Data on dengue prevalence were extracted from six sero-surveys conducted in Malaysia between 2001 and 2013; while statistics on dengue notification and Case Fatality Rate were derived from National Dengue Surveillance System. Dengue hospitalization data for the years 2009 to 2013 were extracted from the Health Informatics Centre and the volumes of dengue hospitalization for hospitals with missing data were estimated with Poisson models.
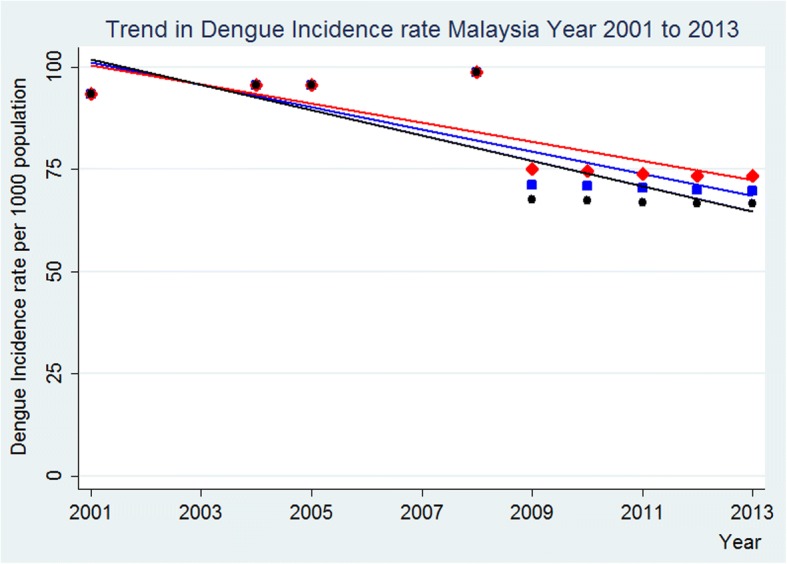
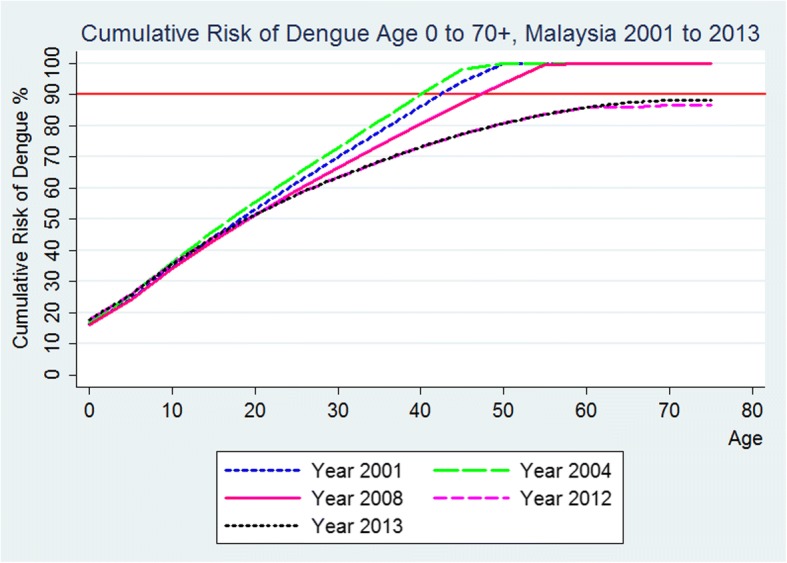
Results: The dengue incidence in Malaysia varied from 69.9 to 93.4 per 1000 population (pkp) between 2001 and 2013.The temporal trend in incidence rate was decreasing since 2001. It has been reducing at an average rate of 2.57 pkp per year from 2001 to 2013 (p = 0.011). The age-specific incidence of dengue decreased steadily with dengue incidence reaching zero by age > 70 years. Dengue notification rate has remained stable since 2001 and the number of notified cases each year was only a small fraction of the incident cases (0.7 to 2.3%). Similarly, the dengue hospitalization was larger but still a small fraction of the incident cases (3.0 to 5.6%).
Conclusion: Dengue incidence can be estimated with the use of sero-prevalence surveys and mortality data. This study highlights a reducing trend of dengue incidence in Malaysia and demonstrates the discrepancy between true dengue disease burden and cases reported by national surveillance system. Sero-prevalence studies with representative samples should be conducted regularly to allow better estimation of dengue burden in Malaysia.
Keywords: Dengue; Hospitalization; Incidence; Malaysia; Notification; Time trend.
Conflict of interest statement
The authors declare that they have no competing interest.
This study is based entirely on the available secondary data sources on dengue in Malaysia. The Medical and Research Ethics Committee (MREC) from MOH approved the study (NMRR-16-2301-33,463).
Not applicable, as all data were anonymized in this study, no personal data presented.
Springer Nature remains neutral with regard to jurisdictional claims in published maps and institutional affiliations.
Figures


References
-
- WHO . Global strategy for dengue prevention and control. Geneva: World Health Organization; 2012.
-
- Beatty ME, Letson GW, Margolis HS. Estimating the global burden of dengue. Am J Trop Med Hyg. 2009;81(Suppl. 1):231.
MeSH terms
LinkOut - more resources
Full Text Sources
Other Literature Sources
Medical
