. 2018 Sep 27;132(13):1426-1437.
doi: 10.1182/blood-2018-05-850859. Epub 2018 Aug 1.

Cooperative PSGL-1 and CXCR2 signaling in neutrophils promotes deep vein thrombosis in mice

Affiliations

Cooperative PSGL-1 and CXCR2 signaling in neutrophils promotes deep vein thrombosis in mice

Tadayuki Yago et al. Blood. .

Abstract

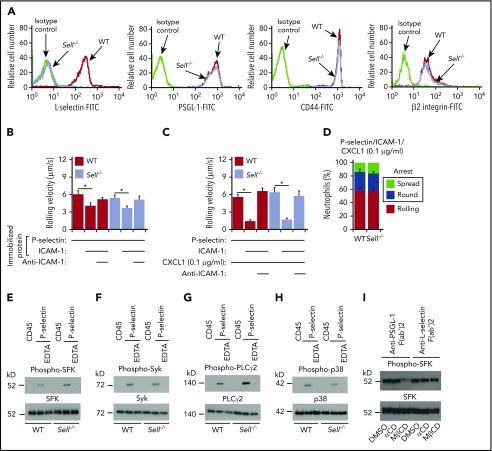
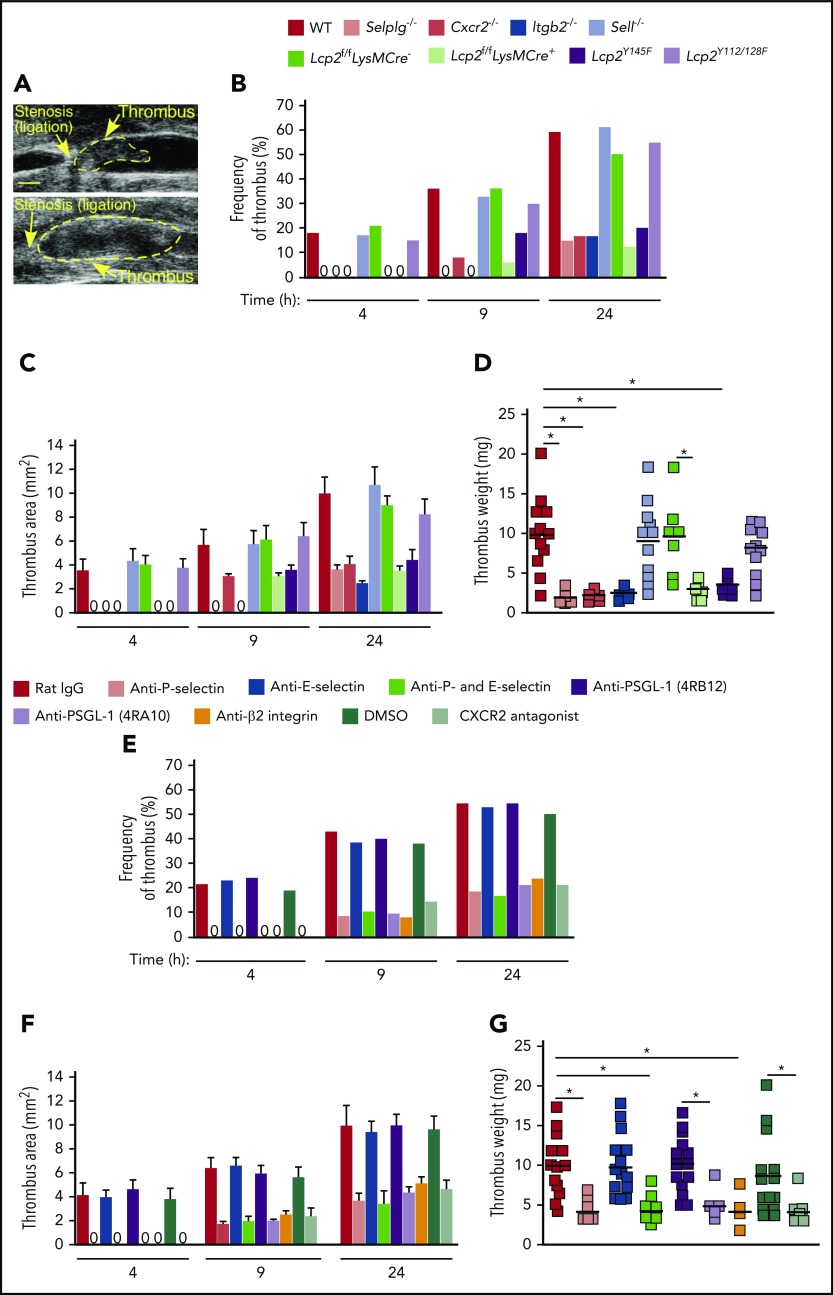
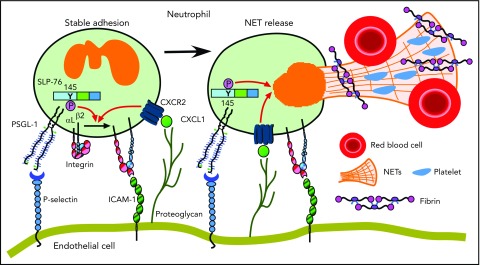
Inflammation is a major contributor to deep vein thrombosis (DVT). Flow restriction of the inferior vena cava (IVC) in mice induces DVT like that in humans. In this model, P-selectin-dependent adhesion of neutrophils and monocytes leads to release of neutrophil extracellular traps (NETs) and expression of tissue factor. However, it is not known what signals cause myeloid cells to generate these procoagulant effectors. Using ultrasonography and spinning-disk intravital microscopy in genetically engineered mice, we found that engagement of P-selectin glycoprotein ligand-1 (PSGL-1) and the chemokine receptor CXCR2 on rolling neutrophils propagated signals that cooperated to induce β2 integrin-dependent arrest in flow-restricted IVCs. Unlike previous reports, PSGL-1 signaling in neutrophils did not require L-selectin, and it used tyrosine 145 rather than tyrosines 112 and 128 on the adaptor Src homology domain-containing leukocyte phosphoprotein of 76 kDa. PSGL-1 and CXCR2 signaling cooperated to increase the frequency and size of thrombi, in part by stimulating release of NETs. Unlike in neutrophils, blocking PSGL-1 or CXCR2 signaling in monocytes did not affect their recruitment into thrombi or their expression of tissue factor. Our results demonstrate that neutrophils cooperatively signal through PSGL-1 and CXCR2 to promote DVT.


Conflict of interest statement

Conflict-of-interest disclosure: R.P.M. is a cofounder of Selexys Pharmaceuticals, now part of Novartis AG, and of Tetherex Pharmaceuticals. The remaining authors declare no competing financial interests.

Figures

None
Graphical abstract
Figure 1.
Figure 1.
Cooperative PSGL-1 and CXCR2 signaling in neutrophils enhances adhesion in flow-restricted IVC. (A) Top, Sagittal view of B-mode ultrasonography confirms stenosis of the IVC after ligation. The cephalic and caudal directions are marked. Bar, 1 mm. Bottom, Color Doppler mode in B-mode sagittal view reveals the flow direction in the IVC around the stenosis. The blue color indicates blood flowing toward the transducer, from right (caudal) to left (cephalic). The red color indicates blood flowing away from the transducer, from left (cephalic) to right (caudal). (B) Blood flow in the IVC was quantified by pulse Doppler mode before and after ligation. (C) Representative images of CXCL1 expression (green) and adherent Ly6G+ neutrophils (red) in the IVC of WT mice obtained with spinning-disk intravital microscopy. PE-conjugated anti-Ly6G mAb and Fluoresbrite green beads coated with anti-CXCL1 mAb were injected IV into WT mice 1 hour before sham surgery or surgical ligation. Top, Three hours after sham surgery; middle, 15 minutes after ligation; bottom, 3 hours after ligation. Bar, 10 μm. (D) Number of rolling neutrophils per minute per microscopic field 3 hours after ligation (vertical axis). Circulating neutrophil count for each genotype (horizontal axis). (E) Quantification of endothelial surface area covered with firmly adherent neutrophils 3 hours after ligation. The data in the graphs represent the mean ± standard error of the mean (SEM) from 5 mice in each group. *P < .05.
Figure 2.
Figure 2.
PSGL-1 and integrin signaling pathways in neutrophils require distinct tyrosine residues on SLP-76. (A-D) Bone marrow leukocytes (A-B) of the indicated genotype were incubated on immobilized control CD45-IgM or P-selectin–IgM. Isolated bone marrow neutrophils (C-D) of the indicated genotype were incubated on control F(ab′)2 or anti-β2 integrin F(ab′)2. Lysates were analyzed by immunoblotting with the indicated antibodies. (E-F) Rolling velocities of neutrophils of the indicated genotype on P-selectin with or without coimmobilized ICAM-1 in the presence or absence of anti–ICAM-1 mAb. (G,I) Rolling velocities of neutrophils of the indicated genotype on P-selectin coimmobilized with ICAM-1 and low-dose CXCL1 (0.1 μg/mL) in the presence or absence of anti–ICAM-1 mAb. (H,J) Percentages of neutrophils of the indicated genotype rolling, arrested and round, or arrested and spread on coimmobilized P-selectin, ICAM-1, and low-dose CXCL1. The data in panels A through D are representative of 3 experiments. The data in panels E through J represent the mean ± SEM from 5 experiments, with 5 mice in each experimental group. *P < .05 for rolling velocity; #P < .05 for number of rolling cells.
Figure 3.
Figure 3.
P-selectin–triggered signaling through PSGL-1 does not require L-selectin. (A) Flow cytometric analysis of expression of L-selectin, PSGL-1, CD44, or β2 integrins on WT or Sell−/− neutrophils. (B) Rolling velocities of WT or Sell−/− neutrophils on P-selectin with or without coimmobilized ICAM-1 in the presence or absence of anti–ICAM-1 mAb. (C) Rolling velocities of WT or Sell−/− neutrophils on P-selectin coimmobilized with ICAM-1 and low-dose CXCL1 (0.1 μg/ml) in the presence or absence of anti–ICAM-1 mAb. (D) Percentages of WT or Sell−/− neutrophils rolling, arrested and round, or arrested and spread on coimmobilized P-selectin, ICAM-1, and low-dose CXCL1. (E-H) Bone marrow leukocytes from WT or Sell−/− mice were incubated on immobilized control CD45-IgM or P-selectin–IgM in the presence or absence of EDTA. Lysates were analyzed by immunoblotting with the indicated antibodies. (I) Isolated bone marrow neutrophils from WT mice were pretreated with DMSO (vehicle control), inactive control α-cyclodextrin (αCD), or methyl-β-cyclodextrin (MβCD). They were then incubated on immobilized F(ab′)2 fragments of anti–PSGL-1 mAb or anti–L-selectin mAb. Lysates were analyzed by immunoblotting with antibody against SFK or phospho-SFK. The data in panels B through D represent the mean ± SEM from 5 experiments, with 5 mice in each experimental group. The data in panels A and E through I are representative of 3 experiments. *P < .05.
Figure 4.
Figure 4.
Cooperative PSGL-1 and CXCR2 signaling in neutrophils promotes DVT. (A) Representative thrombi scanned by ultrasonography. Thrombus areas: top, 3.1 mm2; bottom, 11.6 mm2. Bar, 1 mm. (B-C) Kinetics of thrombus development (frequency) and thrombus size (area) in mice of the indicated genotype, measured by ultrasonography at the indicated times after ligation. (D) Thrombus weight in the indicated genotype 24 hours after ligation. Each symbol represents an individual thrombus. Horizontal black bars represent median values. (E-F) Kinetics of thrombus development (frequency) and thrombus size (area) in mice with the indicated treatment, measured by ultrasonography at the indicated times after ligation. (G) Thrombus weight with the indicated treatment 24 hours after ligation. Each symbol represents an individual thrombus. Horizontal black bars represent median values. The data in panels B and E were taken from 10 to 18 mice in each group. The data in panels C and F represent the mean ± SEM from 3 to 14 mice in each group. *P < .05.
Figure 5.
Figure 5.
Cooperative PSGL-1 and CXCR2 signaling in neutrophils enhances neutrophil recruitment and NET formation in deep vein thrombi. (A) Number of Ly6G+ neutrophils per thrombus 24 hours after ligation in the indicated genotype, as measured by flow cytometry. (B) Normalized thrombus weight per Ly6G+ neutrophil. (C) Normalized fibrin level per Ly6G+ neutrophil. The data in panels A through C represent the mean ± SEM from 5 to 10 mice in each group. (D) Western blot of thrombus lysates probed with antibodies to fibrin, Ly6G, and citrullinated histone. The Aα, Bβ, and γ chains of fibrin are marked. The data are representative of 3 experiments. (E) Normalized densitometric ratio of fibrin Aα chain to Ly6G. (F) Normalized densitometric ratio of citrullinated histone to Ly6G. The data in panels E and F represent the mean ± SD from 3 mice in each experimental group. (G) Representative fluorescent images of isolated WT bone marrow neutrophils incubated with phorbol myristate acetate (PMA), stained with anti-citrullinated histone IgG followed by Alexa 488–conjugated anti-rabbit IgG (left), with Sytox Orange to label DNA (middle), or merged image (right). The white arrow marks extracellular staining for both citrullinated histones and DNA, indicating NET release. Scale bar, 10 μm. (H-I) Percentage of NET-forming neutrophils treated with the indicated agonist, calculated by dividing the number of cells with both extracellular citrullinated histones and Sytox Orange–positive DNA by the total number of Sytox Orange–positive cells. The data in panel H are from WT mice. The data in panel I are from mice of the indicated genotype. The data in panels H and I represent the mean ± standard deviation (SD) from 3 mice in each experimental group. *P < .05.
Figure 6.
Figure 6.
PSGL-1 and CXCR2 signaling in monocytes does not enhance monocyte recruitment and tissue factor expression in deep vein thrombi. (A) Number of rolling M-CSFR (CD115)+ monocytes per minute per microscopic field in the IVC 3 hours after ligation (vertical axis). Circulating monocyte count for each genotype (horizontal axis). Inset, Representative image of adherent M-CSFR+ monocytes (red) in WT mice obtained with spinning-disk intravital microscopy. PE-conjugated anti–M-CSFR mAb was injected IV into WT mice 1 hour before surgery. Bar, 10 μm. (B) Quantification of endothelial surface area covered with firmly adherent monocytes. The data in the graphs of panels A and B represent the mean ± SEM from 5 mice in each group. (C) Number of M-CSFR+ monocytes per thrombus 24 hours after ligation, as measured by flow cytometry. (D) Normalized thrombus weight per M-CSFR+ monocyte. The data in panels C and D represent the mean ± SEM from 5 to 10 mice in each group. (E) Western blot of thrombus lysates probed with antibodies to fibrin, M-CSFR, and tissue factor. The Aα, Bβ, and γ chains of fibrin are marked. The data are representative of 3 experiments. (F) Normalized densitometric ratio of fibrin Aα chain to M-CSFR. (G) Normalized densitometric ratio of tissue factor to M-CSFR. The data in panels F and G represent the mean ± SD from 3 mice in each experimental group. *P < .05.
Figure 7.
Figure 7.
Cooperative PSGL-1 and CXCR signaling in neutrophils promotes DVT. In flow-restricted IVCs, neutrophils rolling on P-selectin signal through PSGL-1, in part through phosphorylation of tyrosine 145 on SLP-76. Rolling neutrophils signal through CXCR2 after engaging CXCL1 immobilized on proteoglycans. These signals cooperatively activate integrin αLβ2, which causes neutrophils to decelerate and arrest on ICAM-1. Cooperative signaling in adherent neutrophils triggers release of procoagulant NETs. See “Discussion” for details.

Comment in

References

    1. Cohen AT, Agnelli G, Anderson FA, et al. ; VTE Impact Assessment Group in Europe (VITAE). Venous thromboembolism (VTE) in Europe. The number of VTE events and associated morbidity and mortality. Thromb Haemost. 2007;98(4):756-764. - PubMed
    1. Heit JA. The epidemiology of venous thromboembolism in the community. Arterioscler Thromb Vasc Biol. 2008;28(3):370-372. - PMC - PubMed
    1. Reitsma PH, Versteeg HH, Middeldorp S. Mechanistic view of risk factors for venous thromboembolism. Arterioscler Thromb Vasc Biol. 2012;32(3):563-568. - PubMed
    1. Mackman N. New insights into the mechanisms of venous thrombosis. J Clin Invest. 2012;122(7):2331-2336. - PMC - PubMed
    1. Wakefield TW, Myers DD, Henke PK. Role of selectins and fibrinolysis in VTE. Thromb Res. 2009;123(suppl 4):S35-S40. - PubMed

Publication types

Substances