Trends in opioid use in commercially insured and Medicare Advantage populations in 2007-16: retrospective cohort study
- PMID: 30068513
- PMCID: PMC6066997
- DOI: 10.1136/bmj.k2833
Trends in opioid use in commercially insured and Medicare Advantage populations in 2007-16: retrospective cohort study
Erratum in
-
Trends in opioid use in commercially insured and Medicare Advantage populations in 2007-16: retrospective cohort study.BMJ. 2018 Nov 14;363:k4825. doi: 10.1136/bmj.k4825. BMJ. 2018. PMID: 30429166 No abstract available.
Abstract
Objective: To describe trends in the rate and daily dose of opioids used among commercial and Medicare Advantage beneficiaries from 2007 to 2016.
Design: Retrospective cohort study of administrative claims data.
Setting: National database of medical and pharmacy claims for commercially insured and Medicare Advantage beneficiaries in the United States.
Participants: 48 million individuals with any period of insurance coverage between 1 January 2007 and 31 December 2016, including commercial beneficiaries, Medicare Advantage beneficiaries aged 65 years and over, and Medicare Advantage beneficiaries under age 65 years (eligible owing to permanent disability).
Main endpoints: Proportion of beneficiaries with any opioid prescription per quarter, average daily dose in milligram morphine equivalents (MME), and proportion of opioid use episodes that represented long term use.
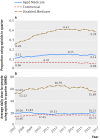
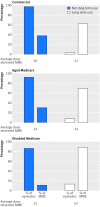
Results: Across all years of the study, annual opioid use prevalence was 14% for commercial beneficiaries, 26% for aged Medicare beneficiaries, and 52% for disabled Medicare beneficiaries. In the commercial beneficiary group, quarterly prevalence of opioid use changed little, starting and ending the study period at 6%; the average daily dose of 17 MME remained unchanged since 2011. For aged Medicare beneficiaries, quarterly use prevalence was also relatively stable, ranging from 11% at the beginning of the study period to 14% at the end. Disabled Medicare beneficiaries had the highest rates of opioid use, the highest rate of long term use, and the largest average daily doses. In this group, both quarterly use rates (39%) and average daily dose (56 MME) were higher at the end of 2016 than the low points observed in 2007 for each endpoint (26% prevalence and 53 MME).
Conclusions: Opioid use rates were high during the study period of 2007-16, with the highest rates in disabled Medicare beneficiaries versus aged Medicare beneficiaries and commercial beneficiaries. Opioid use and average daily dose have not substantially declined from their peaks, despite increased attention to opioid abuse and awareness of their risks.
Published by the BMJ Publishing Group Limited. For permission to use (where not already granted under a licence) please go to http://group.bmj.com/group/rights-licensing/permissions.
Conflict of interest statement
Competing interests: All authors have completed the ICMJE uniform disclosure form at www.icmje.org/coi_disclosure.pdf and declare: no support from any organization for the submitted work; no financial relationships with any organizations that might have an interest in the submitted work in the previous three years; no other relationships or activities that could appear to have influenced the submitted work.
Figures


References
-
- CDC. Drug overdose deaths in the United States continue to increase in 2015 2016 [updated Dec 16, 2016. http://www.cdc.gov/drugoverdose/epidemic/index.html.
-
- Davis JH. In declaration, no new funds for drug crisis. The New York Times. 10/27/2017.
Publication types
MeSH terms
Substances
Grants and funding
LinkOut - more resources
Full Text Sources
Other Literature Sources
Miscellaneous
