. 2018 Aug;8(8):180076.
doi: 10.1098/rsob.180076.

Implications of dimeric activation of PDE6 for rod phototransduction

Affiliations

Implications of dimeric activation of PDE6 for rod phototransduction

Trevor D Lamb et al. Open Biol. 2018 Aug.

Abstract

We examine the implications of a recent report providing evidence that two transducins must bind to the rod phosphodiesterase to elicit significant hydrolytic activity. To predict the rod photoreceptor's electrical response, we use numerical simulation of the two-dimensional diffusional contact of interacting molecules at the surface of the disc membrane, and then we use the simulated PDE activity as the driving function for the downstream reaction cascade. The results account for a number of aspects of rod phototransduction that have previously been puzzling. For example, they explain the existence of a greater initial delay in rods than in cones. Furthermore, our analysis suggests that the 'continuous' noise recorded in rods in darkness is likely to arise from spontaneous activation of individual molecules of PDE at a rate of a few tens per second per rod, probably as a consequence of spontaneous activation of transducins at a rate of thousands per second per rod. Hence, the dimeric activation of PDE in rods provides immunity against spontaneous transducin activation, thereby reducing the continuous noise. Our analysis also provides a coherent quantitative explanation of the amplification underlying the single photon response. Overall, numerical analysis of the dimeric activation of PDE places rod phototransduction in a new light.

Keywords: dimeric activation; phosphodiesterase PDE6; phototransduction; response kinetics; rod photoreceptors; transducin.


Conflict of interest statement

We declare we have no competing interests.

Figures

Figure 1.
Figure 1.
Models of dimeric activation of PDE6 and lateral diffusion of molecules. (a) Schematic of PDE reactions. Rightward arrows show activation steps, and leftward arrows show shut-off steps. An activated transducin (G*) can bind either to a PDE or to a PDE*, and the bound form then transitions to PDE* or PDE**, respectively; in this paper, the transition is assumed to occur instantaneously (rate = ∞). Shut-off reactions occur stochastically through GTPase activity (with release of phosphate, Pi) followed by dissociation of the GDP-bound transducin (G). The rate constant of stochastic GTPase activity is denoted kE* or kE** in the two cases; the subsequent dissociation is assumed to occur instantaneously (rate = ∞). (b) Lateral diffusion of molecules at the disc surface. A single activated rhodopsin molecule (R*) is shown diffusing laterally in the disc membrane (bold line) from its initial position (larger filled circle). At each of the locations indicated by the smaller filled circles, a transducin molecule is activated (to G*) and diffuses laterally at the membrane surface. For simplicity, we have not attempted to illustrate contact with PDE molecules.
Figure 2.
Figure 2.
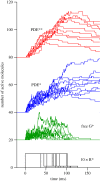
Sample raw traces for the numbers of activated molecules of different species, predicted in simulations with the standard parameters in table 1. These are the first 10 stochastic simulations from the run used to calculate the traces in the next two figures; the groups have been displaced vertically for clarity. Black traces: R* (scaled vertically 10×); the late lower level shows the low-activity state invoked by Lamb & Kraft [9]. Green traces: free G* (i.e. the number of G*s not bound to PDE). Blue traces, PDE*. Red traces, PDE**. In each case, the traces plot the numbers of molecules active, as distinct from the total numbers produced.
Figure 3.
Figure 3.
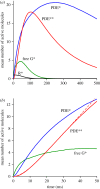
Simulated mean time-course of different species of activated molecule, for standard parameters in table 1. (a) Mean response over 500 ms. (b) Expanded time-base for the first 50 ms. Dashed red trace plots equation (2.1), fitted over the first 35 ms, yielding νRE = 309 PDE** s−1 and τRE = 6.9 ms.
Figure 4.
Figure 4.
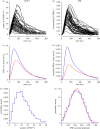
Single-photon PDE** kinetics and electrical response. Results for simulation of 4000 trials with the standard parameters listed in table 1. Column (a,c,e) shows PDE**; column (b,d,f) shows electrical response (normalized, as a fraction of the circulating dark current). Row (a,b) shows a sample of 50 consecutive simulations. Row (c,d) shows the ensemble means (blue) and s.d. (red). Row (e,f) shows the probability density histograms (blue); the red curve in panel (f) is a Gaussian with mean of 0.0453 and an s.d. of 0.0200.
Figure 5.
Figure 5.
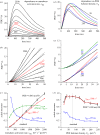
Effect of altered rate of G* activation (a–c) and altered PDE density (d–f) on simulated PDE** responses. (a,d) Simulated responses on a time-base of 500 ms. (b,e) The same responses on an expanded time-base, with equation (2.1) fitted over the interval 0–35 ms (dashed traces). (c,f) Measurements extracted from the panels above: PDE** at a fixed time near the peak (black); the fitted slope of E** activation (red); initial delay (blue); and in (c), efficacy ηGE** of E** activation (see text). In order to show multiple parameters in a single panel, the measurements have been scaled vertically as indicated. The error bars for the measured PDE** levels (black) show the 95% confidence intervals, calculated as ±2 s.e.m. The dotted vertical lines indicate the standard parameter values: a G* activation rate of 1000 s−1 in (c), and a PDE density of 80 holomers µm−2 in (f); all other parameters were held constant at their standard values listed in table 1. For (a–c), the G* activation rates were: νRG = 100, 200, 400, 500, 800, 1000, 1250, 1600, 2000, 2500 G* s−1. For (d–f), the PDE densities were: CE = 20, 30, 40, 60, 80, 100, 125, 160, 200, 250 holomers µm−2 (though only a subset of time-course traces are plotted, as indicated in (e)); the three traces for the lowest PDE densities in (e) have been offset vertically to avoid overlap. The traces in the upper four panels are the means for 500 simulations, except for the red traces using the standard set of parameters which are taken from figure 3 with 4000 simulations.
Figure 6.
Figure 6.
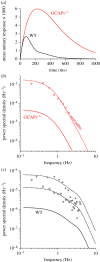
Unitary PDE** event electrical responses and power spectral density. (a) Mean electrical responses to activation of a single PDE**, averaged from 1000 simulations for individual events with exponentially distributed lifetimes. Trace WT (black) is for wild-type mammalian rods, using the standard parameters in table 1; trace GCAPs−/− (red) is for GCAPs knockout, modelled by holding the guanylyl cyclase rate constant at the resting level for WT rods. (b) One-sided power spectral density, for GCAPs−/− rods. Solid red trace was predicted by averaging the spectra of the individual simulated GCAPs−/− responses used to construct panel (a), and corresponds to a mean rate of stochastic events of 1 s−1. Symbols plot GCAPs−/− rod data from fig. 4b of Burns et al. [29], normalized for their circulating current of 14.0 pA. Dotted red trace is scaled vertically from solid red trace using an event rate of 40 s−1. (c) One-sided power spectral density, for WT rods. Solid black trace is predicted from the simulated WT responses used in panel (a). Open symbols plot WT data from fig. 4b of Burns et al. [29], normalized for their circulating current of 12.9 pA; adjacent dotted trace is scaled for an event rate of 11 s−1. Symbols ‘+’ plot data for WT monkey rods from fig. 14b of Baylor et al. [30], normalized for their circulating current of 13 pA; adjacent dotted trace is scaled for an event rate of 50 s−1.
Figure 7.
Figure 7.
Bright flash responses. (a) Predicted fractional PDE**(t) in response to integer numbers, φ, of photoisomerizations per disc surface. The red and black traces plot ensemble mean responses for simulations: the red traces are for φ = 1, 10, 20 and 30, and black traces are for φ = 2 … 9 isomerizations per surface. The blue traces correspond to φ = 11 … 19 and φ = 21 … 29, and have been derived by shifting the saturated red traces by multiples of the mean observed shift of 94.1 ms and weighting them appropriately. (b) Predicted fractional electrical responses R(t) to flashes delivering from Φ = 1 to 16 000 photoisomerizations per outer segment, in steps of 0.3 log10 units (i.e. approximately doubling the intensity between each trace). The minor wobbles at late times in the traces at around 4000 isomerizations presumably resulted from stochastic fluctuations in the relatively small number of PDE** molecules at these times, for simulations with around 3 isomerizations per disc surface. The dotted horizontal line indicates 90% suppression of the dark current. (c) Time spent in saturation plotted as a function of flash intensity, Φ photoisomerizations per rod, plotted logarithmically. The continuous red trace is taken from predicted traces such as those in panel (b), but calculated at intensity intervals of 0.05 log10 units. The dotted red line, which approximates the predicted saturation time for flashes up to 3000 isomerizations per rod, has a slope corresponding to a dominant time constant of 215 ms. The symbols are experimental measurements for WT mouse rods taken from fig. 4 of [32], without any shifts. The dotted blue line is positioned to describe the points at the highest intensities, and its slope corresponds to a time constant of 650 ms.

References

    1. Lamb TD, Pugh EN. 1992. A quantitative account of the activation steps involved in phototransduction in amphibian photoreceptors. J. Physiol. 449, 719–758. (10.1113/jphysiol.1992.sp019111) - DOI - PMC - PubMed
    1. Bennett N, Clerc A. 1989. Activation of cGMP phosphodiesterase in retinal rods: mechanism of interaction with the GTP-binding protein (transducin). Biochemistry 28, 7418–7424. (10.1021/bi00444a040) - DOI - PubMed
    1. Qureshi BM, et al. 2015. Asymmetric properties of rod cGMP Phosphodiesterase 6 (PDE6): structural and functional analysis. BMC Pharmacol. Toxicol. 16, 18225 (10.1186/2050-6511-16-S1-A76) - DOI
    1. Qureshi BM, et al. 2018. It takes two transducins to activate the cGMP-phosphodiesterase 6 in retinal rods. Open Biol. 8, 180075. - PMC - PubMed
    1. Lisman J, Erickson MA, Richard EA, Cote RH, Bacigalupo J, Johnson E, Kirkwood A. 1992. Mechanisms of amplification, deactivation, and noise reduction in invertebrate photoreceptors. In Sensory transduction: Society of General Physiologists 45th annual symposium, pp. 175–199. Woods Hole, MA: Society of General Physiologists. - PubMed

Publication types

Substances

LinkOut - more resources