. 2018 Sep 1;201(5):1570-1585.
doi: 10.4049/jimmunol.1800591. Epub 2018 Aug 1.

Mechanistic Insights into CpG DNA and IL-15 Synergy in Promoting B Cell Chronic Lymphocytic Leukemia Clonal Expansion

Affiliations

Mechanistic Insights into CpG DNA and IL-15 Synergy in Promoting B Cell Chronic Lymphocytic Leukemia Clonal Expansion

Rashmi Gupta et al. J Immunol. .

Abstract

Malignant cell growth within patients with B cell chronic lymphocytic leukemia (B-CLL) is largely restricted to lymphoid tissues, particularly lymph nodes. The recent in vitro finding that TLR-9 ligand (oligodeoxynucleotide [ODN]) and IL-15 exhibit strong synergy in promoting B-CLL growth may be particularly relevant to growth in these sites. This study shows IL-15-producing cells are prevalent within B-CLL-infiltrated lymph nodes and, using purified B-CLL cells from blood, investigates the mechanism for ODN and IL-15 synergy in driving B-CLL growth. ODN boosts baseline levels of phospho-RelA(S529) in B-CLL and promotes NF-κB-driven increases in IL15RA and IL2RB mRNA, followed by elevated IL-15Rα and IL-2/IL-15Rβ (CD122) protein. IL-15→CD122 signaling during a critical interval, 20 to 36-48 h following initial ODN exposure, is required for optimal induction of the cycling process. Furthermore, experiments with neutralizing anti-IL-15 and anti-CD122 mAbs indicate that clonal expansion requires continued IL-15/CD122 signaling during cycling. The latter is consistent with evidence of heightened IL2RB mRNA in the fraction of recently proliferated B-CLL cells within patient peripheral blood. Compromised ODN+IL-15 growth with limited cell density is consistent with a role for upregulated IL-15Rα in facilitating homotypic trans IL-15 signaling, although there may be other explanations. Together, the findings show that ODN and IL-15 elicit temporally distinct signals that function in a coordinated manner to drive B-CLL clonal expansion.


Conflict of interest statement

DISCLOSURE OF CONFLICTS OF INTEREST

The authors have no financial conflicts of interest.

Figures

FIGURE 1
FIGURE 1. IL-15-producing cells are present within B-CLL-infiltrated LN
Five μm sections were taken from a fixed, paraffin-embedded LN determined to be B-CLL infiltrated by clinical pathology laboratory analysis and used for immunohistochemical assessment of IL-15-positive cells. Shown are photos (600× magnification) of a section stained with (left) goat anti-human IL-15 Ab or (right) normal goat IgG. The presence of IL-15-positive cells in B-CLL-infiltrated LN is consistent with findings of IL-15-positive cells in spleen (8).
FIGURE 2
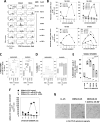
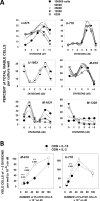
FIGURE 2. IL-15 signaling does not become critical until ≥ 20 hours after B-CLL activation by ODN
CFSE-labeled cultures were stimulated with ODN at t=0 and provided with rIL-15 (15 ng/ml) either concomitantly or after varying intervals. A set of parallel ODN-stimulated cultures did not receive IL-15. B-CLL populations used for these experiments were selected on the basis of their relatively strong growth response to ODN+IL-15 in prior studies (8). A. CFSE-fluorescence histograms of cultured B-CLL (M-1031) gated for viable (V450-low) or dead (V450-high) cells (dot-pots at left) after 6 days of culture. Markers representative of division-gating are shown for each histogram. (CFSE fluorescence declines by 2-fold with each division). B. Calculated values for the total yield of viable B-CLL in each division subset within d6 cultures of (top) M-1031 cells and (bottom) M-693 cells are shown (mean ± sem of triplicate cultures). Total yield was determined with standardizing beads, as described in Materials & Methods. Left: Top and bottom plots show cell yield in cultures exposed to IL-15 alone, ODN alone, or both ODN+IL15 at t=0. Right: Top and bottom plots compare cell yield in ODN-stimulated cultures that received IL-15 at varying intervals (t=0 to 84h after ODN stimulation). C. Box-plots comparing the relative recovery of gated (left) undivided and (right) divided B-CLL cells, as a percent of the total cells collected (viable + dead). Experiments involved three distinct B-CLL populations (M-1031, M-693, and U-321) that were cultured for 6-7 days with ODN alone or ODN with IL-15 added at varying intervals. Statistical evaluation involved one-way ANOVA using the Holm-Sidak method for multiple comparisons versus a control group. * indicates significant P values (p < 0.05) upon comparing cell recovery in ODN-only cultures with cell recovery in IL-15-supplemented cultures. # indicates significant P values upon comparing recovery in cultures with ODN+IL15 at t=0 with recovery in cultures receiving IL-15 at later intervals. Cultures supplemented with IL-15 at t=20h were not significantly different from those receiving IL-15 at t=0h in terms of recovery of undivided or divided cells. D. Box plots comparing the relative viability within gated (left) undivided and (right) divided B-CLL cells in ODN-stimulated M-1031, M-693, and U-321 cultures without IL-15 or with IL-15 received at varying intervals. Paired, one-sided T-test indicated statistical differences in viability between groups receiving IL-15 at t=0h and groups with IL-15 delayed to 48-70h (P ≤0.03). E. Box plots comparing recovery of total viable progeny within the above cultures of M-693 (●), U-321 (○), and M-1031 (▼), expressed as % of total viable+dead cells collected. Statistical evaluations were performed as in C, above. F. Graph showing absolute yield of viable cells within each division subset in cultures of CFSE-labeled M-1031 cells stimulated with ODN+IL-15 (5 ng/ml) at t=0 with/without anti-IL-15 mAb added at t=0 or t=20h (mean ± sem of triplicate cultures). Similar results were obtained in a replicate experiment. G. Anti-IL-15 mAb (clone ct2nu; 3 μg/ml final) blocks U-CLL770 blastogenesis upon t=0 addition to cultures stimulated with ODN+IL-15. Photographs were taken at 400× magnification using phase microscopy.
FIGURE 3
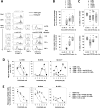
FIGURE 3. B-CLL exposure to ODN upregulates receptors for IL-15: IL-15Rα (CD215) and IL-2/IL- 15Rβ (CD122)
A. Fluorescence histograms of U-996 cells stained with anti-IL15Rα Ab (grey fill) or IgG control (dashed line) after varying culture intervals (3- 20h) with medium alone or with ODN. Histograms represent cells gated for viability (dot-plots to left). B. Fluorescence histograms of viability-gated U-996 cells stained with anti-CD122 Ab (grey fill) or IgG control (dashed line) following 20h culture with medium alone (top) or ODN (bottom). C. Level of IL-15Rα staining in 10 distinct B-CLL clones following 20h culture in medium (light grey bars) or ODN (black bars). Values represent the mean ± sem of staining replicates. IL-15Rα expression is quantified on the basis of %-positive cells, with a threshold set at 5% positive within the IgG-control-stained population (dotted line). IL-15Rα staining above background was noted in 9/10 B-CLL clones cultured in medium alone; in 8/10 of these B-CLL, levels of IL-15Rα rose upon ODN activation. (Note: the 2 B-CLL which did not show an ODN-induced increase in IL-15Rα staining (U-1991 and M-2018) at 20h did show a transient increase at earlier intervals (see E, below). D. Level of CD122 staining in 5 distinct B-CLL populations following 20h or 44h culture with/without ODN. CD122 expression was quantified similarly to IL-15Rα in C, above. E. Kinetics of IL-15Rα expression (as % positive cells) in 9 distinct B-CLL evaluated at varying times after culture with medium alone (white circles) or with ODN (black circles); mean ± sem of staining replicates is shown. F. Summarized data from IL-15Rα staining analyses with 10 B-CLL (four left box plots) or with U-CLL and M-CLL subsets segregated (four right box plots). Four left box plots with total B-CLL reveal the % of cells above the threshold for positivity within medium- or ODN-cultures stained with IgG control or anti-IL-15Rα Ab. Statistical significance was determined by 2-sided, paired T-tests. G. Box plots comparing % positive cells in CLL clones stained with anti-CD122 Ab or IgG control after 20-44h culture with medium only or ODN (n=5). ODN-stimulated B-CLL showed a significant increase in % CD122-positive cells (P= 0.04).
FIGURE 4
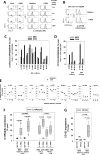
FIGURE 4. ODN-stimulated B-CLL show rapid increases in IL15RA and IL2RB (CD122) mRNA that are blocked by NF-kB inhibitor
A. B-CLL clones (U-791, U-1239, U-1953) were cultured for varying intervals (3h, 9h, and 20h) with medium alone or with ODN, prior to RNA isolation. Specific mRNA levels were determined by qRT-PCR performed as described in Materials & Methods, using GAPDH housekeeping control mRNA to calculate ∆Ct values. ∆Ct values within medium versus ODN treated B-CLL cultures for IL15RA (left plot) and IL2RB (CD122) (right plot) are shown. Statistical evaluations for differences were made with paired T-tests. * indicates that ∆Ct values for specific mRNA in medium-treated cells is significantly different (P≤ 0.03) by 1-sided T-tests; ** indicates that ∆Ct values in medium versus ODN treated cells is significantly different (P≤ 0.04) by 2-sided T-tests. B. ∆Ct values were used to calculate ∆∆Ct values, using medium-treated cells as control baseline and fold-change above medium only obtained by 2^(−∆∆Ct) (31). Plotted are the fold-change values for IL15RA mRNA (left) and IL2RB (right) at increasing intervals after ODN stimulation. Represented are data from the 3 individual B-CLL clones. C. Intracellular immunofluorescent staining with APC-labeled anti-p65 NFkB(Ser529) mAb (solid line) and APC-labeled IgG control (filled grey) was used to confirm that p65/RelA is activated in ODN-2006-exposed B-CLL. A gate was placed in the fluorescence histogram to indicate the threshold for positivity (set at 1% positive cells with IgG staining control). P value indicates statistical significance by 1-sided, paired T-test. E and F. NF-kB inhibitor reduces IL15RA and IL2RB (CD122) mRNA. The effect of 30 min pre-exposure to NF-kB inhibitor, BAY-11-9802 (1.25 and/or 2.5 μM) on ODN-triggered increases in specific mRNA was evaluated in two B-CLL clones: (E) M-1031 and (F) U-1239. M-1031 CLL cells were cultured for 3h with medium alone or ODN prior to mRNA isolation, with sets of parallel cultures pre-exposed for 30 min to NF-kB inhibitor or DMSO vehicle control. Specific RNA levels were determined as above and are represented as fold-change above that in medium only cultures with vehicle (shown by dotted line). U-1239 CLL cells were treated as above, but two culture periods were employed (3h and 9h) to permit optimal detection of IL2RB mRNA. * indicates that specific mRNA levels in cultures with NF-kB inhibitor are significantly different from those in parallel cultures with vehicle: P< 0.05 upon data analysis by 2-sided, unpaired T-tests.
FIGURE 5
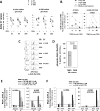
FIGURE 5. Neutralizing mAbs specific for IL-15 or CD122 block B-CLL division both when added early and late after ODN+IL-15 stimulation
B-CLL populations used for these experiments were selected on the basis of their relatively strong growth response to ODN+IL-15. A. CFSE fluorescence histograms from 132h-harvested M-CLL2018 cultures, with dot-blots revealing gating for viable/dead B-CLL cells to the left. Cultures exposed to the stimuli shown, with anti-IL-15 or anti-CD122 neutralizing mAb pulsed into sets of ODN+IL-15-stimulated cultures, at varying times after activation (anti-IL-15: clone ct2nu; 3 μg/ml final and anti-CD122: clone TU27; 25 μg/ml final) Histograms of viable-gated cells are overlaid with histograms of dead-gated cells from the same culture, revealing the proportion of viable and dead cells within each division subset. B. Box plots representing results from similar experiments with multiple B-CLL clones, shown in the legend. The yield of viable progeny (cells with CFSE evidence of division) is expressed as a percent of that obtained in ODN+IL-15-stimulated cultures without Ab. Isolated symbols represent yields in the individual clones. TOP: Yields of viable progeny from groups receiving anti-IL-15 at 0, 72, and 96h after ODN+IL-15 stimulation (n=6 B-CLL for all, excepting n=4 for the t=96 group) was found in each case to be significantly different from yield in ODN+IL-15-stimulated cultures without mAb (as assessed by one-way ANOVA, followed by use of the Holm-Sidak method for making multiple comparisons versus a control group; P < 0.001 for each comparison; indicated by *). BOTTOM: Yields from B-CLL groups receiving anti-CD122 at 0, 72, and 96h after ODN+IL15 stimulation and the ODN+IL-15 group with no mAb were initially evaluated by the non-parametric Kruskal-Wallis one way analysis of variance on ranks, showing a statistically significant difference exists between all the groups (P=0.001). When the Dunn’s Method was used to subsequently make multiple comparisons against the control group with no Ab, a statistically significant difference was noted for the group receiving anti-CD122 mAb at t=0h (P<0.001 = *) and a P value of borderline significance (P=0.06) was noted for the group with anti-CD122 mAb at t=72h (n=3 B-CLL for the t=96h pulse, while n=5 for other groups). C. Box plots representing the viability of divided cells within the ODN+IL-15-stimulated B-CLL populations evaluated in (B) above. Values for divided cell viability within the control group without mAb are shown (left-most bar). TOP: While divided cells within the B-CLL groups receiving IL-15 neutralizing mAb generally showed lesser viability that the control group, this was not determined to be statistically significant by one-way ANOVA. However, if the viability data from the various B-CLL experiments were normalized and expressed as a % of the viability within the control group without mAb, then significance (P=0.015, indicated as (*), or borderline significance (P=0.06) was noted for the groups treated with anti-IL-15 at t=0 and t=72h, respectively. BOTTOM: When viability data on divided cells within the B-CLL groups receiving anti-CD122 mAb were compared to that in ODN+IL-15-stimulated cultures without Ab, a statistically significant decline in viability in the t=0h mAb-treated group (P=0.03) was noted by one-way ANOVA, followed by the Holm-Sidak test for multiple comparisons. Evidence for a statistically-significant decline in viability in the t=72h mAb-treated group was only observed upon normalizing the viability values (as above) and application of the Krushal-Wallis one way analysis of variance on ranks, followed by the Dunn’s method for making multiple comparisons. In the latter case P=0.02, which is indicated in the graph as (*). D & E. The yield of viable progeny within each division subset is shown for experiments with 3 B-CLL clones (U-1993, M-2018, and M-1031). D) Shown is the total yield of viable divided cells at culture termination, as determined with standardization beads, in B-CLL populations stimulated with ODN alone or ODN+IL-15 ± anti-IL-15 mAb at t=0 or t=96h after stimulation. Data are expressed as the mean ± sem of triplicate cultures. The asterisk linked to M-1031 serves to indicate that in this experiment, the B-CLL clone was stimulated with a suboptimal dose of IL-15 (5 ng/ml), rather than the routine 15 ng/ml used in other experiments. E) To better appreciate the impact of delayed blockade of the IL-15-signaling pathway on B-CLL clonal expansion, values for absolute yield of viable progeny in D) are expressed as a percent of that in ODN+IL-15-stimulated cultures without mAb.
FIGURE 6
FIGURE 6. Recently divided B-CLL cells in patient PB show elevated levels of IL2RB mRNA
Levels of IL2RB mRNA were determined by gene expression array analysis (Materials & Methods) of RNA isolated from various B-CLL populations. (A and B) Purified B cells from the PB of patients with M-CLL or U-CLL were sorted by FACS on the basis of CXCR4DimCD5Bright (proliferative fraction, PF) or CXCR4DimCD5Bright (resting fraction, RF) expression, as described (32). RNA from each of the above, in replicates, was assessed for average IL2RB signal (B), with a ratio of the IL2RB signal in PF versus RF for total CLL (left cluster), U-CLL (middle cluster) and M-CLL (right cluster) shown in (A).
FIGURE 7
FIGURE 7. Extended B-CLL cycling following ODN+IL-15 stimulation is best observed under conditions of high B-CLL density
A. CFSE-labeled B-CLL clones (n=6) were stimulated at varying cell densities, ranging from 6250 to 100,000 cells per 200 μl flat-bottomed well. Recovery of viable blasts per each division is plotted as a percent of total viable cells recovered at culture harvest (day 5-7); shown is the mean of triplicate cultures per each condition. B. CFSE-labeled cells from U-770 cells (right) and a second experiment with M-618 cells (left) were seeded at varying densities into wells stimulated with either ODN + IL-15 or ODN + IL-2 (cytokines present at 15 ng/ml). Statistical significance was determined with a 2-sided, unpaired T-test. The diminished yield of viable U-770 progeny at high plating density (100,000 cells/well) was associated with increased acidity (overgrowth) and diminished viability of cultures (seen with both IL-15 and IL-2).

Similar articles

Cited by

References

    1. Nabhan C, Raca G, Wang YL. Predicting Prognosis in Chronic Lymphocytic Leukemia in the Contemporary Era. JAMA Oncol. 2015;1:965–974. - PubMed
    1. Herishanu Y, Katz BZ, Lipsky A, Wiestner A. Biology of chronic lymphocytic leukemia in different microenvironments: clinical and therapeutic implications. Hematol Oncol Clin North Am. 2013;27:173–206. - PMC - PubMed
    1. Zhang W, Trachootham D, Liu J, Chen G, Pelicano H, Garcia-Prieto C, Lu W, Burger JA, Croce CM, Plunkett W, Keating MJ, Huang P. Stromal control of cystine metabolism promotes cancer cell survival in chronic lymphocytic leukaemia. Nat Cell Biol. 2012;14:276–286. - PMC - PubMed
    1. Malavasi F, Deaglio S, Damle R, Cutrona G, Ferrarini M, Chiorazzi N. CD38 and chronic lymphocytic leukemia: a decade later. Blood. 2011;118:3470–3478. - PMC - PubMed
    1. Duhren-von Minden M, Ubelhart R, Schneider D, Wossning T, Bach MP, Buchner M, Hofmann D, Surova E, Follo M, Kohler F, Wardemann H, Zirlik K, Veelken H, Jumaa H. Chronic lymphocytic leukaemia is driven by antigen-independent cell-autonomous signalling. Nature. 2012;489:309–312. - PubMed

Publication types

MeSH terms

LinkOut - more resources