. 2018 Sep 15;201(6):1681-1691.
doi: 10.4049/jimmunol.1800704. Epub 2018 Aug 1.

ERK Signaling Controls Innate-like CD8+ T Cell Differentiation via the ELK4 (SAP-1) and ELK1 Transcription Factors

Affiliations

ERK Signaling Controls Innate-like CD8+ T Cell Differentiation via the ELK4 (SAP-1) and ELK1 Transcription Factors

Diane Maurice et al. J Immunol. .

Abstract

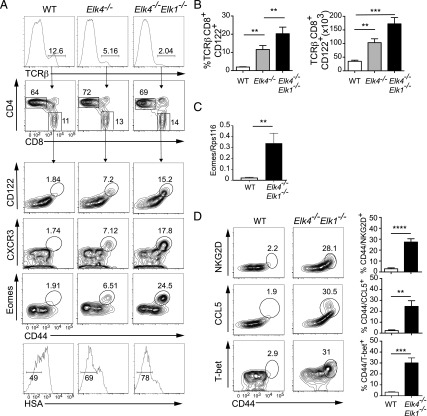
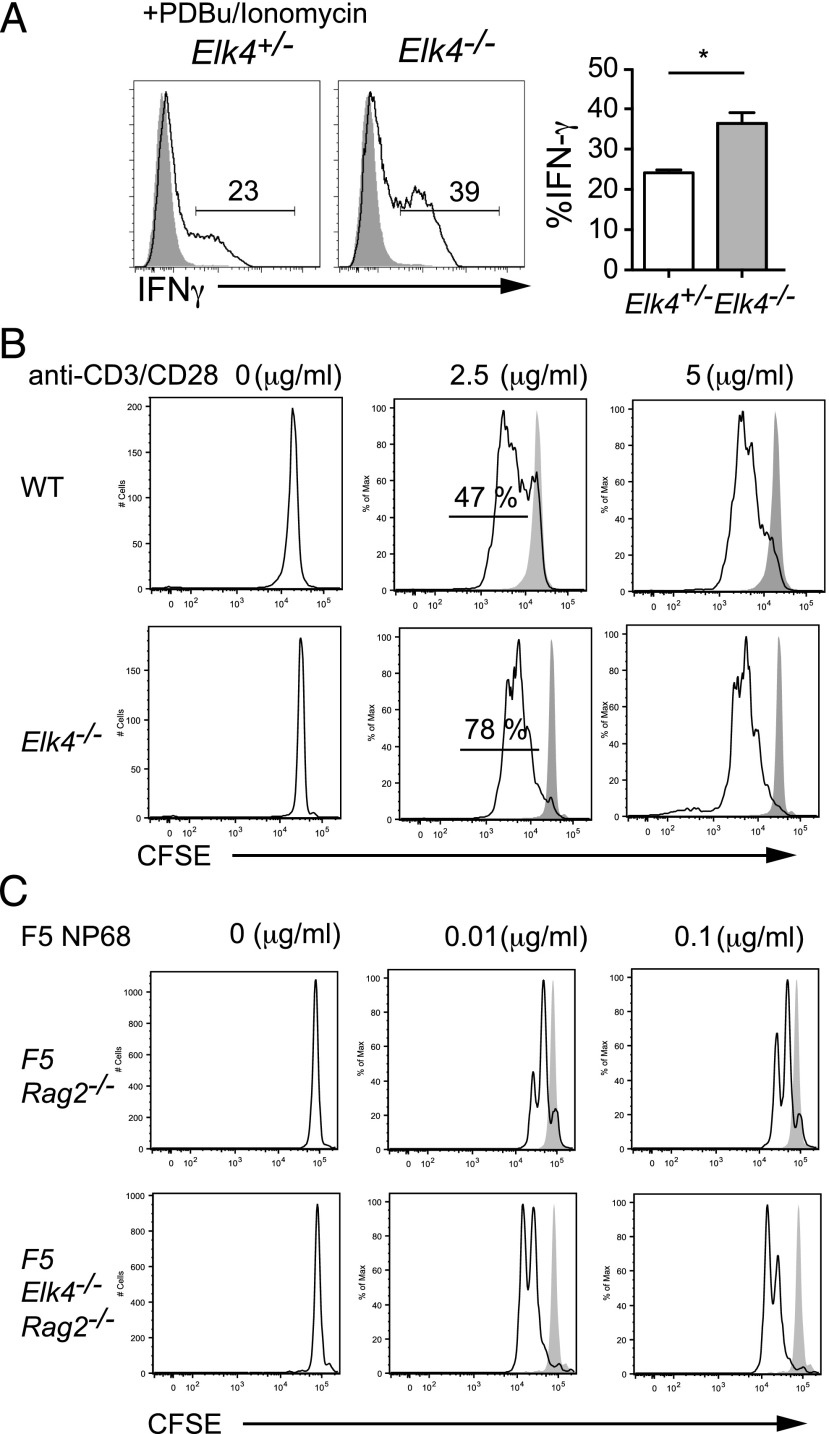
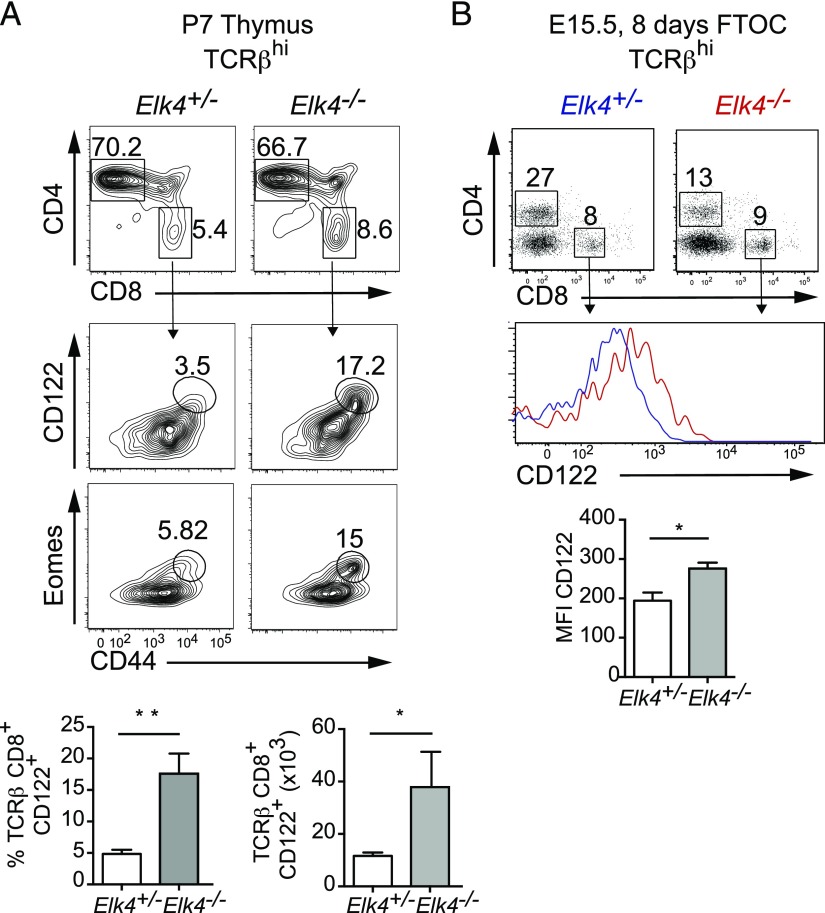
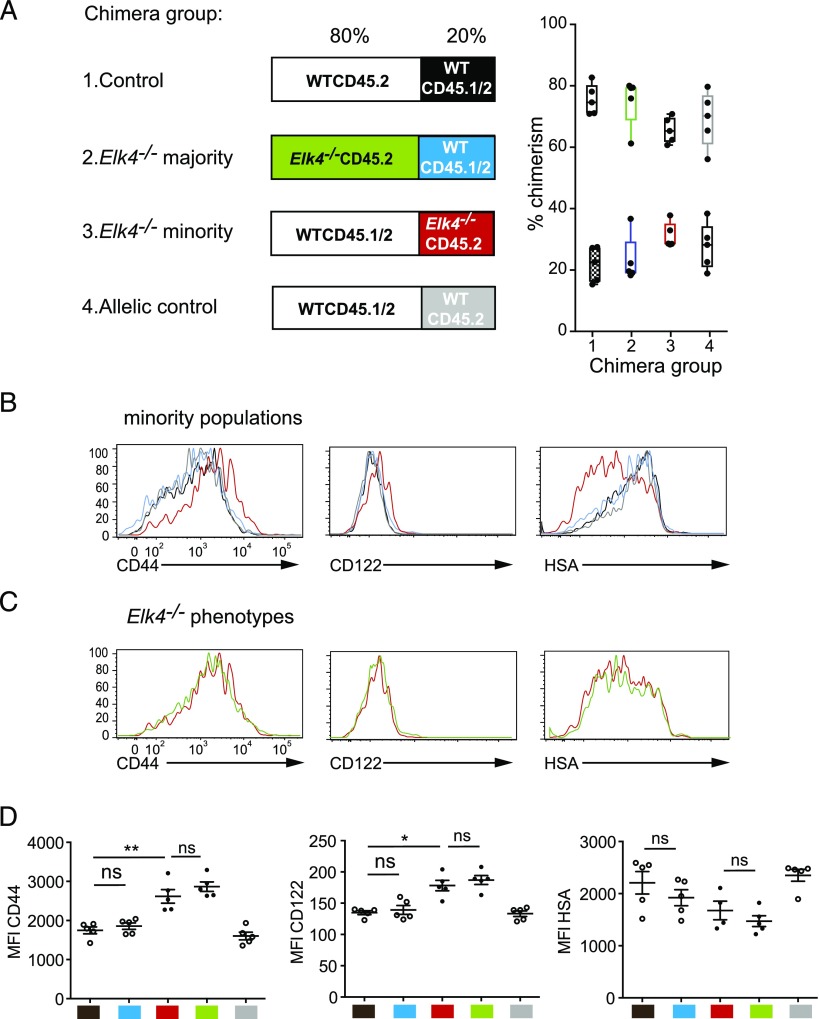
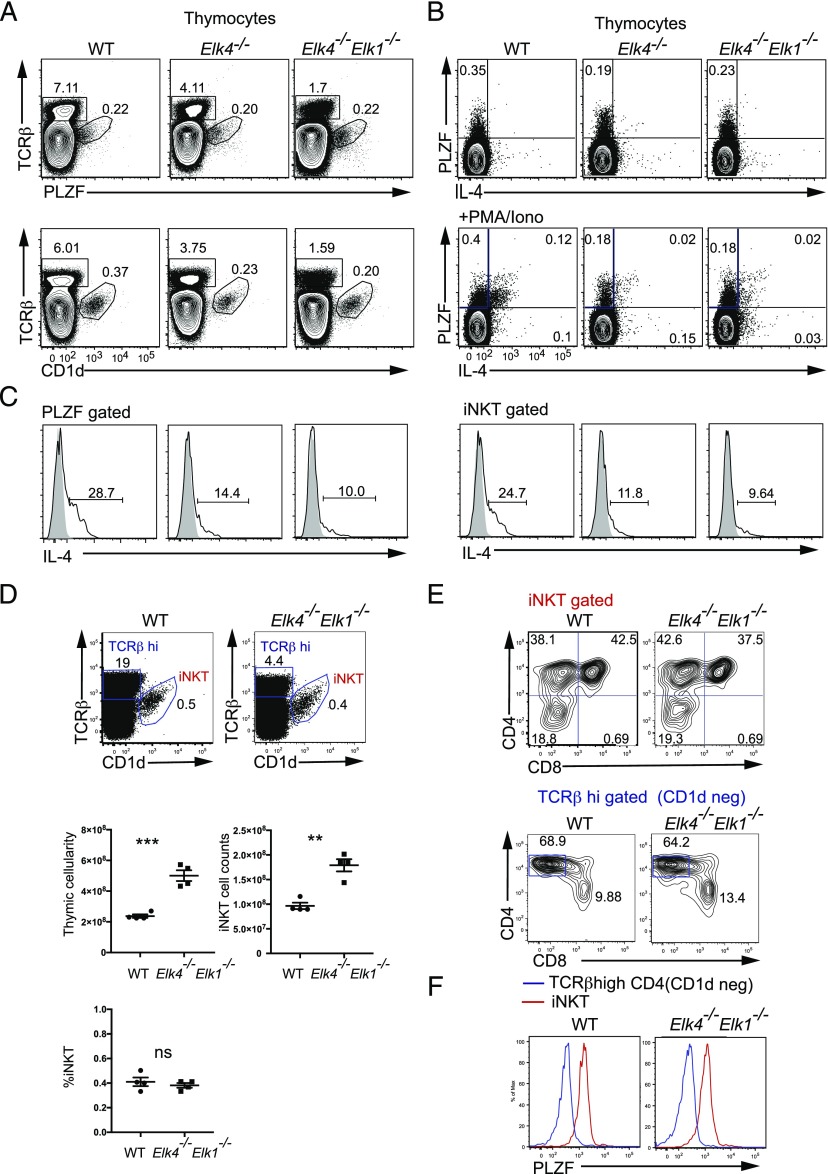
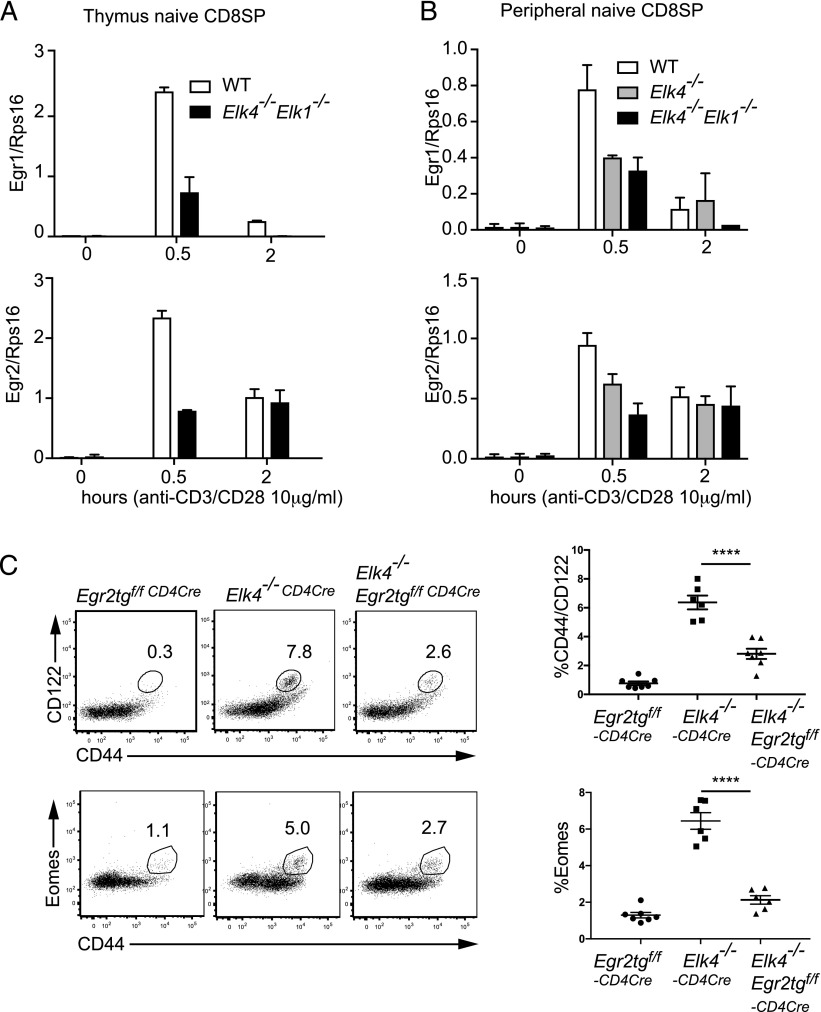
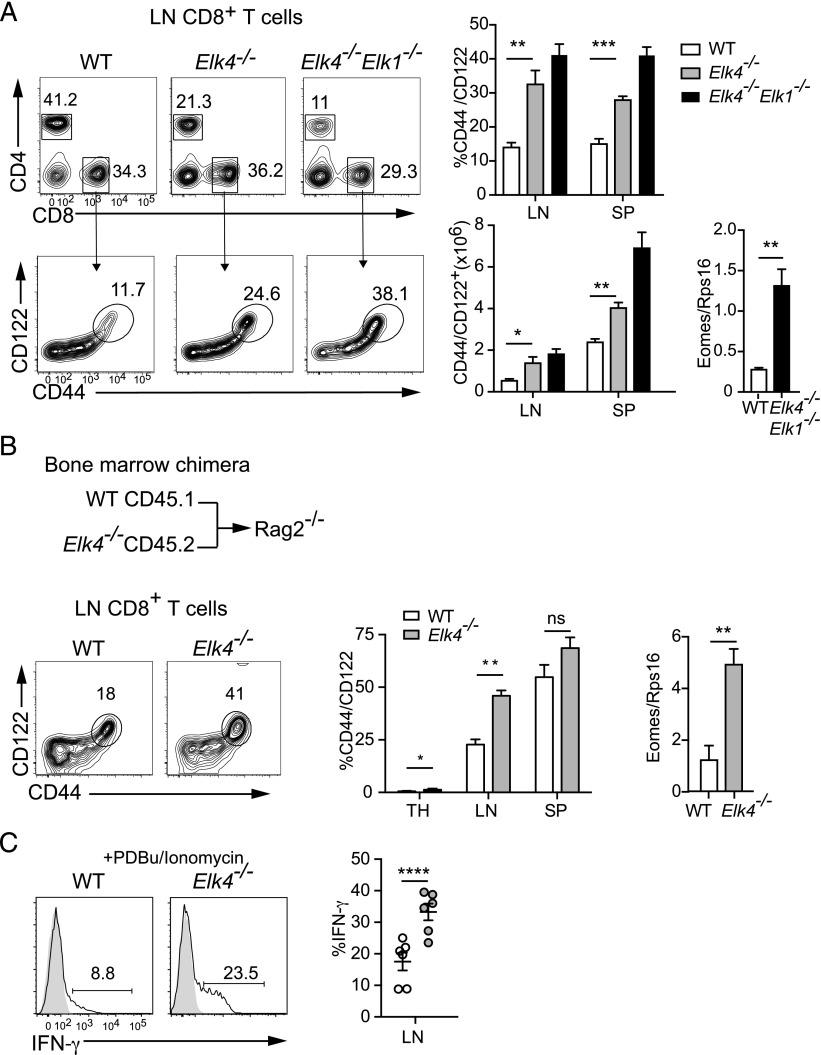
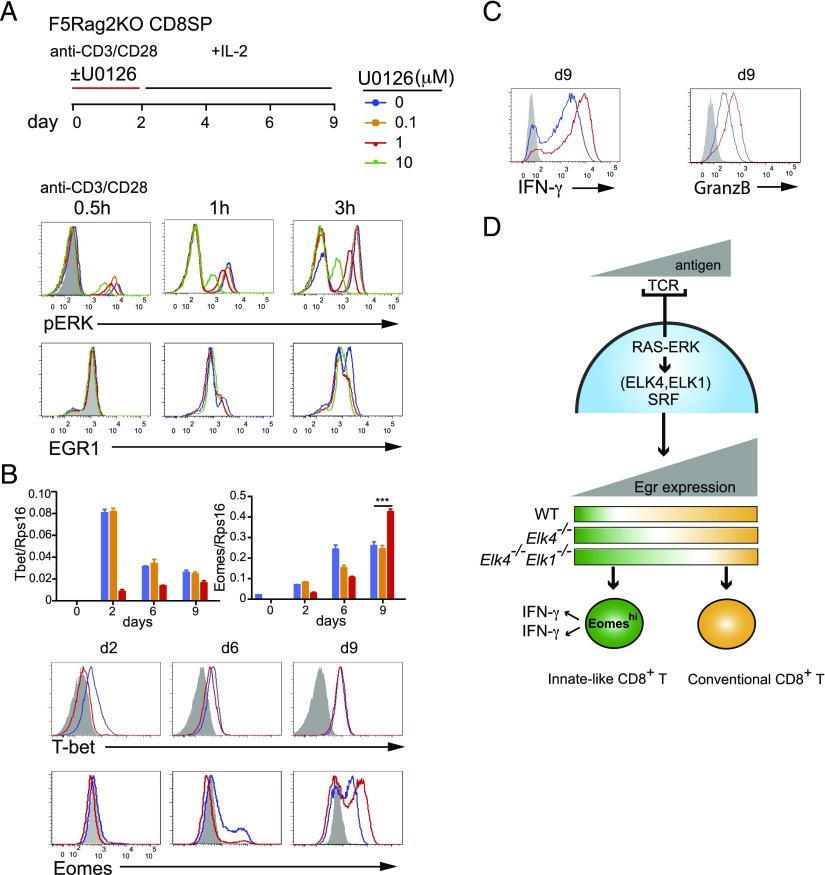
In mouse thymocyte development, signaling by the TCR through the ERK pathway is required for positive selection of conventional naive T cells. The Ets transcription factor ELK4 (SAP-1), an ERK-regulated cofactor of the SRF transcription factor, plays an important role in positive selection by activating immediate-early genes such as the Egr transcription factor family. The role of ELK4-SRF signaling in development of other T cell types dependent on ERK signaling has been unclear. In this article, we show that ELK4, and its close relative ELK1, act cell autonomously in the thymus to control the generation of innate-like αβ CD8+ T cells with memory-like characteristics. Mice lacking ELK4 and ELK1 develop increased numbers of innate-like αβ CD8+ T cells, which populate the periphery. These cells develop cell autonomously rather than through expansion of PLZF+ thymocytes and concomitantly increased IL-4 signaling. Their development is associated with reduced TCR-mediated activation of ELK4-SRF target genes and can be partially suppressed by overexpression of the ELK4-SRF target gene EGR2. Consistent with this, partial inhibition of ERK signaling in peripheral CD8+T cells promotes the generation of cells with innate-like characteristics. These data establish that low-level ERK signaling through ELK4 (and ELK1) promotes innate-like αβ CD8+ T cell differentiation, tuning conventional versus innate-like development.


Figures

FIGURE 1.
FIGURE 1.
Inactivation of Elk4 and Elk1 increases numbers of thymic innate-like αβ CD8+ T cells. (A) Top panels, TCRβ staining in thymocytes isolated from 8-to-12-wk-old WT, Elk4−/−, and Elk4−/−Elk-1−/− female animals, with proportions of CD4 and CD8 in TCRβhi-gated thymocytes below. Lower panels, TCRβhi CD8+-gated thymocytes were stained for cell surface expression of CD44, CD122, CXCR3, HSA, and intracellular Eomes. Gated percentages are indicated. (B) Proportions (left) and absolute cell numbers (right) of TCRβhi CD8+ CD122+ innate T cells in WT, Elk4−/−, and Elk4−/− Elk1−/− thymus. Data are representative of three independent staining experiments with ≥5 animals per genotype. (C) Levels of Eomes mRNA transcripts in WT and Elk4−/−Elk1−/− purified CD8+ SP thymocytes, three animals per genotype. Data are representative of three independent experiments. (D) TCRβhi CD8+-gated WT and Elk4−/− Elk1−/− thymocytes were stained for cell surface expression of NKG2D, intracellular CCL5, and T-bet. Proportions of TCRβhi CD8+ CD44+ NKG2D+, CCL5+, or T-bet+ cells are shown. n = 5 animals for each genotype; error bars represent SEM. Statistical significance: **p < 0.01, ***p < 0.001, ****p < 0.0001 (unpaired t test).
FIGURE 2.
FIGURE 2.
αβ CD8+ innate-like T cells have memory-like properties. (A) Purified αβ TCRβhi CD8+ SP thymocytes from Elk4+/−and Elk4−/− thymus were activated with PDBu and ionomycin and stained for intracellular IFN-γ 5 h later. Three animals per genotype; error bars represent SEM. Statistical significance: *p < 0.05 (unpaired t test). (B) Proliferation of CFSE-labeled FACS-sorted αβ CD8+ SP WT and Elk4−/− thymocytes stimulated by CD3/CD28 for 48 h. The percentage of divided cells is shown. Two independent experiments were performed. (C) Proliferation of CFSE-labeled FACS-sorted F5 Rag2−/− and F5 Elk4−/−Rag2−/− CD8+ thymocytes 48 h following stimulation with NP68 peptide and irradiated splenocytes from C57BL6 (APCs). Two independent experiments were performed.
FIGURE 3.
FIGURE 3.
Innate CD8+ T cells develop in the thymus. (A) Percentages of CD4 and CD8 cells in TCRβhi thymocytes isolated from P7 Elk4+/− and Elk4−/− littermates (top panels) and expression of CD44, CD122, and Eomes in TCRβhi CD8+-gated thymocytes (middle panels). Bottom, Proportions and absolute numbers of TCRβhi CD122+ CD8+ innate-like T cells. n ≥ 5 animals per genotype. (B) Profile of thymocytes stained with anti-CD4 and anti-CD8 from FTOC at day 8 (upper panel). Representative histogram of CD122 expression on TCRβhi CD8+-gated thymocytes from Elk4+/− (blue) and Elk4−/− (red) from day 8 FTOC (center panel). n ≥ 4 thymic lobes per genotype. Data are expressed as mean ± SEM. Statistical significance: *p < 0.05, **p < 0.01 (unpaired t test).
FIGURE 4.
FIGURE 4.
Elk4−/− αβ CD8+ innate-like T cell development in thymus is cell intrinsic. (A) Experimental strategy. Four groups of mixed bone marrow were transferred into irradiated CD45.1 hosts. Left panel, Each box indicates the majority and minority genotypes, with details given above, and experimental populations highlighted in color. Group 1: minority WT CD45.1/2 (20%, black), majority WT CD45.2 (80%). Group 2: minority WT CD45.1/2 (20%, blue), majority Elk4−/− CD45.2 (80%, green). Group 3: minority Elk4−/− CD45.2 (20%, red), majority WTCD45.1/2 (80%). Group 4: minority WTCD45.2 (20%, gray), majority WT CD45.1/2 (80%). Right panel, Level of chimerism in individual mice analyzed is represented for each group by a box-and-whiskers plot with minimum to maximum value. Each mouse is represented by two data points. (B) No bystander effects on minority population. Expression of CD44, CD122, and HSA on the minority TCRβhi CD8+ populations in each group is shown. Black versus blue: no influence of majority Elk4 genotype on WT cells. Red versus gray: Elk4−/− phenotype is detectable among majority WT cells. Black versus gray: no influence of CD45 allelic background. (C) Expression of CD44, CD122, and HSA on Elk4−/− cells among WT cells as the minority population (Group 3, red) or the majority population (Group 2, green). (D) Summary of results. Mean fluorescence intensity for CD44, CD122, and HSA for each population are color coded as in (A); comparisons made as in (B) and (C). Error bars represent SEM; n = 5 animals per group. Similar results were obtained when reconstitution was performed in Rag2−/− hosts (Supplemental Fig. 4). Statistical significance: ns, nonsignificant, *p < 0.05, **p < 0.01 (paired t test).
FIGURE 5.
FIGURE 5.
Elk4−/− αβ CD8+ innate-like T cell development does not reflect increased PLZF or IL-4 expression. (A). PLZF and IL-4 expression are not increased by Elk4 and Elk1 inactivation. Top panels, Analysis of intracellular PLZF, TCRβ, and CD1d expression in WT, Elk4−/−, and Elk4−/− Elk1−/− thymocytes (n = 7 per genotype). (B) Analysis of IL-4 and PLZF expression in unstimulated thymocytes (top panel) and PMA and ionomycin-stimulated thymocytes (bottom panel). (C) IL-4 expression in PLZF-gated and CD1d (iNKT)-gated populations (gray solid, unstimulated; black line, +PMA/ionomycin). PLZF-gated: WT, 33.17 ± 3.835%; Elk4−/−, 15.97 ± 1.927%; Elk4−/− Elk1−/−, 9.377 ± 0.3699%; n = 3, p < 0.01. iNKT-gated thymocytes: WT, 26.3 ± 2.335%; Elk4−/−, 12.9 ± 1.68%; Elk4−/− Elk-1−/−, 8.527 ± 0.5643%; n = 3, p < 0.01. (D) Proportions and cell numbers of iNKT cells in Elk4 Elk1–null thymus. (E) Unchanged proportions of CD4 and CD8 cells in iNKT populations and Elk4−/− Elk1−/− TCRβhi CD1d cells. (F) PLZF expression levels are unchanged in Elk4−/− Elk1−/− iNKT and TCRβhi CD4+ CD1d cells. Data are expressed as mean ± SEM. Statistical significance: **p < 0.01, ***p < 0.001 (unpaired t test).
FIGURE 6.
FIGURE 6.
Reduced immediate-early gene expression is associated with innate-like CD8+ T cell development. (A) CD8 SP TCRβhi thymocytes and (B) peripheral CD8 SP CD44lo CD122lo cells were activated using αCD3 and αCD28, and expression of Egr1 and Egr2 at the indicated times was analyzed by quantitative RT-PCR. (C) Rag2−/− animals were reconstituted either with bone marrow from animals carrying a conditional EGR2 transgene, along with a CD4-Cre transgene to allow expression of EGR2 at the DP stage of thymocyte development, with bone marrow from Elk4−/− CD4-Cre, or a combination of these genotypes. TCR βhi CD8 thymocytes were analyzed for CD44, CD122, and intracellular Eomesodermin as in Fig. 1. Error bars represent SEM; n ≥ 5 animals per group. Statistical significance: ****p < 0.0001 (unpaired t test).
FIGURE 7.
FIGURE 7.
Peripheral αβ CD8+ memory-like T cells in Elk4-null animals do not arise through lymphopenia-induced proliferation. (A) Increased proportions and numbers of CD44+ CD122+ CD8 T cells in lymph nodes and spleen of primary animals. Levels of Eomes transcripts in purified CD8+ lymph node (LN) T cells. (B) Analysis of CD8+ T cells from Rag2−/− hosts reconstituted with WT CD45.1 and Elk4−/− CD45.2 bone marrow at 1:1 ratio. Increased proportions of CD44+ CD122+ CD8+ SP T cells in thymus (TH; WT, 0.53 ± 0.23%; Elk4 −/−, 1.34 ± 0.47%; 10 mice each), LN, and spleen (SP) (n ≥ 8 mice). Right, Increased expression of Eomes transcripts in Elk4 −/− sorted LN CD8+ cells. (C) Left, Representative flow cytometry plots of intracellular production of IFN-γ in LN CD8+ T cells from animals reconstituted as in (B) after stimulation with PDBu and ionomycin. Right, Data summary (n = 6). Data are expressed as mean ± SEM. Statistical significance: *p < 0.05, **p < 0.01, ***p < 0.001, ****p < 0.0001 [unpaired (A) and paired (B and C) Student t test].
FIGURE 8.
FIGURE 8.
Inhibition of ERK signaling promotes differentiation of naive peripheral αβ CD8+ T cells into cells with memory-like characteristics. (A) Differentiation of naive WT F5 Rag2−/− CD8+ T cells. Peripheral CD8+ T cells were activated for 2 d with anti-CD3/anti-CD28 (10 μg/ml), with or without U0126 addition, and then cultured in IL-2 as indicated. Intracellular activated phospho-ERK (top) or Egr-1 protein (bottom) following anti-CD3 and anti-CD28 activation. Gray shading, isotype control; color-coded lines, WT F5 Rag2−/− cells according to U0126 concentration. (B) Expression of Eomes and T-bet. Top, Quantitative RT-PCR analysis. Bottom, Flow cytometric analysis of protein levels. (C) Flow cytometric analysis of intracellular IFN-γ and granzyme B expression after PDBu/ionomycin activation for 5 h. Data are representative of six (A–C) independent experiments, each done in triplicate. Data are mean ± SEM. Statistical significance: ***p < 0.001 (unpaired t test). (D) Summary of the relationship between MHC-peptide–TCR avidity, activation of TCF-SRF target genes, and cell differentiation pathways in thymus and periphery. Inactivation of ERK-ELK4/ELK1–SRF signaling in thymocytes and in peripheral αβ CD8+ T cells favors the development of cells with innate-like characteristics, which exhibit enhanced Eomes expression and immediate production of IFN-γ.

References

    1. Gascoigne N. R., Rybakin V., Acuto O., Brzostek J. 2016. TCR signal strength and T cell development. Annu. Rev. Cell Dev. Biol. 32: 327–348. - PubMed
    1. Starr T. K., Jameson S. C., Hogquist K. A. 2003. Positive and negative selection of T cells. Annu. Rev. Immunol. 21: 139–176. - PubMed
    1. Fischer A. M., Katayama C. D., Pagès G., Pouysségur J., Hedrick S. M. 2005. The role of erk1 and erk2 in multiple stages of T cell development. Immunity 23: 431–443. - PubMed
    1. McGargill M. A., Ch’en I. L., Katayama C. D., Pagès G., Pouysségur J., Hedrick S. M. 2009. Cutting edge: extracellular signal-related kinase is not required for negative selection of developing T cells. J. Immunol. 183: 4838–4842. - PMC - PubMed
    1. Berg L. J. 2007. Signalling through TEC kinases regulates conventional versus innate CD8(+) T-cell development. Nat. Rev. Immunol. 7: 479–485. - PubMed

Publication types

MeSH terms