. 2018 Oct 15;24(20):5098-5111.
doi: 10.1158/1078-0432.CCR-18-0652. Epub 2018 Aug 1.

Anti-Folate Receptor Alpha-Directed Antibody Therapies Restrict the Growth of Triple-negative Breast Cancer

Affiliations

Anti-Folate Receptor Alpha-Directed Antibody Therapies Restrict the Growth of Triple-negative Breast Cancer

Anthony Cheung et al. Clin Cancer Res. .

Abstract

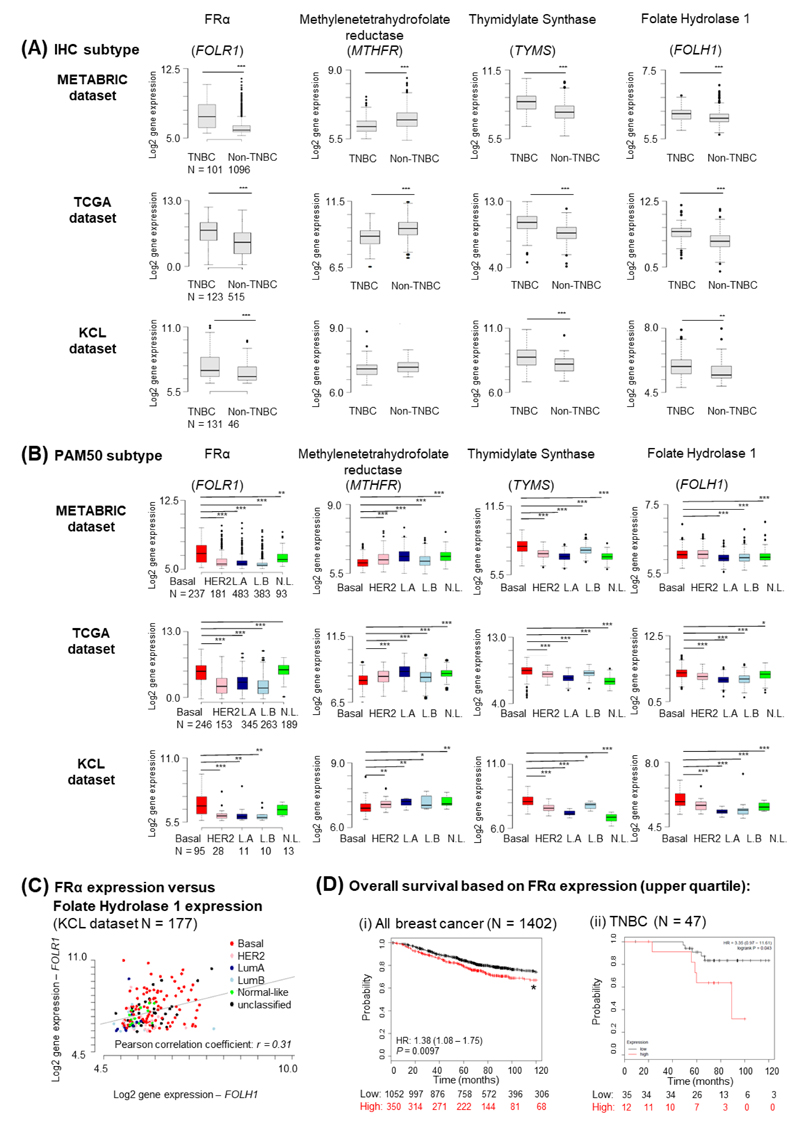
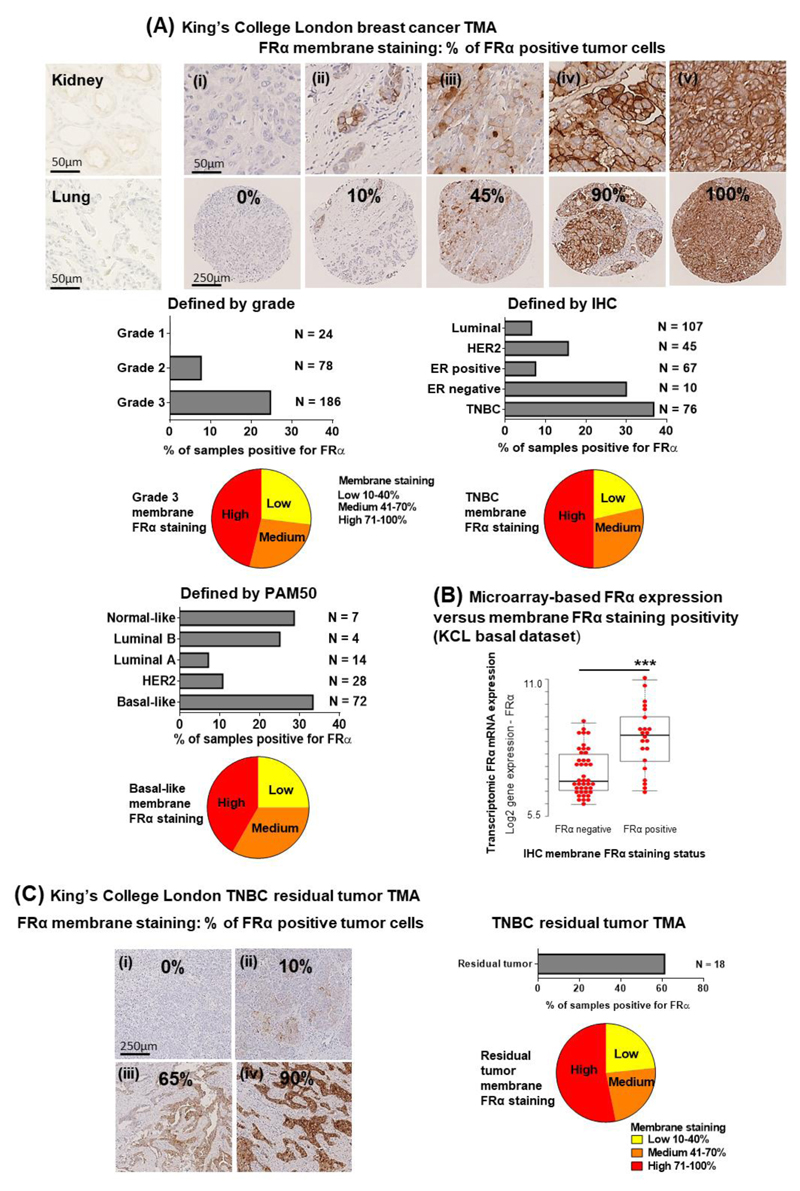
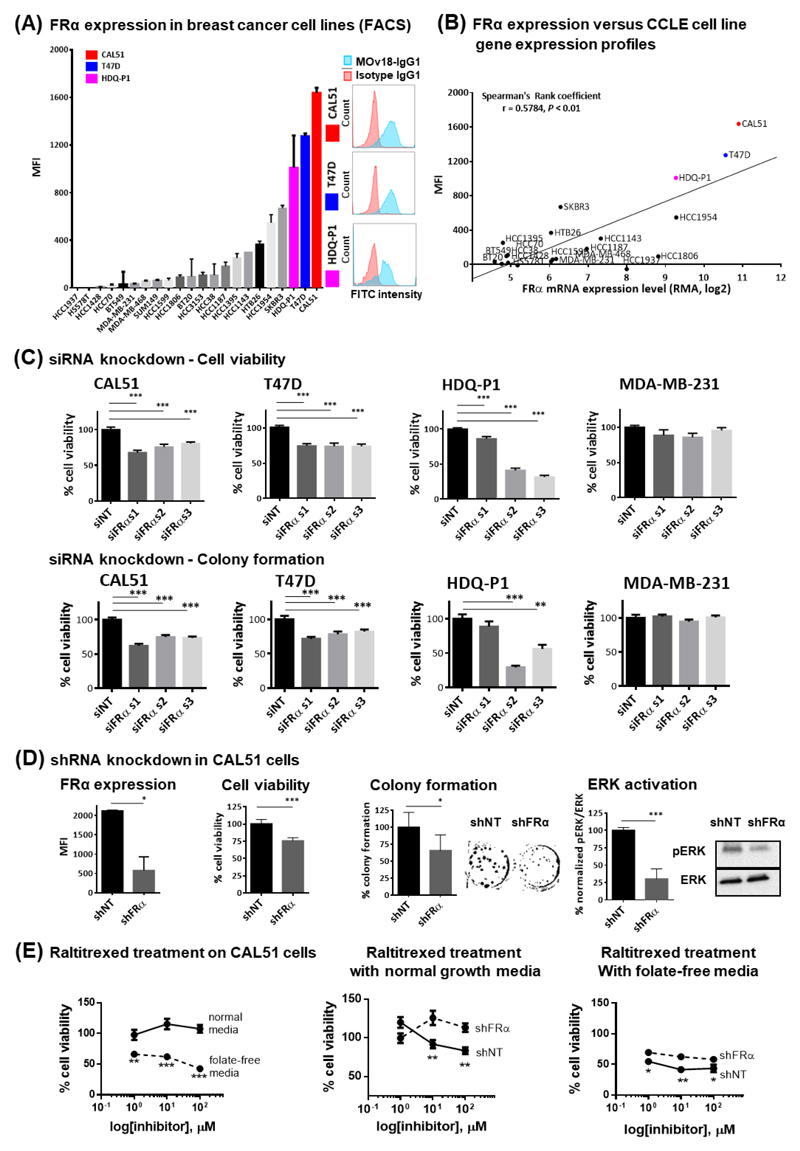
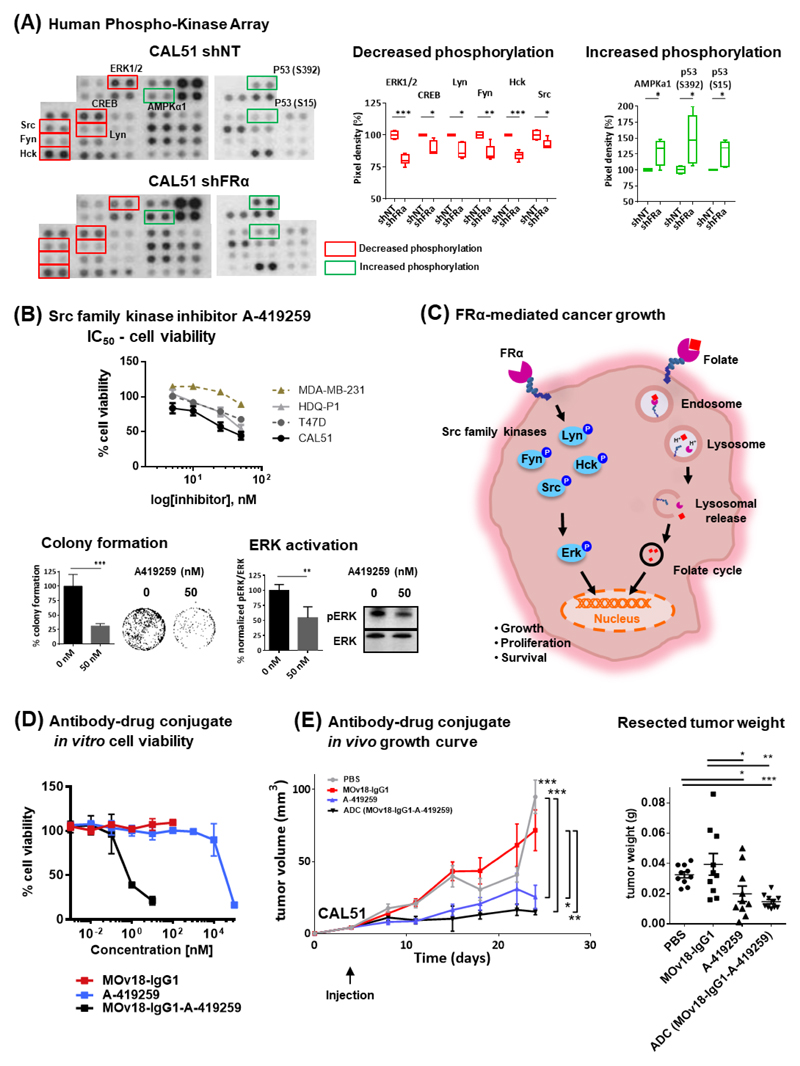
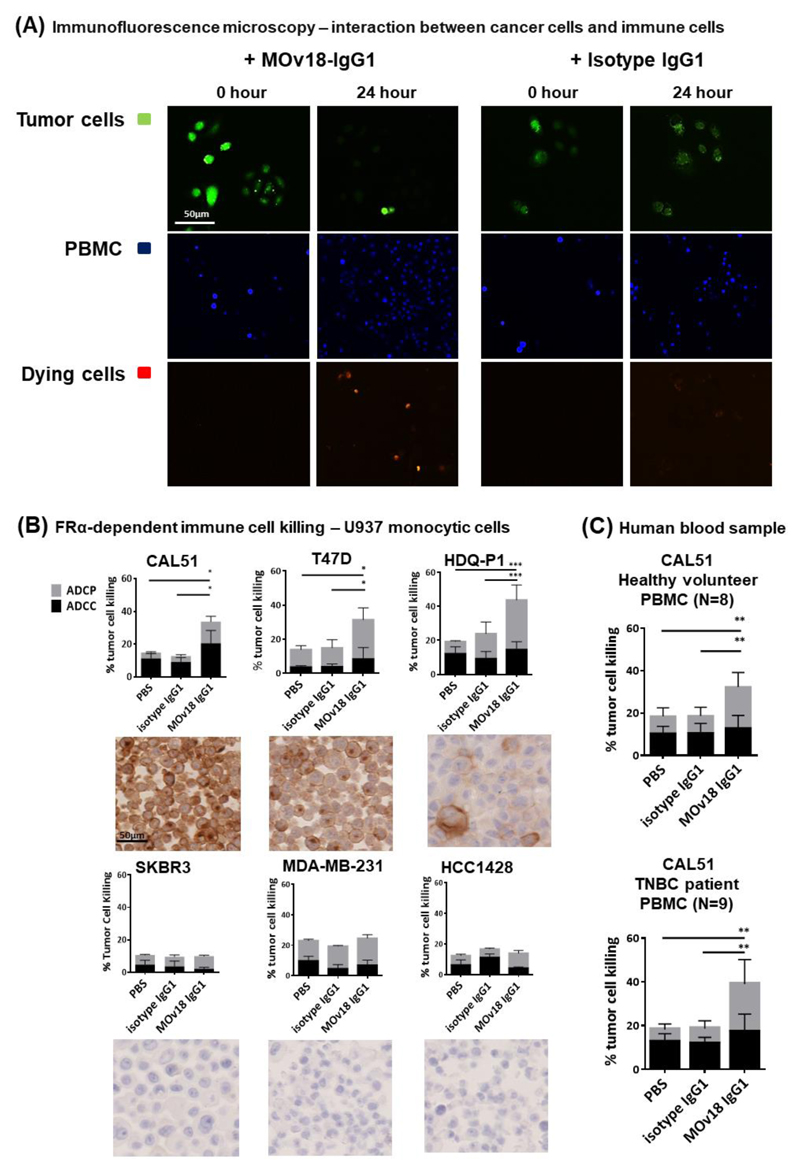
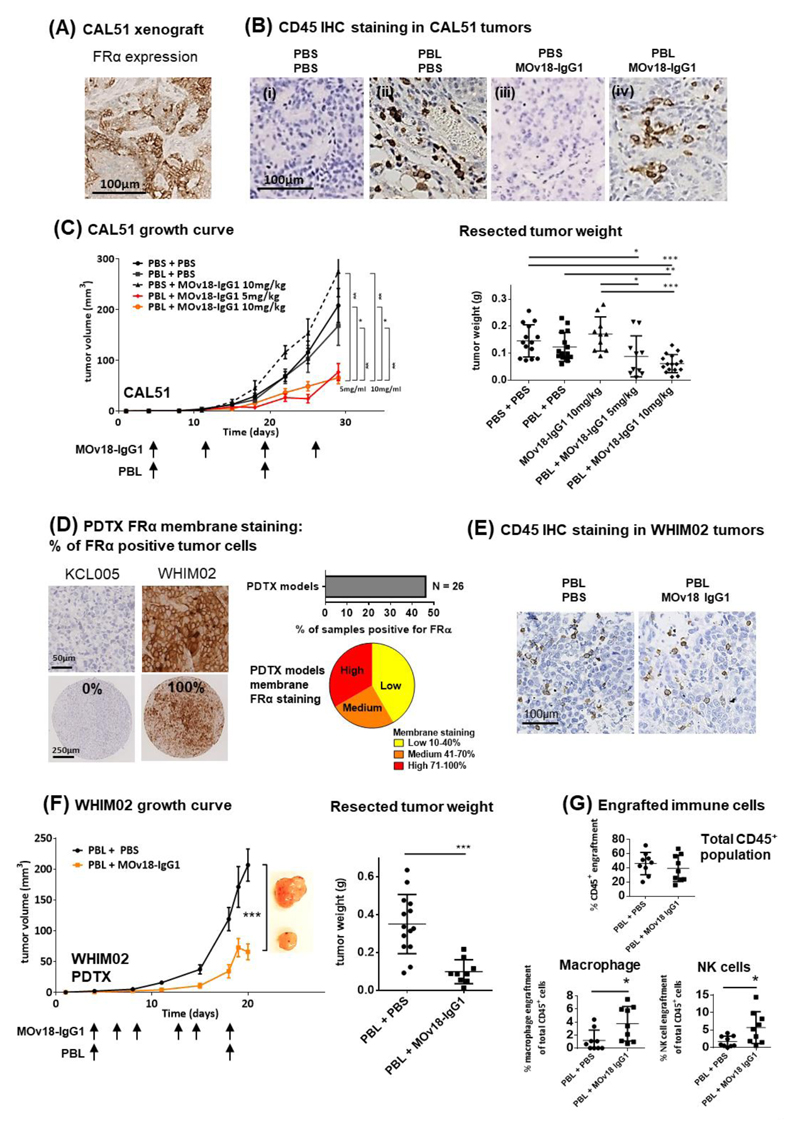
Purpose: Highly aggressive triple-negative breast cancers (TNBCs) lack validated therapeutic targets and have high risk of metastatic disease. Folate receptor alpha (FRα) is a central mediator of cell growth regulation that could serve as an important target for cancer therapy.Experimental Design: We evaluated FRα expression in breast cancers by genomic (n = 3,414) and IHC (n = 323) analyses and its association with clinical parameters and outcomes. We measured the functional contributions of FRα in TNBC biology by RNA interference and the antitumor functions of an antibody recognizing FRα (MOv18-IgG1), in vitro, and in human TNBC xenograft models.Results: FRα is overexpressed in significant proportions of aggressive basal like/TNBC tumors, and in postneoadjuvant chemotherapy-residual disease associated with a high risk of relapse. Expression is associated with worse overall survival. TNBCs show dysregulated expression of thymidylate synthase, folate hydrolase 1, and methylenetetrahydrofolate reductase, involved in folate metabolism. RNA interference to deplete FRα decreased Src and ERK signaling and resulted in reduction of cell growth. An anti-FRα antibody (MOv18-IgG1) conjugated with a Src inhibitor significantly restricted TNBC xenograft growth. Moreover, MOv18-IgG1 triggered immune-dependent cancer cell death in vitro by human volunteer and breast cancer patient immune cells, and significantly restricted orthotopic and patient-derived xenograft growth.Conclusions: FRα is overexpressed in high-grade TNBC and postchemotherapy residual tumors. It participates in cancer cell signaling and presents a promising target for therapeutic strategies such as ADCs, or passive immunotherapy priming Fc-mediated antitumor immune cell responses. Clin Cancer Res; 24(20); 5098-111. ©2018 AACR.


Conflict of interest statement

Disclosure of Potential Conflicts of Interest

S.N. Karagiannis and J.F. Spicer are founders and shareholders of IGEM Therapeutics Ltd. F.O. Nestle is an employee of Sanofi US. All other authors have declared that no conflict of interest exists.

Figures

Figure 1
Figure 1. Basal-like/TNBC is associated with upregulated FRα gene expression
Gene expression in METABRIC, TCGA and KCL datasets for FOLR1, MTHFR, TYMS and FOLH1. (A) Cohorts were divided into TNBC and non-TNBC based on IHC-defined receptor status. (B) Cohorts above were stratified according to PAM50 classification (Basal-like (Basal), HER2, luminal A (L.A), luminal B (L.B) and normal-like (N.L.)). Median-centered gene expression log2 values are shown. Numbers of patients per group is indicated below the graphs in the first column. P-values were determined using the Wilcoxon rank-sum test. (C) Relationship between FOLR1 and FOLH1 in the KCL dataset. (D) Association of FRα expression (upper quartile) with ten-year overall survival. (i) Kaplan-Meier curves in 1,402 breast cancer samples, and (ii) TNBC subset with 47 samples. The number of patients per group is indicated below. Significant P-values are indicated with an asterisk, where * P < 0.05; ** P < 0.005; *** P < 0.0005.
Figure 2
Figure 2. FRα expression is associated with high grade breast cancer and basal-like/TNBC, and is found in chemotherapy-resistant residual TNBC tumors.
(A) IHC staining for FRα membrane expression in KCL TMA. Representative images showing restricted expression in normal human kidney and lung sections, (i) a case with no FRα expression and negative staining, (ii-v) positive cell surface cancer cell FRα staining, score: 10% to 100%. Data were classified based on tumor grade and IHC- or PAM50-defined receptor status. Each group with the highest population of positive cancer cell surface staining were displayed in pie chart subdivided into three sectors (low, medium and high score based on % membrane FRα staining). (B) Microarray-based FRα mRNA expression were compared to membrane FRα staining positivity tested by IHC staining. (C) IHC staining for membrane FRα expression in KCL post-neoadjuvant chemotherapy residual TNBC tumor TMA. (i-iv) Representative images showing FRα staining, score: 0% to 100%. 11 out of 18 samples were found to be positive for FRα expression. Pie chart subdivided the samples into three sectors (low, medium and high score based on % of cells positive for membrane FRα staining). The proportion of patients per group is indicated below. Significant P-value is indicated with an asterisk where *** P < 0.0005.
Figure 3
Figure 3. Surface FRα protein levels in breast cancer cell lines and RNA interference of FRα leads to reduction in cellular activities
(A) Surface FRα expression of twenty-two breast cancer cell lines were evaluated by flow cytometry using MOv18-IgG1. Histopathological subtype of each cell line was listed on Supplementary Fig. 2A. Cell lines with high surface FRα level that were ultimately selected for further analysis are highlighted (CAL51, red; T47D, blue; HDQ-P1, pink, also see representative histograms of flow cytometric evaluations of FRα expression). The evaluations also included the widely studied breast cancer surface receptors EGFR and HER2 as internal controls (Supplementary Fig. 2B and 2C). (B) FRα mRNA expression data of the cell lines were extracted from CCLE database. Analyses showed a positive correlation (r = 0.5784) between protein and mRNA levels of expression (Spearman's Rank coefficient analysis, P < 0.01). (C) Significant restrictions in cellular growth after 96 hr of siRNA-mediated silencing of FRα, and reduction in colony density over a ten-day period, were shown only in the FRα-positive cell lines. (D) FRα expression in CAL51 cells transduced with non-targeting shRNA (shNT) and FRα-targeting shRNA (shFRα) were represented as MFI based on MOv18-IgG1 staining. CAL51 demonstrated growth restriction, visible reduction in colony density, and decreased ERK activity with stable FRα knockdown. (E) Parental CAL51 were treated with raltitrexed in both normal and folate-free conditions. Cells with FRα knockdown were less sensitive to the treatment in both conditions. The data represent the mean ± SEM values of at least three independent experiments. * P < 0.05; ** P < 0.005; *** P < 0.0005, by two-tailed unpaired t-test.
Figure 4
Figure 4. FRα modulates phosphorylation of targetable signaling molecules and antibody-drug conjugate inhibition of tumor growth.
(A) Images from Proteome Profiler Human Phospho-Kinase Array (decrease in phosphorylation marked in red; increase in phosphorylation marked in green). Each kinase is spotted in duplicate. Loading reference points at lower exposure for each membrane are shown in Supplementary Fig. 3B. Pixel densitometry analysis was expressed as fold change comparing the shFRα sample to corresponding shNT sample. (B) Cells were treated with board spectrum Src-family kinase inhibitor A-419259 to access the dose dependent inhibition of cellular growth. Half-maximal inhibitory concentration (IC50) doses were determined with MTT assay following 96 hr incubation. CAL51 incubated with A-419259 had shown visible reduction in colony density over a three-week period, where the inhibitor was refreshed weekly, and decreased ERK activity after 4 hr of drug treatment. (C) A model depicting FRα-mediated regulation of cancer signaling and as folate transporter for cell growth and survival. (D) Viability assessment of FRα-targeting MOv18-IgG1-coupled inhibitor ADC-treated CAL51 cells compared with MOv18-IgG1- and A-419259- treated cells. Data are means ± SEM from N = 3 independent experiments. (E) Growth curves and weight measurements of resected CAL51 tumors (N=10 mice per treatment group) treated with a single-dose of ADC (7.5mg/kg), MOv18-IgG1 (7.5mg/kg), A-419259 (5 mg/kg) or PBS. * P < 0.05; ** P < 0.005; *** P < 0.0005, by two-tailed unpaired t-test.
Figure 5
Figure 5. MOv18-IgG1 antibody induces immunotherapeutic tumor cell killing
(A) Fluorescent images of the live cell cytotoxicity assay. Live CFSE-labelled CAL51 tumor cells (green) were incubated for 24 hr with MOv18-IgG1 or isotype antibody and PBMC (stained with CellTracker Blue dye). Incorporation of ethidium homodimer-1 is depicted as red fluorescence into damaged cells, was observed. (B) FFPE cell pellets of six breast cancer cell lines (CAL51, T47D, HDQ-P1, SKBR3, MDA-MB-231 and HCC1428) were cut and stained for evaluation of FRα expression. Breast cancer cells were treated with 5 μg/ml MOv18-IgG1, or with isotype-matched control antibody. Human U937 monocytic cells were added to the tumor cells and incubated for 3 hr at 37oC followed by the flow cytometry-based tumor cell killing assay to determine the levels of ADCC and ADCP of cancer cells (N = 3). (C) Healthy volunteer PBMCs (N = 8), and TNBC patient PBMCs (N = 9) were also used, results were illustrated as total % tumor cell killing and as separated ADCC (black) and ADCP (grey). MOv18-IgG1 appeared to induce ADCP-biased anti-tumor effects. All the data represent the mean ± SEM values of three independent experiments. * P < 0.05; ** P < 0.005; *** P < 0.0005, by two-tailed unpaired t-test.
Figure 6
Figure 6. Restriction of orthotopic tumor growth in vivo
(A) IHC evaluation of FRα expression in paraffin-embedded CAL51 xenograft tumor specimens. (B) Tumor engraftment of human immune cells were confirmed by anti-human CD45 IHC staining in tissue sections. (C) Growth curves and weight measurements of resected CAL51 tumors of the partly immuno-humanized mice treated with 5 or 10 mg/kg MOv18-IgG1 antibodies. (D) IHC evaluation of FRα expression in a TMA of 26 PDTX models. Representative images showing no FRα expression in KCL005 and 100% positive FRα staining in WHIM02, with 43.2% of the TNBC PDTX models (N = 26) shown to be positive of FRα expression. (E) Tumor engraftment of human immune cells was confirmed by anti-human CD45 IHC staining. (F) Growth curves and weight measurements of resected WHIM02 PDTX tumors of the partly-immuno-humanized mice treated with 10 mg/kg MOv18-IgG1. (G) Flow cytometric analyses demonstrating engraftment of CD45+ human immune cells in the WHIM02 PDTX model, and infiltrating immune cell populations of potential effector cells (human macrophages and NK cells). Data are means ± SEM * P < 0.05; ** P < 0.005; *** P < 0.0005, by two-tailed unpaired t-test.

References

    1. Lehmann BD, Pietenpol JA, Tan AR. Triple-negative breast cancer: molecular subtypes and new targets for therapy. Am Soc Clin Oncol Educ Book. 2015:e31–39. - PubMed
    1. Perou CM, Sorlie T, Eisen MB, van de Rijn M, Jeffrey SS, Rees CA, et al. Molecular portraits of human breast tumours. Nature. 2000;406:747–752. - PubMed
    1. Diaz LK, Cryns VL, Symmans F, Sneige N. Triple negative breast carcinoma and the basal phenotype: From expression profiling to clinical practice. Advances in Anatomic Pathology. 2007;14:419–430. - PubMed
    1. Lehmann BD, Bauer JA, Chen X, Sanders ME, Chakravarthy AB, Shyr Y, et al. Identification of human triple-negative breast cancer subtypes and preclinical models for selection of targeted therapies. J Clin Invest. 2011;121:2750–2767. - PMC - PubMed
    1. Baselga J, Gomez P, Greil R, Braga S, Climent MA, Wardley AM, et al. Randomized phase II study of the anti-epidermal growth factor receptor monoclonal antibody cetuximab with cisplatin versus cisplatin alone in patients with metastatic triple-negative breast cancer. J Clin Oncol. 2013;31:2586–2592. - PMC - PubMed

Publication types

MeSH terms

Substances