. 2018 Aug 1;9(1):3003.
doi: 10.1038/s41467-018-05317-y.

Linked dimensions of psychopathology and connectivity in functional brain networks

Affiliations

Linked dimensions of psychopathology and connectivity in functional brain networks

Cedric Huchuan Xia et al. Nat Commun. .

Abstract

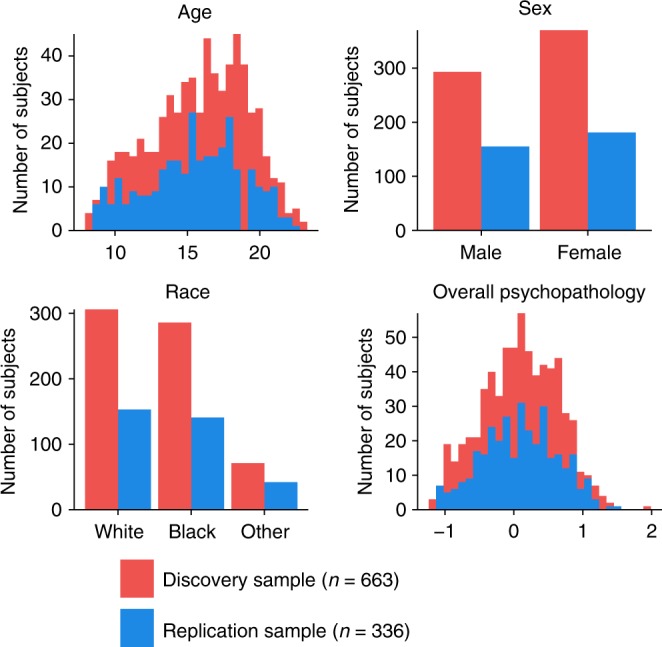
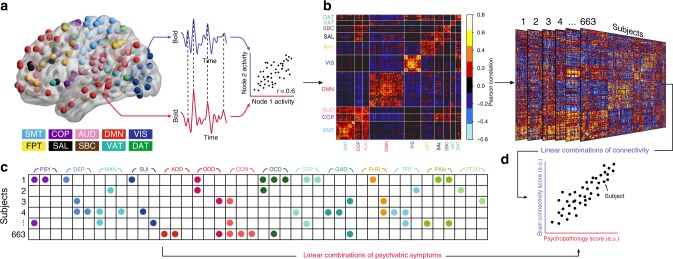
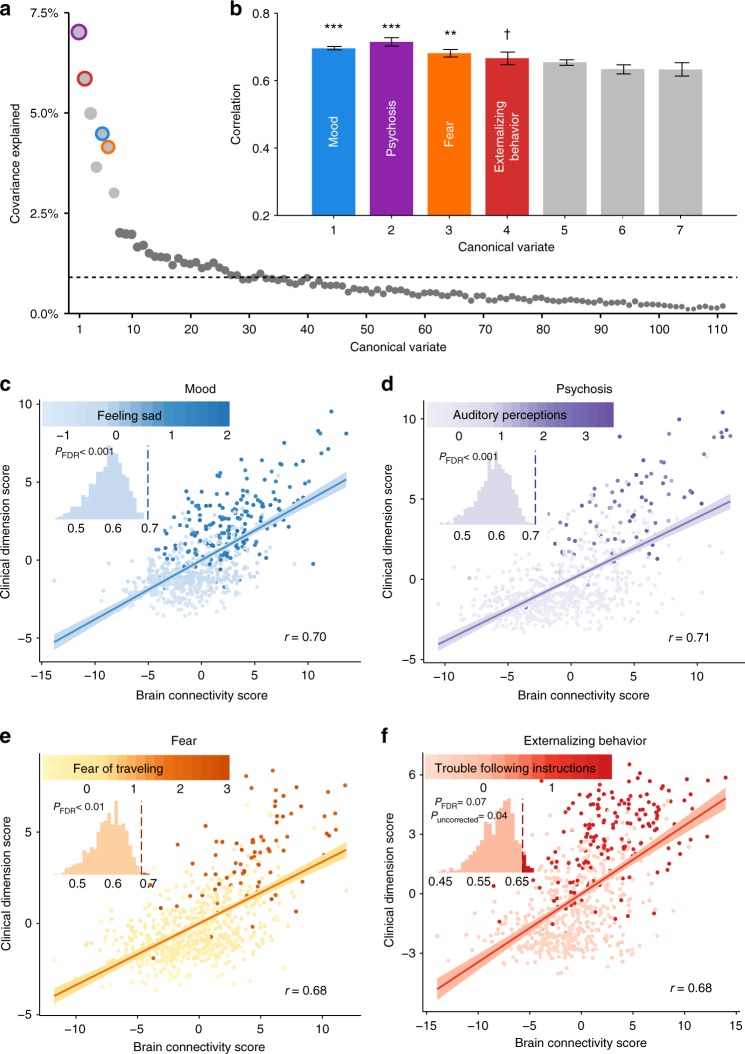
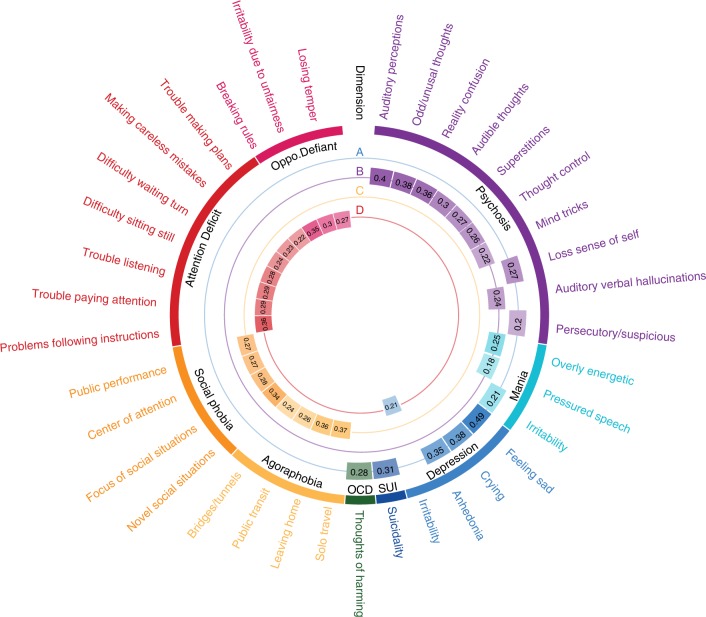
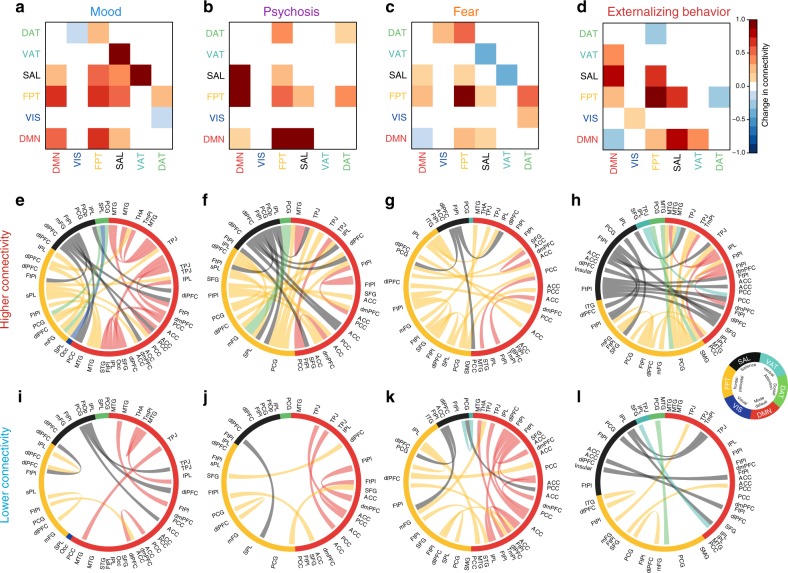
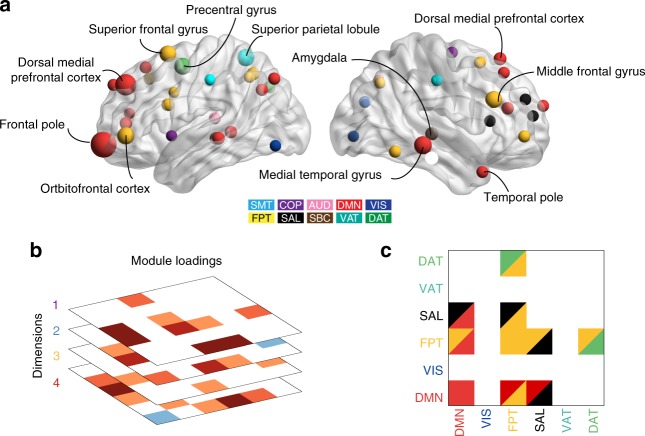
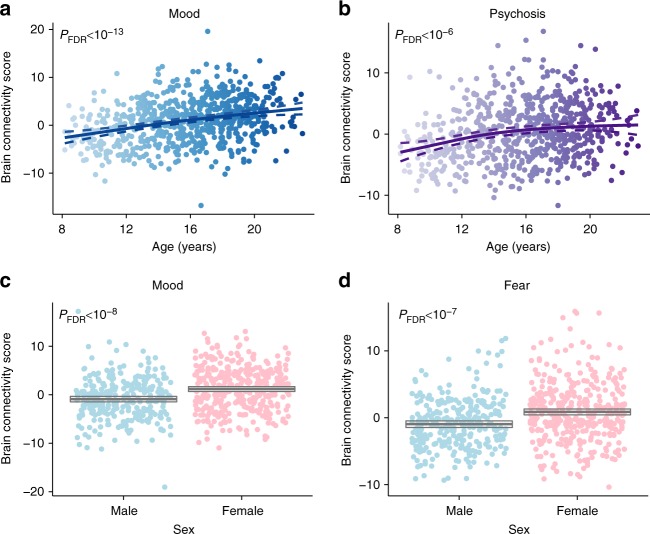
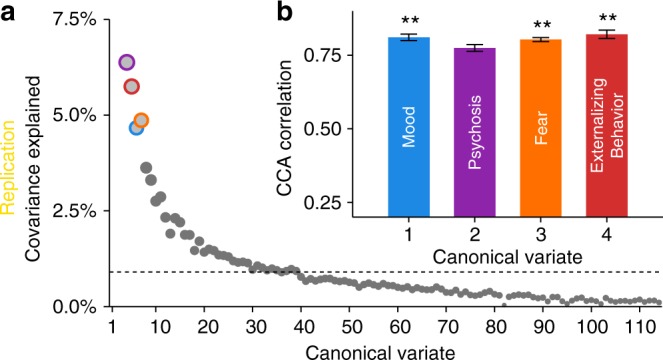
Neurobiological abnormalities associated with psychiatric disorders do not map well to existing diagnostic categories. High co-morbidity suggests dimensional circuit-level abnormalities that cross diagnoses. Here we seek to identify brain-based dimensions of psychopathology using sparse canonical correlation analysis in a sample of 663 youths. This analysis reveals correlated patterns of functional connectivity and psychiatric symptoms. We find that four dimensions of psychopathology - mood, psychosis, fear, and externalizing behavior - are associated (r = 0.68-0.71) with distinct patterns of connectivity. Loss of network segregation between the default mode network and executive networks emerges as a common feature across all dimensions. Connectivity linked to mood and psychosis becomes more prominent with development, and sex differences are present for connectivity related to mood and fear. Critically, findings largely replicate in an independent dataset (n = 336). These results delineate connectivity-guided dimensions of psychopathology that cross clinical diagnostic categories, which could serve as a foundation for developing network-based biomarkers in psychiatry.


Conflict of interest statement

R.T.S. has received legal consulting and advisory board income from Genentech/Roche. All other authors (C.H.X., Z.M., R.C., S.G., R.F.B., A.N.K., M.E.C., P.A.C., A.G., S.V., Z.C., T.M.M., D.R.R., K.R., D.H.W., C.D., R.C.G., R.E.G., D.S.B., and T.D.S.) declare no competing interest.

Figures

Fig. 1
Fig. 1
Participants demographics. The discovery and replication samples had similar demographic composition, including similar distributions of age, race, sex, and overall psychopathology
Fig. 2
Fig. 2
Schematic of sparse canonical correlation analysis (sCCA). a Resting-state fMRI data analysis schematic and workflow. After preprocessing, blood-oxygen-level dependent (BOLD) signal time series were extracted from 264 spherical regions of interest distributed across the cortex and subcortical structures. Nodes of the same color belong to the same a priori community as defined by Power et al.. b A whole-brain, 264 × 264 functional connectivity matrix was constructed for each subject in the discovery sample (n = 663 subjects). c Item-level data from a psychiatric screening interview (111 items, based on K-SADS) were entered into sCCA as clinical features (see details in Supplementary Data 1). d sCCA seeks linear combinations of connectivity and clinical symptoms that maximize their correlation. A priori community assignment: somatosensory/motor network (SMT), cingulo-opercular network (COP), auditory network (AUD), default mode network (DMN), visual network (VIS), fronto-parietal network (FPT), salience network (SAL), subcortical network (SBC), ventral attention network (VAT), dorsal attention network (DAT), Cerebellar and unsorted nodes not visualized. Psychopathology domains: psychotic and subthreshold symptoms (PSY), depression (DEP), mania (MAN), suicidality (SUI), attention-deficit hyperactivity disorder (ADD), oppositional defiant disorder (ODD), conduct disorder (CON), obsessive-compulsive disorder (OCD), separation anxiety (SEP), generalized anxiety disorder (GAD), specific phobias (PHB), mental health treatment (TRT), panic disorder (PAN), post-traumatic stress disorder (PTSD)
Fig. 3
Fig. 3
sCCA reveals multivariate patterns of linked dimensions of psychopathology and connectivity. a The first seven canonical variates were selected based on covariance explained. Dashed line marks the average covariance explained. b Three canonical correlations were statistically significant by permutation testing with FDR correction (q < 0.05), with the fourth one showing an effect at uncorrected thresholds. Corresponding variates are circled in (a). Error bars denote standard error. Dimensions are ordered by their permutation-based P value. cf Scatter plots of brain and clinical scores (linear combinations of functional connectivity and psychiatric symptoms, respectively) demonstrate the correlated multivariate patterns of connectomic and clinical features. Colored dots in each panel indicate the severity of a representative clinical symptom that contributed the most to this canonical variate. Each insert displays the null distribution of sCCA correlation by permutation testing. Dashed line marks the actual correlation. ***PFDR < 0.001, **PFDR < 0.01, †Puncorrected = 0.04
Fig. 4
Fig. 4
Connectivity-informed dimensions of psychopathology cross clinical diagnostic categories. a The mood dimension was composed of a mixture of depressive symptoms, suicidality, irritability, and recurrent thoughts of self-harm. b The psychotic dimension was composed of psychosis-spectrum symptoms, as well as two manic symptoms. c The fear dimension was comprised of social phobia and agoraphobia symptoms. d The externalizing behavior dimension showed a mixture of symptoms from attention-deficit and oppositional defiant disorders, as well as irritability from the depression section. The outermost labels are the item-level psychiatric symptoms (see details in Supplementary Data 1). The color arcs represent categories from clinical screening interview and the Diagnostic and Statistical Manual of Mental Disorders (DSM). Numbers in the inner rings represent sCCA loadings for each symptom in their respective dimension. Only loadings determined to be statistically significant by a resampling procedure are shown here
Fig. 5
Fig. 5
Patterns of within- and between-network connectivity contribute to linked psychopathological dimensions. ad Modular (community) level connectivity pattern associated with each psychopathology dimension. Both increased (eh) and diminished (il) connectivity in specific edges contributed to each dimension of psychopathology. The outer labels represent the anatomical names of nodes. The inner arcs indicate the community membership of nodes. The thickness of the chords represents the loadings of connectivity features
Fig. 6
Fig. 6
Loss of segregation between default mode and executive networks is shared across dimensions. a By searching for overlap of edges that contributed significantly to each dimension, we found common edges that were implicated across all dimensions of psychopathology. These were then summarized at a nodal level by the sum of their absolute loadings. Nodes that contributed significantly to every dimension included the frontal pole, superior frontal gyrus, dorsomedial prefrontal cortex, medial temporal gyrus, and amygdala. b Results of a similar analysis conducted at the module level. c Loss of segregation between the default mode and executive networks was shared across all four dimensions
Fig. 7
Fig. 7
Developmental effects and sex differences are concentrated in specific dimensions. Connectivity patterns associated with both the mood (a) and psychosis (b) dimensions increased significantly with age. Additionally, connectivity patterns associated with both the mood (c) and fear (d)  dimensions were significantly more prominent in females than males. Multiple comparisons were controlled for using the False Discovery Rate (q < 0.05). Dashed lines and boxes indicate the 95% confidence interval
Fig. 8
Fig. 8
Linked dimensions of psychopathology were replicated in an independent sample. All procedures were repeated in an independent replication sample of 336 participants. a The first four canonical variates in the replication sample were selected for further analysis based on covariance explained. Dashed line marks the average covariance explained. b The mood, fear, and externalizing behavior dimensions were significant by permutation testing. Corresponding variates are circled in (a). Error bars denote standard error. **PFDR < 0.01

References

    1. Singh I, Rose N. Biomarkers in psychiatry. Nature. 2009;460:202–207. doi: 10.1038/460202a. - DOI - PubMed
    1. Insel BTR, Cuthbert BN. Brain diorders? Precisely. Science. 2015;348:499–500. doi: 10.1126/science.aab2358. - DOI - PubMed
    1. Jacobi F, et al. Prevalence, co-morbidity and correlates of mental disorders in the general population: results from the German Health Interview and Examination Survey (GHS) Psychol. Med. 2004;34:597–611. doi: 10.1017/S0033291703001399. - DOI - PubMed
    1. Goodkind M, et al. Identification of a common neurobiological substrate for mental illness. JAMA Psychiatry. 2015;5797:305–315. doi: 10.1001/jamapsychiatry.2014.2206. - DOI - PMC - PubMed
    1. Lee SH, et al. Genetic relationship between five psychiatric disorders estimated from genome-wide SNPs. Nat. Genet. 2013;45:984–994. doi: 10.1038/ng.2711. - DOI - PMC - PubMed

Publication types

Grants and funding

LinkOut - more resources