Comparative Study
. 2018 Jul 26;8(1):11551.
doi: 10.1038/s41598-018-29984-5.

Radar-Based Heart Sound Detection

Affiliations
Comparative Study

Radar-Based Heart Sound Detection

Christoph Will et al. Sci Rep. .

Abstract

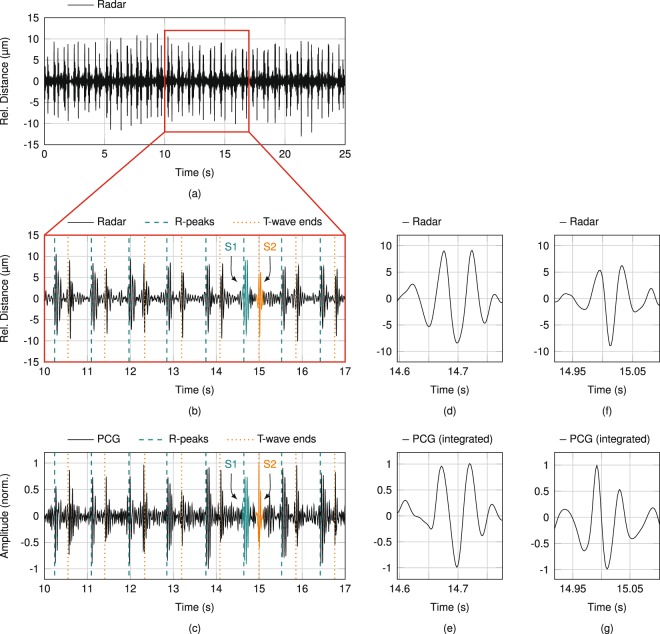
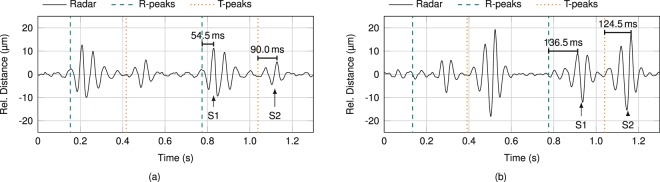
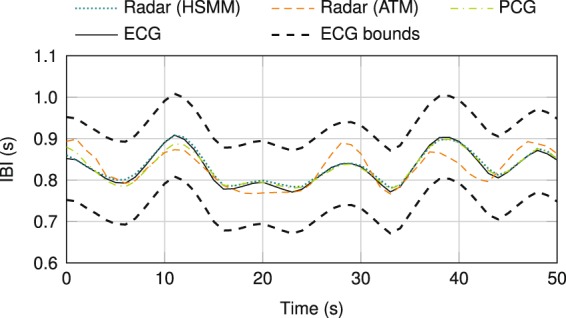
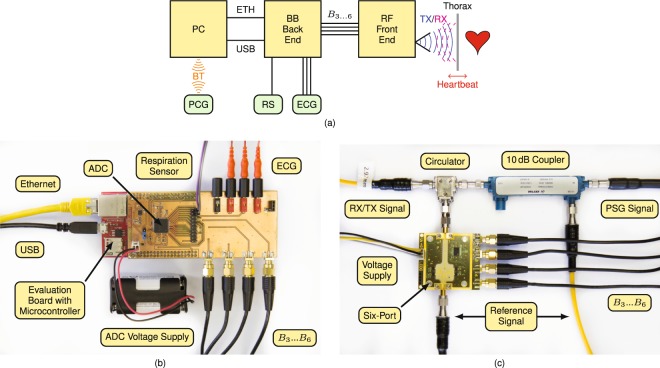
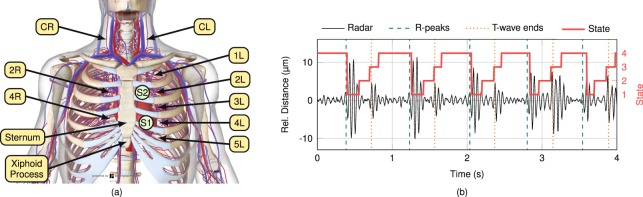
This paper introduces heart sound detection by radar systems, which enables touch-free and continuous monitoring of heart sounds. The proposed measurement principle entails two enhancements in modern vital sign monitoring. First, common touch-based auscultation with a phonocardiograph can be simplified by using biomedical radar systems. Second, detecting heart sounds offers a further feasibility in radar-based heartbeat monitoring. To analyse the performance of the proposed measurement principle, 9930 seconds of eleven persons-under-tests' vital signs were acquired and stored in a database using multiple, synchronised sensors: a continuous wave radar system, a phonocardiograph (PCG), an electrocardiograph (ECG), and a temperature-based respiration sensor. A hidden semi-Markov model is utilised to detect the heart sounds in the phonocardiograph and radar data and additionally, an advanced template matching (ATM) algorithm is used for state-of-the-art radar-based heartbeat detection. The feasibility of the proposed measurement principle is shown by a morphology analysis between the data acquired by radar and PCG for the dominant heart sounds S1 and S2: The correlation is 82.97 ± 11.15% for 5274 used occurrences of S1 and 80.72 ± 12.16% for 5277 used occurrences of S2. The performance of the proposed detection method is evaluated by comparing the F-scores for radar and PCG-based heart sound detection with ECG as reference: Achieving an F1 value of 92.22 ± 2.07%, the radar system approximates the score of 94.15 ± 1.61% for the PCG. The accuracy regarding the detection timing of heartbeat occurrences is analysed by means of the root-mean-square error: In comparison to the ATM algorithm (144.9 ms) and the PCG-based variant (59.4 ms), the proposed method has the lowest error value (44.2 ms). Based on these results, utilising the detected heart sounds considerably improves radar-based heartbeat monitoring, while the achieved performance is also competitive to phonocardiography.


Conflict of interest statement

The authors declare no competing interests.

Figures

Figure 1
Figure 1
(a) Exemplary filtered radar signal with the xiphoid process in focus. (b) Enlarged cutout with two highlighted heart sounds S1 and S2. (c) Synchronised PCG measurement data with corresponding heart sounds highlighted. (d) Enlarged versions of the highlighted S1 in radar and (e) PCG data. (f) Enlarged versions of the highlighted S2 in radar and (g) PCG data.
Figure 2
Figure 2
Timing analysis of S1 and S2 at (a) 4 L and (b) CL.
Figure 3
Figure 3
(a) Peak envelope variation of S1 and (b) S2. (c) Breathing influence on the S1 peak envelopes by comparing its PPE to the RS, as well as to the extracted breathing data from the radar signal.
Figure 4
Figure 4
A split of S2 in its aortic and pulmonary parts during inspiration can be observed both in the PCG signal measured at 2 L and in the radar signal measured at 2 R. The timing of the heart sounds is verified by the R-peaks and T-wave ends of the ECG signal.
Figure 5
Figure 5
IBI curve comparison of a PCG measurement and two algorithms evaluating a radar measurement to ECG data as reference.
Figure 6
Figure 6
(a) Block diagram of the overall experimental setup. (c) Photographs of the BB back end and (d) the RF front end.
Figure 7
Figure 7
(a) Exemplary in-phase (I) and quadrature (Q) signals for a time frame of 50 s and (b) the corresponding projection in the complex plane along with an estimated ellipse, which represents BB errors induced by impairments at the RF part of the system. (c) Error compensated complex representation and the unit circle as ideal projection of a moving target.
Figure 8
Figure 8
(a) Cardiovascular system at thorax and neck. (b) Resulting states after HSMM-based segmentation of the heart sound signal extracted from the radar data.
Figure 9
Figure 9
(a) Flowchart of the data pre-processing after acquisition. (b) Specific pattern caused by tapping in radar and PCG signal to synchronise the asynchronous PCG data to the synchronously acquired radar, ECG and respiration signals. (c) Filtered ECG signal with reference labels for detected R-peaks, as well as T-wave ends.

References

    1. Goldman, M. et al. Principles of clinical electrocardiography. (Los Altes: Lange, 1976).
    1. Gardner RM, Hollingsworth KW. Optimizing the electrocardiogram and pressure monitoring. Critical care medicine. 1986;14:651–658. doi: 10.1097/00003246-198607000-00016. - DOI - PubMed
    1. Elayi CS, Charnigo RJ, Heron PM, Lee BK, Olgin JE. Primary prevention of sudden cardiac death early post-myocardial infarction. Circulation: Arrhythmia and Electrophysiology. 2017;10:e005194. - PubMed
    1. Naghavi M, et al. From vulnerable plaque to vulnerable patient - part iii: executive summary of the screening for heart attack prevention and education (SHAPE) task force report. The American journal of cardiology. 2006;98:2–15. doi: 10.1016/j.amjcard.2006.03.002. - DOI - PubMed
    1. Diedler J, Sykora M, Jüttler E, Steiner T, Hacke W. Intensive care management of acute stroke: general management. International Journal of Stroke. 2009;4:365–378. doi: 10.1111/j.1747-4949.2009.00338.x. - DOI - PubMed

Publication types