

A comparison of relative survival and cause-specific survival methods to measure net survival in cancer populations
- PMID: 30070069
- PMCID: PMC6143929
- DOI: 10.1002/cam4.1706
A comparison of relative survival and cause-specific survival methods to measure net survival in cancer populations
Abstract
Background: Accurate cancer survival statistics are necessary for describing population-level survival patterns and measuring advancements in cancer care. Net cancer survival is measured using two methods: cause-specific survival (CSS) and relative survival (RS). Both are valid methodologies for estimating net survival and are used widely in medical research. In these analyses, we compare CSS to RS at selected cancer sites.
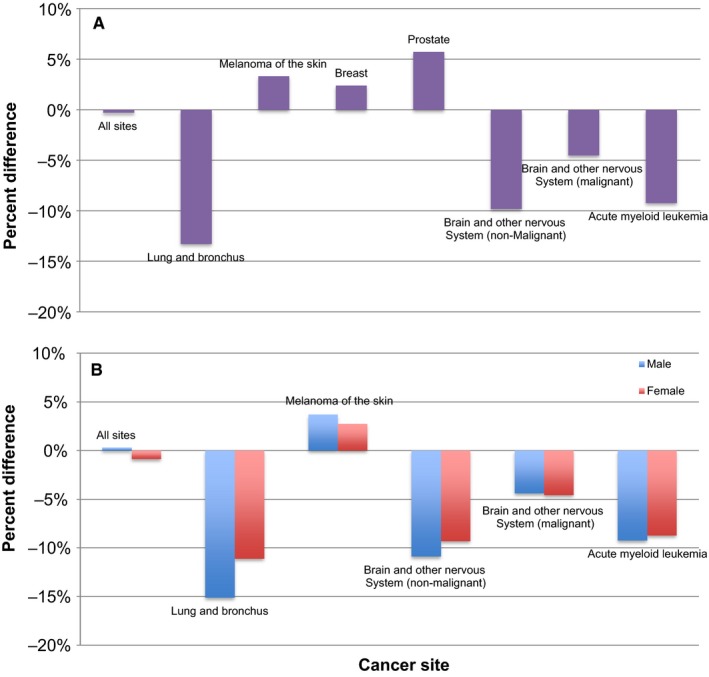
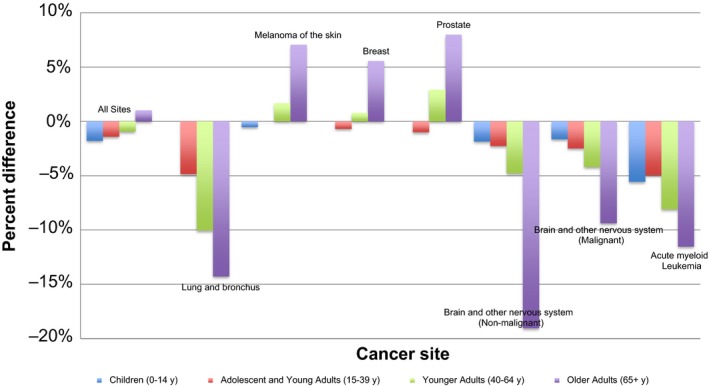
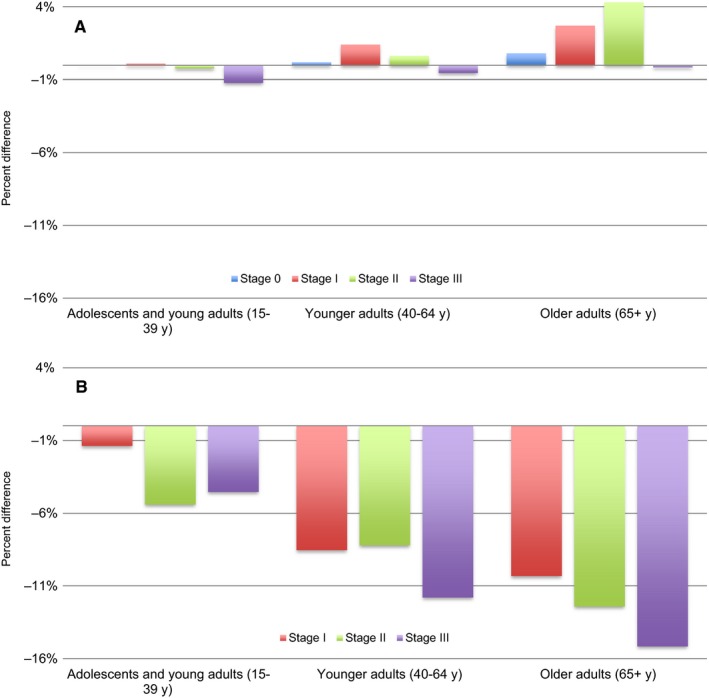
Methods: Using data from 18 SEER registries between 2000 and 2014, five-year RS and CSS estimates were generated overall as well as by age groups and by sex. To assess how closely the two survival methods corresponded, net survival percent difference was calculated with the following formula: ((RS-CSS)/RS)*100.
Results: Discrepancies between estimates obtained from CSS and RS methods varied with cancer site and age, but not by sex. In most cases, CSS was greater than RS, but cancers with available early screening and high survival rate had higher RS than CSS. Net survival percent differences were small in children and adolescents and young adults, and large in adults over the age of 40.
Conclusions: While both CSS and RS aim to quantify net survival, the estimates tend to differ due to the biases present in both methodologies. Error when estimating CSS most frequently stems from misclassification of cause of death, whereas RS is subject to error when no suitable life tables are available. Appropriate use of CSS and RS requires a detailed understanding of the characteristics of the disease that may lead to differences in the estimates generated by these methods.
Keywords: cancer registries; cause of death; life tables; statistical data interpretation; survival analysis.
© 2018 The Authors. Cancer Medicine published by John Wiley & Sons Ltd.
Figures
References
-
- Skyrud KD, Bray F, Moller B. A comparison of relative and cause‐specific survival by cancer site, age and time since diagnosis. Int J Cancer. 2014;135:196‐203. - PubMed
-
- Surveillance Epidemiology and End Results (SEER) Program. SEER*Stat Database: Incidence ‐ SEER 18 Regs Research Data + Hurricane Katrina Impacted Louisiana Cases, Nov 2016 Sub (1973‐2014 varying) ‐ Linked To County Attributes ‐ Total U.S., 1969‐2015 Counties, National Cancer Institute, DCCPS, Surveillance Research Program, released April 2017, based on the November 2016 submission.
-
- Surveillance Epidemiology and End Results (SEER) Program. SEER*Stat software version 8.3.4. http://www.seer.cancer.gov/seerstat. Accessed April 20, 2017.
-
- Surveillance Epidemiology and End Results (SEER) Program. Documentation for the Expected Survival Life Tables. https://seer.cancer.gov/expsurvival/documentation.html. Accessed April 20, 2017.
Publication types
MeSH terms
LinkOut - more resources
Full Text Sources
Other Literature Sources
