. 2018 Sep;80(1):e56.
doi: 10.1002/cpcb.56. Epub 2018 Aug 2.

Expansion Microscopy: Protocols for Imaging Proteins and RNA in Cells and Tissues

Affiliations

Expansion Microscopy: Protocols for Imaging Proteins and RNA in Cells and Tissues

Shoh M Asano et al. Curr Protoc Cell Biol. 2018 Sep.

Abstract

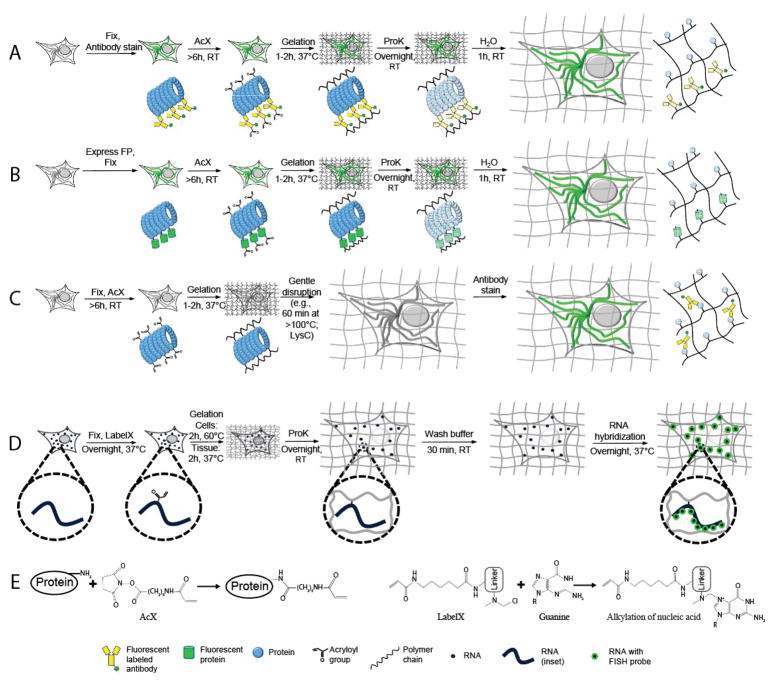
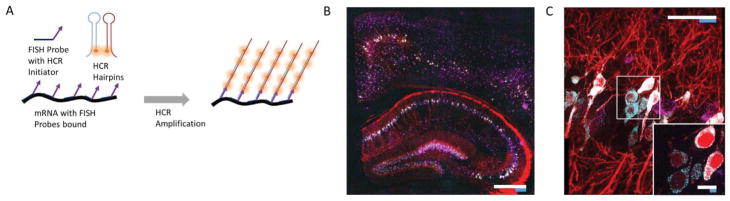
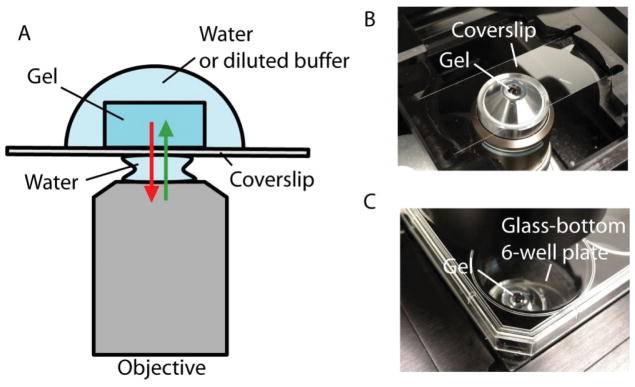
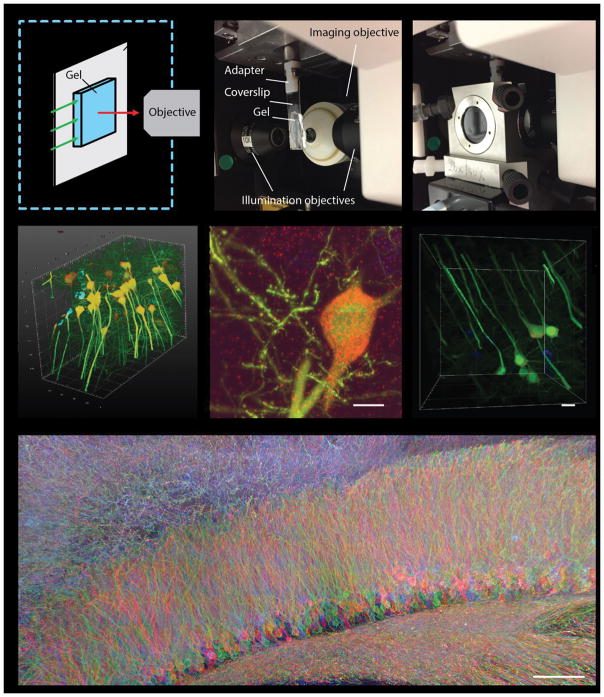
Expansion microscopy (ExM) is a recently developed technique that enables nanoscale-resolution imaging of preserved cells and tissues on conventional diffraction-limited microscopes via isotropic physical expansion of the specimens before imaging. In ExM, biomolecules and/or fluorescent labels in the specimen are linked to a dense, expandable polymer matrix synthesized evenly throughout the specimen, which undergoes 3-dimensional expansion by ∼4.5 fold linearly when immersed in water. Since our first report, versions of ExM optimized for visualization of proteins, RNA, and other biomolecules have emerged. Here we describe best-practice, step-by-step ExM protocols for performing analysis of proteins (protein retention ExM, or proExM) as well as RNAs (expansion fluorescence in situ hybridization, or ExFISH), using chemicals and hardware found in a typical biology lab. Furthermore, a detailed protocol for handling and mounting expanded samples and for imaging them with confocal and light-sheet microscopes is provided. © 2018 by John Wiley & Sons, Inc.

Keywords: FISH; antibody; confocal microscopy; expansion microscopy; fluorescence microscopy; hydrogel; imaging; immunocytochemistry; immunohistochemistry; light-sheet microscopy; super-resolution microscopy; tissue clearing.


Conflict of interest statement

CONFLICTS OF INTEREST

ESB is co-founder of a company seeking to commercialize clinical applications of ExM. ATW, FC, PT, RG, and ESB are inventors on one or more granted or pending patents related to ExM.

Figures

Figure 1
Figure 1
Expansion microscopy (ExM) workflows discussed in this unit. (A–C) Protein retention ExM (proExM) workflows. A, Samples are fixed and stained with antibodies using conventional immunostaining protocols, then treated at room temperature (RT) with Acryloyl-X SE (AcX, see panel E, left, for detail), which enables proteins to be anchored to the hydrogel. The samples then undergo gelation, proteinase K (ProK) treatment for mechanical homogenization (also called digestion), and expansion in water. (B) Samples expressing fluorescent proteins are fixed and treated with AcX before going through gelation, mechanical homogenization, and expansion in water. (C) Samples are fixed and treated with AcX before going through gelation, a comparatively gentle mechanical homogenization process (e.g., high temperature denaturing in detergent solution), and expansion, followed by antibody staining. (D) Expansion fluorescence in situ hybridization (ExFISH). Samples are fixed and treated with LabelX (see panel E, right, for detail), which enables RNA to be anchored to the polymer. The samples then go through gelation, mechanical homogenization, and expansion. Finally, FISH probes are hybridized to the anchored RNA. (E) Schematics of AcX binding to a protein (left) and LabelX binding to a guanine base of RNA (right). Modified from (Tillberg et al., 2016) and (Chen et al., 2016).
Figure 2
Figure 2
Gelation of cultured cells. (A) Schematic showing the side view of a gelation chamber. The cultured cells are on the top surface of the cell culture substrate. The lid is moved towards the chamber, bearing a droplet of the gelling solution. (B) Schematic showing lid placement. The lid is moved towards the sample so that the droplet merges with the gelling solution in the chamber, which prevents air pocket formation. (C) Schematic showing the gelation chamber ready for polymerization at 37°C. (D) Schematic showing removal of the lid and the spacers. The lid is first pried open and then the gel is trimmed down with a razor blade to remove excess gel. (E) Schematic showing the digestion step. The cell culture substrate with the gel on top is placed in the digestion buffer, which eventually causes the gel to come off the substrate. (F) Schematic showing the gel detached from the substrate and slightly expanded after the digestion step.
Figure 3
Figure 3
Optical clearing resulting from the expansion process. A 200 μm thick fixed brain hemi-slice is shown left. Post-expansion (right), the gel containing the hemi-slice becomes significantly enlarged and optically clear. Modified from Chen et al., 2015.
Figure 4
Figure 4
Gelation of intact tissues. (A) Schematic showing the side view of a gelation chamber. The intact tissue is placed in between the spacers, which should be thicker than the tissue. The lid is moved towards the chamber, bearing a droplet of the gelling solution. (B) Schematic showing lid placement. The lid is moved towards the sample so that the droplet merges with the gelling solution in the chamber, which prevents air pocket formation in the gel. (C) Schematic showing the gelation chamber ready for polymerization at 37°C. After the chamber is correctly constructed and filled with gelling solution, polymerization is carried out at 37°C for 2 hours. (D) Schematic showing removal of the lid and the spacers. The lid is first pried open and then the gel is trimmed with a razor blade. (E) Schematic showing the digestion step. The trimmed gel is placed in the digestion buffer. (F) Schematic showing the gel slightly expanded after the digestion step.
Figure 5
Figure 5
Protein retention expansion microscopy (proExM) of virally injected, membrane bound Brainbow3.0 followed by additional antibody staining. A) Maximum intensity projection of a large area of a mouse hippocampus. B) Pre-expansion image of a single optical section of the boxed region in A). C) Post-expansion image of the same optical section as in B). Scale bars: A) 50 μm (physical size post-expansion 198 μm); B) 5 μm; C) 5 μm (19.8 μm). Adapted from Gao et al., 2017 and Tillberg et al., 2016.
Figure 6
Figure 6
Post-expansion immunostaining. (A) Thy1-YFP-expressing mouse brain hemi-slice before expansion. (B) The brain slice was gelled and mechanically homogenized by autoclaving in an alkaline buffer, followed by anti-GFP primary antibody and Alex Fluor 488 conjugated secondary antibody staining. Scale bar: 1 mm. Adapted from Tillberg et al., 2016.
Figure 7
Figure 7
Tupperware enclosure setup for nitrogen perfusion and gelling of ExFISH cultured cell samples. (A) Open Tupperware with a plastic platform for supporting the sample and a pool of water at the bottom for humidity. (B) Closed Tupperware with two inlets on the cover sealed with tape. (C) Nitrogen perfusion of sample inside the Tupperware. Tape seals have been removed and a nitrogen line has been inserted through one inlet, with the other remaining open to allow air to escape. (D) Following nitrogen perfusion, the two inlets are sealed with tape, and the Tupperware containing the sample to be gelled is placed in a 60°C incubator.
Figure 8
Figure 8
Nanoscale imaging of RNA in cultured cells via expansion fluorescence in situ hybridization (ExFISH). (A) smFISH image of ACTB before expansion of a cultured HeLa cell. Inset shows zoomed in region, highlighting transcription sites in nucleus. (B) As in A, using ExFISH. (C) smFISH image before expansion (top) and using ExFISH (bottom) of NEAT1 lncRNA in the nucleus of a HeLa cell. Magenta and green indicate probe sets binding to different parts of NEAT1. (D) Insets showing a NEAT1 cluster (boxed region of C) with smFISH (left) and ExFISH (right). Scale bars (white, in pre-expansion units; blue scale bars are divided by the expansion factor noted): (A,B) 10 μm (expansion factor, 3.3x), inset 2 μm; (C) 2 μm (3.3x); and (D) 200 nm (3.3x). Adapted from (Chen et al., 2016).
Figure 9
Figure 9
3D nanoscale imaging of RNA in mouse brain tissue using hybridization chain reaction amplified expansion fluorescence in situ hybridization (HCR-ExFISH). (A) Schematic for HCR-mediated signal amplification. FISH probes bearing HCR initiators are hybridized to a target mRNA, and during amplification, metastable DNA hairpins bearing fluorophores assemble into polymer chains onto the initiators, thereby amplifying the signal downstream of the FISH probe hybridization event. (B) Widefield fluorescence image of Thy1–YFP mouse brain showing HCR-ExFISH of YFP mRNA and Gad1 mRNA (red, YFP protein; cyan, YFP mRNA; magenta, Gad1 mRNA). (C) Confocal image of mouse hippocampal tissue from A, showing single RNA puncta. Inset, one plane of the boxed region. Scale bars (white, in pre-expansion units; blue scale bars are divided by the expansion factor noted): (B) 500 μm (expansion factor 2.9x); (C) 50 μm (2.9x), inset 10 μm. Adapted from (Chen et al., 2016).
Figure 10
Figure 10
Imaging expanded ExM samples with inverted microscopes. (A) Schematics showing the configuration of the objective and the expanded sample on an inverted microscope (with a water-immersion objective). The green and red arrows show the excitation and the emission light, respectively. (B) Typical imaging setup on an inverted spinning disk confocal microscope with a coverslip. (C) Typical imaging setup on an inverted spinning disk confocal microscope with a glass-bottom multi-well plate.
Figure 11
Figure 11
Imaging expanded ExM samples with light sheet microscopes. (A) Schematics showing configurations of the objectives and the mounted sample on a commercial light sheet microscope (Zeiss Z.1 light sheet). The green and red arrows show the excitation and emission light, respectively. Note that the gel is facing the objective and is mounted on a coverslip as the backing, which is glued onto a 3D-printed adapter that is connected to the rod-shaped sample holder hanging from the top (the rod is not shown in the schematic). The sample is immersed in water or diluted buffer and the excitation light sheet travels through the sides of the gel perpendicular to the detection objective focal axis. (B) Sample mounting inside the Zeiss Z.1 light sheet microscope, with the imaging chamber removed. Two illumination objectives are on the side to form the excitation light sheets, and a water-immersion objective is located perpendicular to the illumination objectives for the imaging. (C) The same setup as B with the imaging chamber installed. The two side glass windows allow the light sheet to illuminate the sample and the front glass window is used for rough sample alignment using a small camera. Together with the imaging objective at the back, the chamber is sealed and is filled with water (or diluted PBS for ExFISH samples) during the imaging. (D) 3D representation of Zeiss Z.1 light sheet microscopy image of Thy1-YFP (green) brain tissue with ExFISH targeting YFP (red) and Gad1 (blue) mRNAs. (E) Maximum intensity projection (~8 μm in Z) of a subvolume of D demonstrating the capability to resolve single RNA molecules within a cell body after expansion. (F) Volume rendering of a subvolume of D. Scale bars, 10 μm (E, in pre-expansion units) and 20 μm (F, in pre-expansion units). About 3x expansion factor for all samples. Adapted from (Chen et al., 2016). (G) Rendered image of a section of a large scale 3-D multicolor recording of a virally delivered Brainbow3.0 mouse hippocampus section using pre-expansion staining proExM, and imaged on a Zeiss Z.1 light sheet microscope. The expansion factor is ~4.5x and the resulting effective lateral pixel size is 60 nm. Scale bar: 100 μm (in pre-expansion units).

References

    1. Chang J-B, Chen F, Yoon Y-G, Jung EE, Babcock H, Kang JS, Asano S, Suk H-J, Pak N, Tillberg PW, et al. Iterative expansion microscopy. Nature Methods 2017 - PMC - PubMed
    1. Chen F, Tillberg PW, Boyden ES. Expansion microscopy. Science. 2015;347:543–548. - PMC - PubMed
    1. Chen F, Wassie AT, Cote AJ, Sinha A, Alon S, Asano S, Daugharthy ER, Chang JB, Marblestone A, Church GM, et al. Nanoscale imaging of RNA with expansion microscopy. Nature methods. 2016;13:679–84. - PMC - PubMed
    1. Choi HMT, Beck VA, Pierce NA. Next-generation in situ hybridization chain reaction: Higher gain, lower cost, greater durability. ACS Nano. 2014;8:4284–4294. - PMC - PubMed
    1. Cohen Y, Ramon O, Kopelman IJ, Mizrahi S. Characterization of inhomogeneous polyacrylamide hydrogels. Journal of Polymer Science Part B: Polymer Physics. 1992;30:1055–1067.

Publication types