. 2018 Sep;7(9):603-612.
doi: 10.1002/psp4.12325. Epub 2018 Aug 12.

Model-Based Prediction of Plasma Concentration and Enterohepatic Circulation of Total Bile Acids in Humans

Affiliations

Model-Based Prediction of Plasma Concentration and Enterohepatic Circulation of Total Bile Acids in Humans

Benjamin Guiastrennec et al. CPT Pharmacometrics Syst Pharmacol. 2018 Sep.

Abstract

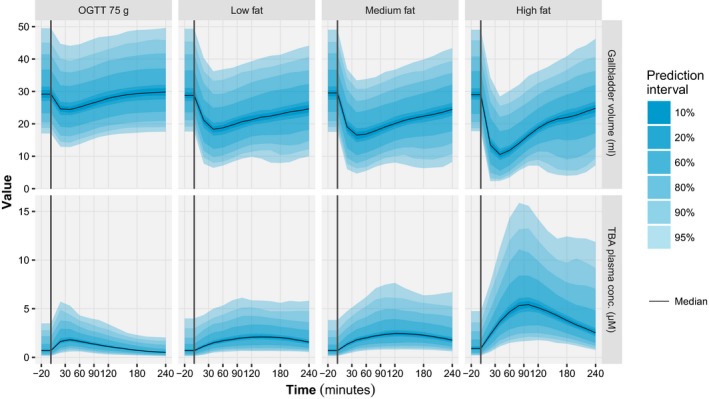
Bile acids released postprandially can modify the rate and extent of lipophilic compounds' absorption. This study aimed to predict the enterohepatic circulation (EHC) of total bile acids (TBAs) in response to caloric intake from their spillover in plasma. A model for TBA EHC was combined with a previously developed gastric emptying (GE) model. Longitudinal gallbladder volumes and TBA plasma concentration data from 30 subjects studied after ingestion of four different test drinks were supplemented with literature data. Postprandial gallbladder refilling periods were implemented to improve model predictions. The TBA hepatic extraction was reduced with the high-fat drink. Basal and nutrient-induced gallbladder emptying rates were altered by type 2 diabetes (T2D). The model was predictive of the central trend and the variability of gallbladder volume and TBA plasma concentration for all test drinks. Integration of this model within physiological pharmacokinetic modeling frameworks could improve the predictions for lipophilic compounds' absorption considerably.


Figures

Figure 1
Figure 1
Postprandial mean gallbladder volumes (top) and total plasma bile acid concentrations (bottom) in response to the intake (vertical line) of a 75‐g oral glucose tolerance test (OGTT) and three isocaloric (500 kcal), isovolemic (350 ml) test drinks with low (2.5 g fat, 107 g carbohydrate, 13 g protein), medium (10 g fat, 93 g carbohydrate, 11 g protein), and high (40 g fat, 32 g carbohydrate, 3 g protein) fat content (colors) in 15 healthy subjects (left) and 15 patients with type 2 diabetes (right). Error bars represent the standard error of the mean.
Figure 2
Figure 2
Composition (top) and conjugation (bottom) of the mean plasma concentration of total bile acids vs. time for each of the four test drinks in healthy subjects. The vertical lines represent the time of the test drink intake. CA, cholic acid; CDCA, chenodeoxycholic acid; DCA, deoxycholic acid; OGTT, oral glucose tolerance test; UDCA, ursodeoxycholic acid.
Figure 3
Figure 3
Schematic representation of the developed model. Test drinks were administered into the stomach. The gastric emptying rate constant (K G) was inhibited by calories in the upper small intestine. K UL was the rate constant of calories disappearance from the upper small intestine (SI), and K DJ from the duodenum. Nutrients (i.e., fats, proteins, and carbohydrates) and calories were also nonlinearly absorbed, RA MAX describing the maximal rate and K M the potency of their absorption. The gallbladder release rate constant (K RB) was stimulated by a signal of the fat equivalent amount in the duodenum (efatduod). The gallbladder had refilling periods starting at the onset (T refill_onset) and for a duration determined by T refill_duration. The steepness of the onset and offset were determined by the refilling slope (Sloperefill). Once released from the gallbladder, total bile acids (TBAs) were either absorbed in the upper small intestine at the rate K A,U or transited toward the lower small intestine at the rate K TUL. K A,L mediated the lower small intestine transit and the absorption rate constant of bile acids. Upon arrival to the liver, the TBAs were extracted back to the gallbladder against the concentration gradient (C H/C GB). The fraction escaping the hepatic extraction (F H) spilled to the plasmatic and peripheral compartments. The Q H and Q D, respectively, represented the hepatic blood flow and the distribution clearance. The rate constant of transit from the lower small intestine to the colon (K TLC) and the liver TBA production rate (R TBA) were assumed to compensate each other in the model and were herein represented for illustration purpose only. Magnifying glasses indicate variables that were simultaneously modeled: gallbladder volume and TBA plasma concentrations.
Figure 4
Figure 4
Visual predictive checks of the gallbladder volume (top) and total bile acids plasma concentration (bottom) time‐courses for each of the four test drinks. The vertical lines represent the time of the test drink intake. OGTT, oral glucose tolerance test. Shaded areas represent the 95% confidence interval around the specified percentiles, based on 1,000 simulations.
Figure 5
Figure 5
Model‐based simulations of gallbladder volume (top) and total bile acids plasma concentration (bottom) time‐course for each of the four test drinks. For each panel, different prediction intervals (shaded areas) and the median (solid lines) were calculated based on 1,000 model simulations for a typical individual (i.e., non‐diabetic, sex: male, weight: 70 kg, height; 1.7 m, and age: 64 years old). The vertical lines represent the time of the test drink intake. OGTT, oral glucose tolerance test.

References

    1. Stamp, D. & Jenkins, G. . An overview of bile‐acid synthesis, chemistry and function In Bile Acids: Toxicology and Bioactivity (eds. Jenkins G. & Hardie L.J.) 1–13 (Royal Society of Chemistry, United Kingdom, 2008). 10.1039/9781847558336-00001 - DOI
    1. Hofmann, A.F. Enterohepatic circulation of bile acids. Compr. Physiol. 19, 567–596 (2011).
    1. Behar, J. Physiology and pathophysiology of the biliary tract: the gallbladder and sphincter of Oddi—a review. ISRN Physiol. 2013, 1–15 (2013).
    1. Froehlich, F. , Gonvers, J.J. & Fried, M. Role of nutrient fat and cholecystokinin in regulation of gallbladder emptying in man. Dig. Dis. Sci. 40, 529–533 (1995). - PubMed
    1. Angelin, B. , Einarsson, K. & Hellström, K. Evidence for the absorption of bile acids in the proximal small intestine of normo‐ and hyperlipidaemic subjects. Gut 17, 420–425 (1976). - PMC - PubMed

Publication types

Substances

LinkOut - more resources