. 2019 Mar 1;144(5):1037-1048.
doi: 10.1002/ijc.31781. Epub 2018 Sep 29.

Inhibiting homologous recombination decreases extrachromosomal amplification but has no effect on intrachromosomal amplification in methotrexate-resistant colon cancer cells

Affiliations

Inhibiting homologous recombination decreases extrachromosomal amplification but has no effect on intrachromosomal amplification in methotrexate-resistant colon cancer cells

Mengdi Cai et al. Int J Cancer. .

Abstract

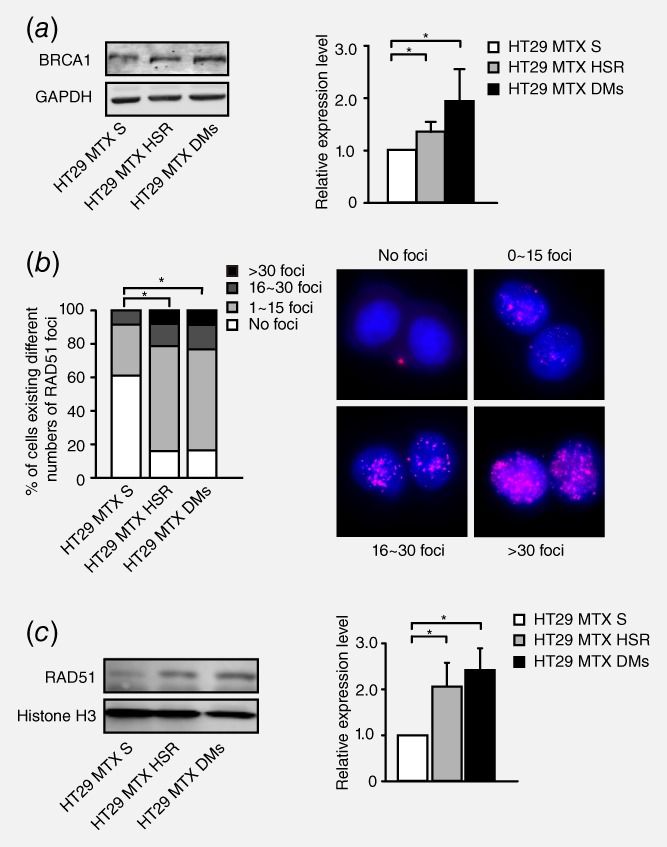
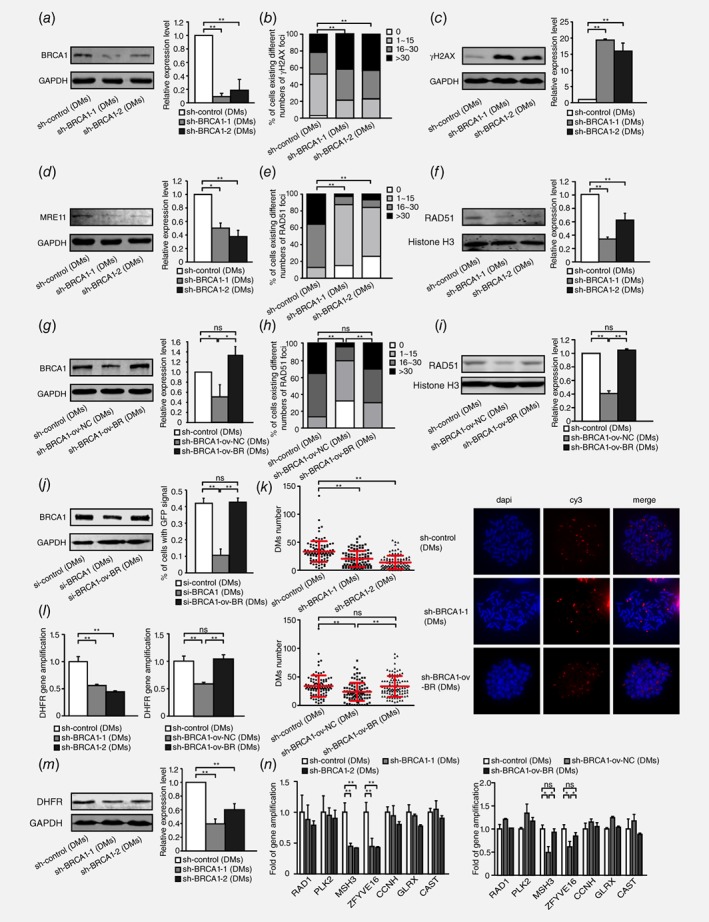
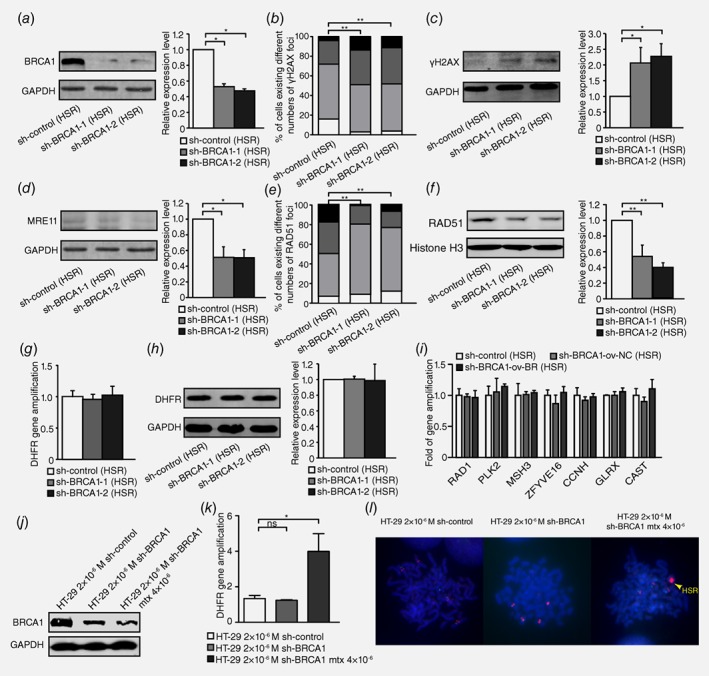
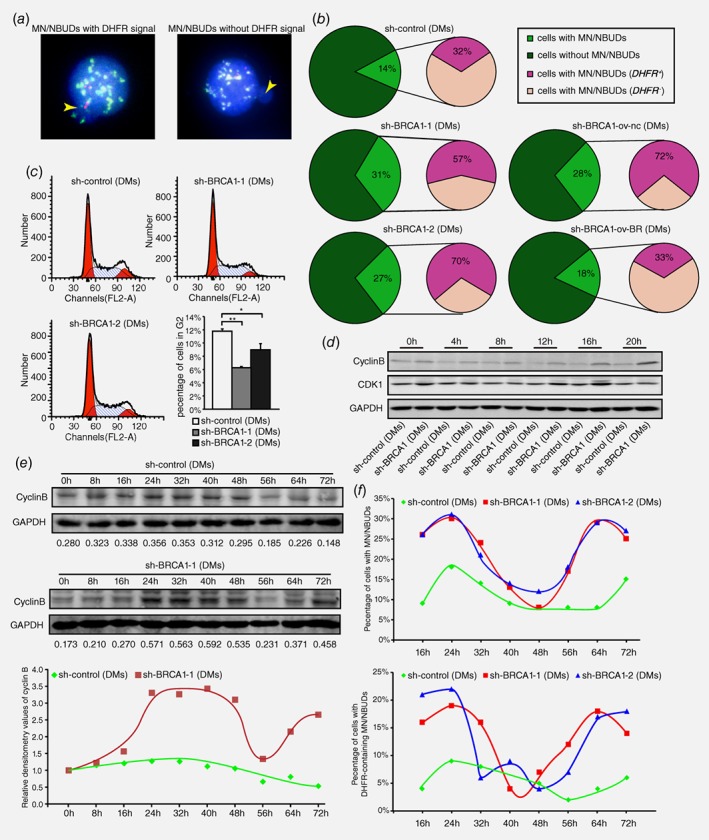
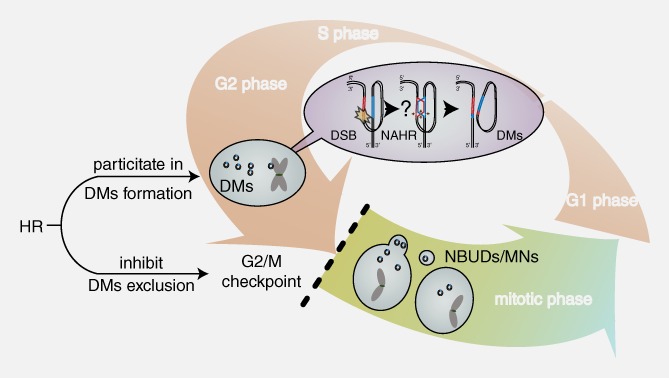
Gene amplification, which involves the two major topographical structures double minutes (DMs) and homegeneously stained region (HSR), is a common mechanism of treatment resistance in cancer and is initiated by DNA double-strand breaks. NHEJ, one of DSB repair pathways, is involved in gene amplification as we demonstrated previously. However, the involvement of homologous recombination, another DSB repair pathway, in gene amplification remains to be explored. To better understand the association between HR and gene amplification, we detected HR activity in DM- and HSR-containing MTX-resistant HT-29 colon cancer cells. In DM-containing MTX-resistant cells, we found increased homologous recombination activity compared with that in MTX-sensitive cells. Therefore, we suppressed HR activity by silencing BRCA1, the key player in the HR pathway. The attenuation of HR activity decreased the numbers of DMs and DM-form amplified gene copies and increased the exclusion of micronuclei and nuclear buds that contained DM-form amplification; these changes were accompanied by cell cycle acceleration and increased MTX sensitivity. In contrast, BRCA1 silencing did not influence the number of amplified genes and MTX sensitivity in HSR-containing MTX-resistant cells. In conclusion, our results suggest that the HR pathway plays different roles in extrachromosomal and intrachromosomal gene amplification and may be a new target to improve chemotherapeutic outcome by decreasing extrachromosomal amplification in cancer.

Keywords: DMs; HR; HSR; MTX; gene amplification.


Figures

Figure 1
Figure 1
Correlation between the level of HR and gene amplification in HT29 MTX‐sensitive and MTX‐resistant cells. a. Western blot analysis of the BRCA1 protein level in HT29 MTX‐sensitive cells and HSR‐ and DM‐containing MTX‐resistant cells. The right panel shows densitometry values. Protein densities are normalized to the GAPDH expression level, and the BRCA1 expression levels of HSR‐ or DM‐containing cells are compared with that of MTX‐sensitive cells. Values are mean ±SD (n = 3, *p<0.025). b. Immunofluorescence assay for RAD51 foci in HT29 MTX‐sensitive, HSR‐ and DM‐containing cells. Cells are grouped into four categories according to the number of RAD51 foci: no foci, 1–15 foci, 16–30 foci and >30 foci. Group standards are shown in the right panel. The left panel shows the proportion of these cells in each category (n>75, *p<0.025). c. Western blot analysis of RAD51 nuclear protein levels in HT29 MTX‐sensitive, HSR‐containing and DM‐containing MTX‐resistant cells. The right panel shows densitometry values (n = 3, *p<0.025).
Figure 2
Figure 2
Inhibition of BRCA1 exacerbates double‐strand DNA breaks, suppresses HR and decreases DM‐form amplification in DM‐containing MTX‐resistant cells. a. Western blot analysis of BRCA1 protein levels and densitometry values in DM‐containing cells: control and two BRCA1‐depleted clones (n = 3, **p<0.005). b. IF assay for γH2AX protein in DM‐containing control and two BRCA1‐depleted clones (n ≥ 100, **p<0.005). c. Western blot bands for the γH2AX protein level, densitometry values in DM‐containing control and two BRCA1‐depleted clones (n = 3, **p<0.005). d. Western blot analysis of MRE11 protein level and densitometry values in DM‐containing control and two BRCA1‐depleted clones (n = 3, *p<0.025, **p<0.005). e. IF assay for RAD51 foci in DM‐containing control and two BRCA1‐depleted clones (n ≥ 100, **p<0.005). f. Western blot analysis of RAD51 nuclear protein levels and densitometry values in DM‐containing control and two BRCA1‐depleted clones (n = 3, **p<0.005). g. Western blot analysis of BRCA1 protein level and densitometry values in DM‐containing control, BRCA1‐depleted control and BRCA1‐depleted rescued cells (n = 3, *p<0.025). h. IF assay for RAD51 foci in DM‐containing control, BRCA1‐depleted control and BRCA1‐depleted rescued cells (n ≥ 100, **p<0.005). i. Western blot analysis of RAD51 nuclear protein levels and densitometry values in DM‐containing control, BRCA1‐depleted control and BRCA1‐depleted rescued cells (n = 3, **p<0.005). j. Western blot analysis of BRCA1 protein level (left panel) and HR‐GFP repair assay of the percentage of GFP+ cells (right panel) in DM‐containing si‐control, si‐BRCA1 and si‐BRCA1 rescued cells (n = 3, **p<0.005). k. Quantification of DMs with DHFR signal in DM‐containing control and two BRCA1‐depleted clones(left upper panel), and control, BRCA1‐depleted control and BRCA1‐depleted rescued clones (left lower panel), on the basis of FISH analysis of metaphase spreads. Values are mean ±SD. BAC‐containing DHFR was used as a probe and is marked in red; nuclei were stained with DAPI and are marked in blue (right panel) (n ≥ 100, **p<0.005). l. Real‐time PCR analysis of DHFR amplification in DM‐containing control and two BRCA1‐depleted clones (left panel), and control, BRCA1‐depleted control and BRCA1‐depleted rescued clones (right panel) (n = 3, **p<0.005). m. Western blot analysis of DHFR protein level and densitometry values in DM‐containing control and two BRCA1‐depleted clones (n = 3, **p<0.005). n. Real‐time PCR analysis of other genes that co‐localized with DHFR in chromosome 5, including RAD1, PLK2, MSH3, ZFYVE16, CCNH, GLRX and CAST, in DM‐containing control and two BRCA1‐depleted clones (left panel), and control, BRCA1‐depleted control and BRCA1‐depleted rescued clones (right panel) (n = 3, *p<0.025, **p<0.005).
Figure 3
Figure 3
Inhibition of BRCA1 exacerbates double‐strand DNA breaks and suppresses HR but does not affect gene amplification in HSR‐containing MTX‐resistant cells. a. Western blot analysis of BRCA1 protein level and densitometry values in HSR‐containing cells: control and two BRCA1‐depleted clones (n = 3, *p<0.025). b. IF assay for γH2AX protein in HSR‐containing control and two BRCA1‐depleted clones (n ≥ 100, **p<0.005). c. Western blot for γH2AX protein level and densitometry values in HSR‐containing control and two BRCA1‐depleted clones (n = 3, *p<0.025). d. Western blot for MRE11 protein level and densitometry values in HSR‐containing control and two BRCA1‐depleted clones (n = 3, *p<0.025). e. IF assay for RAD51 in HSR‐containing control and two BRCA1‐depleted clones (n ≥ 100, **p<0.005). f. Western blot for RAD51 nuclear protein level and densitometry values in HSR‐containing control and two BRCA1‐depleted clones (n = 3, **p<0.005). g. Real‐time PCR analysis of DHFR amplification in HSR‐containing control and two BRCA1‐depleted clones (n = 3, p>0.025). h. Western blot analysis of DHFR protein level and densitometry values in HSR‐containing control and two BRCA1‐depleted clones (n = 3, p>0.025). i. Real‐time PCR analysis of other genes that co‐localized with DHFR in chromosome 5, including RAD1, PLK2, MSH3, ZFYVE16, CCNH, GLRX and CAST, in HSR‐containing control and two BRCA1‐depleted clones (n = 3, p>0.025). j. Western blot analysis of BRCA1 protein level in 2 × 10⁻⁶ M MTX‐resistant control, BRCA1‐depleted clone and sh‐BRCA1 clone adding 4 × 10⁻⁶ M MTX cells. k. Real‐time PCR analysis of DHFR amplification in 2 × 10⁻⁶ M MTX‐resistant control, BRCA1‐depleted clone and sh‐BRCA1 clone adding 4 × 10⁻⁶ M MTX cells (n = 3, *p<0.025). l. FISH analysis of HSR formation in 2 × 10⁻⁶ M MTX‐resistant control, BRCA1‐depleted clone and sh‐BRCA1 clone adding 4 × 10⁻⁶ M MTX cells. BAC‐containing DHFR was used as a probe and is marked in red; nuclei were stained with DAPI and are marked in blue. Yellow arrow points HSR.
Figure 4
Figure 4
HR inhibition results in G2/M abrogation and cell cycle acceleration accompanied by promoting the exclusion of DMs via MN/NBUDs. a. FISH analyses of MN/NBUDs in DM‐containing control and BRCA1‐depleted cells probed with BAC‐containing DHFR and the centromere of chromosome 5. The yellow arrow indicated the MN/NBUDs of nuclei. The MN/NBUDs were grouped into two categories: with DHFR signal (left panel) and without DHFR signal (right panel; DHFR in green; centromere of chromosome 5 in red; DAPI in blue). b. analyses of MN/NBUDs formation and exclusion of DHFR via MN/NBUDs in DM‐containing control, two BRCA1‐depleted clones, BRCA1‐depleted control and BRCA1‐depleted rescued clone. (**p < 0.005 for MN/NBUDs formation between control and two BRCA1‐depleted clones, n ≥ 100; **p < 0.005 for MN/NBUDs formation between BRCA1‐depleted control and BRCA1‐depleted rescued clone, n ≥ 100; *p < 0.025 for exclusion of DHFR via MN/NBUDs between control and two BRCA1‐depleted clones; *p < 0.025 for exclusion of DHFR via MN/NBUDs between BRCA1‐depleted control and BRCA1‐depleted rescued clone.) c. Flow assay analyses of cell cycle distribution in DM‐containing control and two BRCA1‐depleted clones. The left panel shows distributions of G1, S and G2 phases. The right panel shows both the G2 phase percentage and cell number of G2 phase for 3 repetitions. (*p < 0.025, **p < 0.005, by Chi‐squared test and Bonferroni adjustment) d. Western blot of cyclin B and CDK1 in DM‐containing control and BRCA1‐depleted cells harvested at different time points of releasing in complete culture (0 to 20 h) and then recorded once every 4 h. E. Western blot analyses of cyclin B in DM‐containing control and BRCA1‐depleted cells released at different time points of releasing in complete culture (0 to 72 h) and recorded once every 8 h. The numbers under the bands represent the relative densitometry values. The lower panel showed the trends of cyclin B expression in DM‐containing control and BRCA1‐depleted cells. f. Analyses of MN/NBUDs formation and exclusion of DHFR via MN/NBUDs in DM‐containing control and two BRCA1‐depleted clones harvested at different time points of releasing in complete culture (16 to 72 hr) and recorded once every 8 h.
Figure 5
Figure 5
The association between HR and DMs. HR may be involved in the formation of DMs and inhibit the exclusion of DMs by MN/NBUDs by activating the G2/M checkpoint and arresting the cell cycle. The pink‐white and yellow‐green gradient arrows represent the interphase and mitotic phase of the cell cycle, respectively. The purple gradient oval represents the potential mechanism by which HR is involved in DM formation. The black lines and small cycles represent DNA double strands and DMs, respectively. The question mark represents that the repair progression of NAHR is a speculation that the broken DNA may find a homologous region on its own chromosome as a template and form double minutes simultaneously. The red and blue regions on DNA strands represent amplified homologous regions. The brown arrows represent the resecting and reconnecting sites of HR Holliday junctions. The black dashed line represents the activity of the G2/M checkpoint and cell cycle arrest.

References

    1. Turner KM, Deshpande V, Beyter D, et al. Extrachromosomal oncogene amplification drives tumour evolution and genetic heterogeneity. Nature 2017;543:122–5. - PMC - PubMed
    1. Mahon FX, Deininger MW, Schultheis B, et al. Selection and characterization of BCR‐ABL positive cell lines with differential sensitivity to the tyrosine kinase inhibitor STI571: diverse mechanisms of resistance. Blood 2000;96:1070–9. - PubMed
    1. Matheson EC, Hogarth LA, Case MC, et al. DHFR and MSH3 co‐amplification in childhood acute lymphoblastic leukaemia, in vitro and in vivo. Carcinogenesis 2007;28:1341–6. - PubMed
    1. Patch AM, Christie EL, Etemadmoghadam D, et al. Whole‐genome characterization of chemoresistant ovarian cancer. Nature 2015;521:489–94. - PubMed
    1. Storlazzi CT, Lonoce A, Guastadisegni MC, et al. Gene amplification as double minutes or homogeneously staining regions in solid tumors: origin and structure. Genome Res 2010;20:1198–206. - PMC - PubMed

Publication types