

doi: 10.1016/j.jaci.2018.07.011.
Epub 2018 Jul 30.
In vivo imaging reveals increased eosinophil uptake in the lungs of obese asthmatic patients
Affiliations
- PMID: 30071200
- PMCID: PMC6218663
- DOI: 10.1016/j.jaci.2018.07.011
Item in Clipboard
In vivo imaging reveals increased eosinophil uptake in the lungs of obese asthmatic patients
J Allergy Clin Immunol.
2018 Nov.
No abstract available
Figures

Early organ distribution and lung uptake of technetium-99m–labeled eosinophils. A, Participants in the scanning protocols. B, Time-course of radioactivity in the right lung following reinjection of technetium-99m–labeled eosinophils. C, Half-life of technetium-99m–labeled eosinophil activity in the lungs. Median with interquartile range (Mann-Whitney U test). D, Proportion of technetium-99m–labeled eosinophils remaining in the blood 45 minutes after reinjection. Median with interquartile range (Mann-Whitney U test). E, Gamma camera image 5 minutes (left) and 40 minutes (right) after reinjection of technetium-99m–labeled eosinophils in a healthy volunteer. Posterior images show accumulation in the right lung (RL), left lung (LL), liver (L), and spleen (S). F and G, Distribution of radioactivity in the liver (green) and spleen (black) following reinjection of technetium-99m–labeled eosinophils. Data show median with interquartile range in healthy volunteers (Fig 1, F) and patients with asthma (Fig 1, G); *P < .05, **P < .01, and ***P < .001 compared with peak liver or peak spleen radioactivity (Kruskal-Wallis with Dunn posttest). †P = .009 compared with healthy liver radioactivity at 17 minutes (Mann-Whitney U test). H, Transaxial SPECT images. Images show accumulation in the RL and LL (outlined by white lines) 6 hours after reinjection. Pulmonary uptake (I) and pulmonary migration (J) of technetium-99m–labeled eosinophils. Median with interquartile range (Mann-Whitney U test).
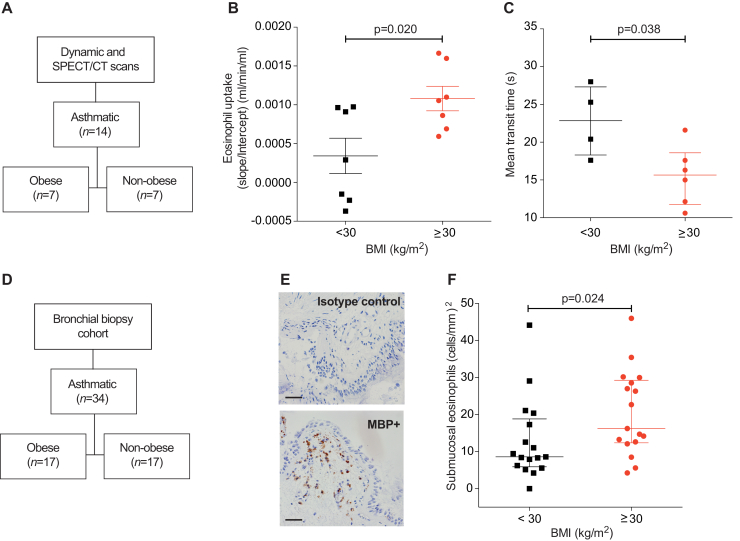
SPECT/CT quantification of pulmonary eosinophil uptake and bronchial biopsy eosinophil counts in obese and nonobese patients with asthma. A, Participants in the scanning cohort. B, Pulmonary eosinophil uptake of patients with asthma, stratified by body mass index as obese or nonobese. Mean ± SEM (unpaired Student t test). C, Transit time across the pulmonary circulation. Median with interquartile range of 10 subjects (Mann-Whitney U test). D, Participants in the bronchial biopsy cohort. E, Bronchial biopsy photomicrograph from an obese patient with asthma showing IgG1 control (top) and major basic protein (bottom)-stained eosinophils; scale bar indicates 50 μm. F, Quantification of bronchial submucosal eosinophil count from patients with asthma, stratified by body mass index. Median with interquartile range (Mann-Whitney U test). BMI, Body mass index.
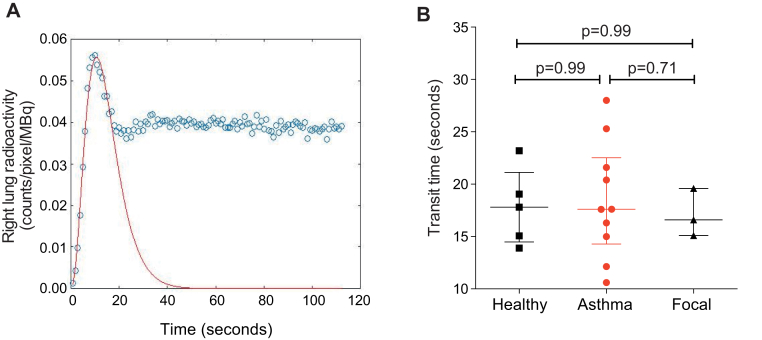
Technetium-99m–labeled eosinophil transit across the lung. A, Representative gamma variate function fitted to a time-activity curve. A gamma variate was fitted using a least squares residual method to simulate the first-pass time curve for eosinophils across the lung. Data from a single representative experiment (healthy control). B, Transit time for eosinophils to cross from the right ventricle into the pulmonary circulation for healthy volunteers, patients with asthma, and patients with focal eosinophilic inflammation. Data represent the median with interquartile range for 10 patients with asthma, 5 healthy volunteers, and 3 patients with focal pulmonary eosinophilic inflammation. P values calculated using Mann-Whitney U test.
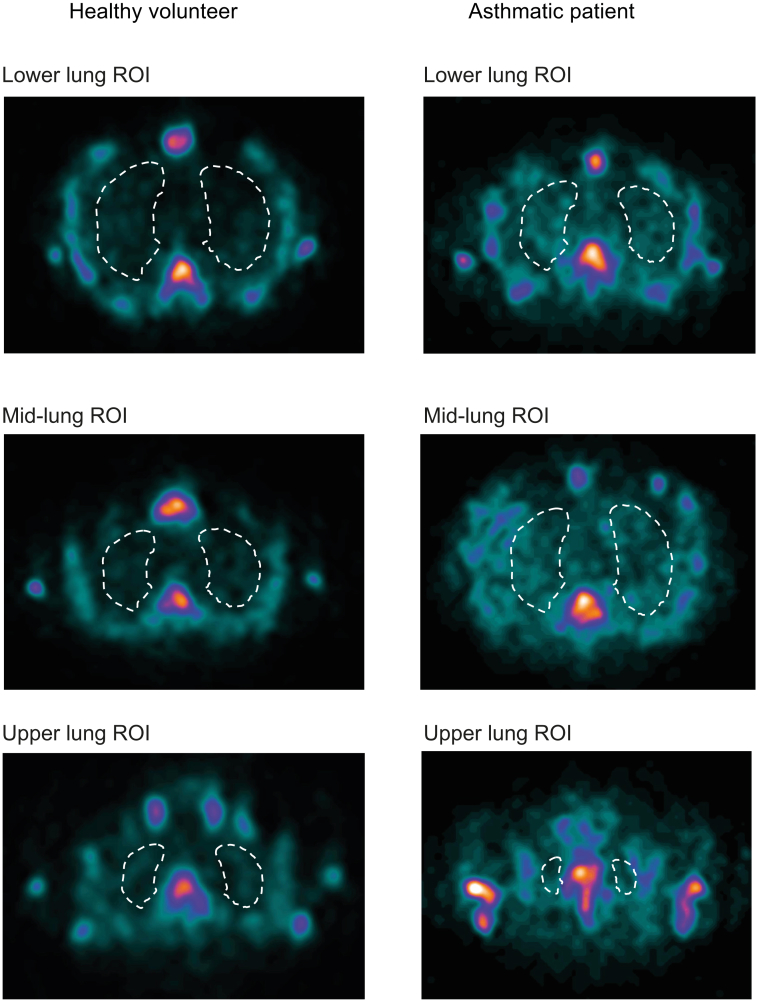
SPECT image analysis of the lung ROIs. Examples of SPECT images corresponding to lower, middle, and upper lung sections 6 hours after reinjection of technetium-99m–labeled eosinophils in a healthy volunteer (left panel) and a patient with asthma (right panel). White lines represent lung ROI. At each time point, ROIs were drawn from sections of lung images. Each lung section was 4.42 mm thick and, depending on the size of the lung, the total number of sections drawn ranged from 10 to 15 at the early time points (45 min after reinjection) to 15 to 30 at time points 6 hours and later. The first lung ROI was drawn from the base of the lung, which was always at least 4 sections above the liver/spleen to avoid any scatter from these organs. Sequential ROIs were then drawn up to the top of the lung. When drawing the ROI, care was taken to avoid the signal from the mediastinum and bone marrow (vertebra, sternum, and ribs). For consistency, the saturation of the scan was adjusted at each time point and for each volunteer such that the vertebral body color had changed from blue to yellow, and then to the first hint of white. This saturation was chosen because it gave the optimal contrast between the lung and thoracic bony skeleton. The counts from each lung section were summed and expressed as counts/voxel before Patlak-Rutland analysis.
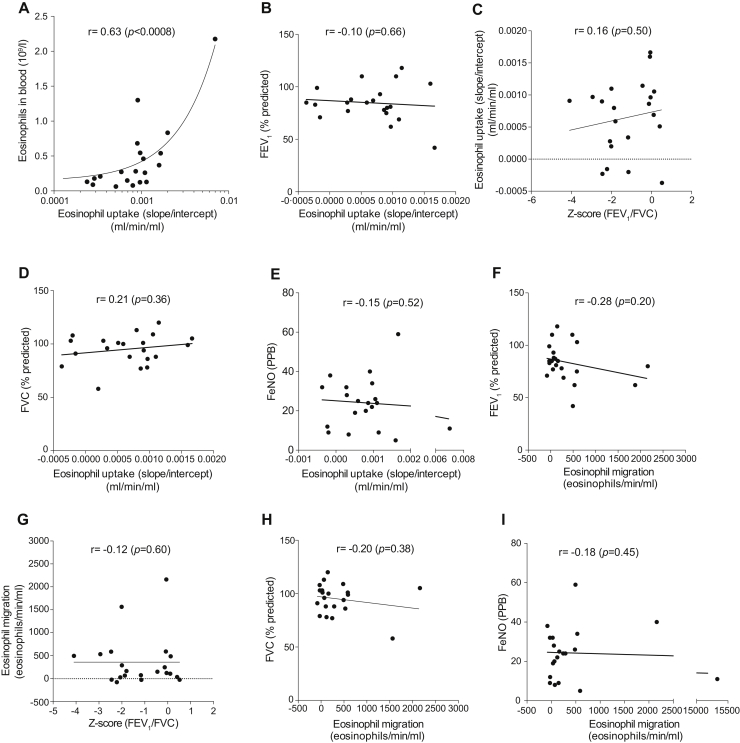
Correlations between radiolabeled eosinophil uptake or eosinophil migration into the lung with FEV1 (% predicted), FVC (% predicted), Feno , Z score (FEV1/FVC), and peripheral blood eosinophil count. Correlations between radiolabeled eosinophil uptake and (A) peripheral blood eosinophil count, (B) FEV1, (C)Z score (FEV1/FVC), (D) FVC (% predicted), and (E) Feno . Correlations between radiolabeled eosinophil eosinophil migration and (F) FEV1 (% predicted), (G) FEV1/FVC, (H) FVC (% predicted), and (I) Feno . FVC, forced vital capacity; PPB, parts per billion. Both Feno and spirometry results were available only for 22 of 26 subjects. P values calculated using Spearman correlation analysis (Fig E3, A and G) or Pearson correlation analysis (Fig E3, B-F and H-I).
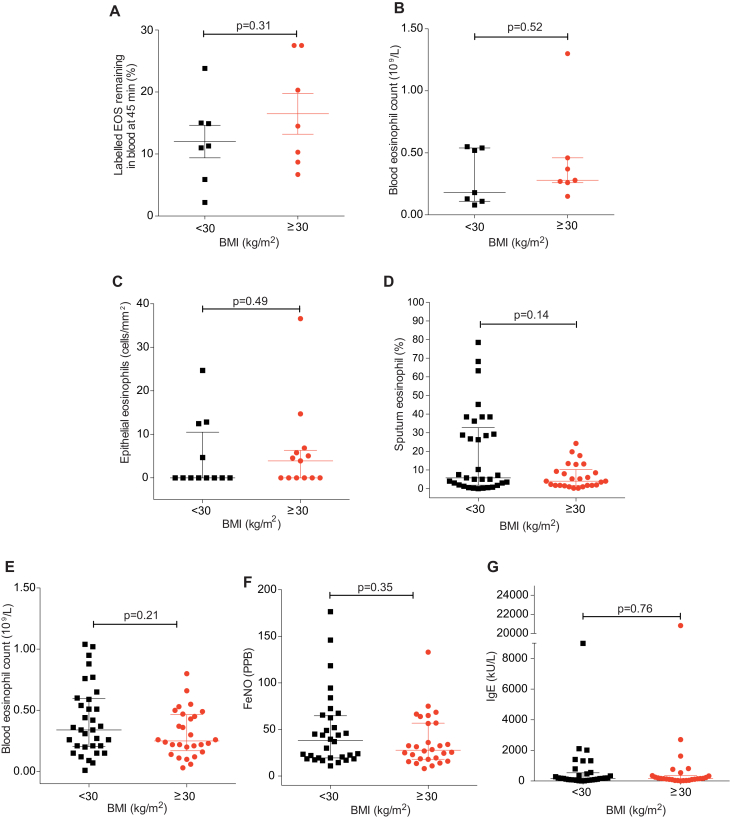
Comparison of 45-minute blood recovery values and peripheral blood eosinophil count in the obese and nonobese asthmatic SPECT/CT cohort, and peripheral blood eosinophil count, epithelial and sputum eosinophil numbers, peripheral eosinophil blood count, Feno levels, and IgE levels in the obese and nonobese asthmatic bronchial biopsy cohort. Subjects with asthma are classified by their body mass index (kg/m2) into nonobese (<30 kg/m2) and obese (≥30 kg/m2). A, Proportion of injected technetium-99m–labeled eosinophils remaining in the blood at 45 minutes after reinjection. Data represent the mean ± SEM of 7 experiments for nonobese patients with asthma and 7 experiments for obese patients with asthma. P values calculated using unpaired Student t test. B, Peripheral blood eosinophil counts in SPECT/CT subjects with asthma stratified by BMI as described above. Data represent the median with interquartile range of 7 subjects for nonobese patients with asthma and 7 subjects for obese patients with asthma. P values calculated using Mann-Whitney U test. (C) Epithelial eosinophil counts, (D) sputum eosinophil counts, (E) peripheral blood eosinophil counts, (F) Feno , and (G) IgE levels in the obese and nonobese bronchial biopsy cohort. Data represent the median with interquartile range of 12 to 33 subjects for nonobese patients with asthma and 13 to 28 subjects for obese patients with asthma. P values calculated using Mann-Whitney U test. BMI, Body mass index.
Comment in
-
Reply.J Allergy Clin Immunol. 2019 Mar;143(3):1265-1266. doi: 10.1016/j.jaci.2018.11.026. Epub 2019 Jan 11. J Allergy Clin Immunol. 2019. PMID: 30639067 No abstract available.
-
Increased eosinophil uptake in the lungs of obese patients with asthma-to correct for obesity compared to obese controls.J Allergy Clin Immunol. 2019 Mar;143(3):1265. doi: 10.1016/j.jaci.2018.11.025. Epub 2019 Jan 11. J Allergy Clin Immunol. 2019. PMID: 30639068 No abstract available.
References
-
- Ruparelia P., Szczepura K.R., Summers C., Solanki C.K., Balan K., Newbold P. Quantification of neutrophil migration into the lungs of patients with chronic obstructive pulmonary disease. Eur J Nucl Med Mol Imaging. 2011;38:911–919. - PubMed
-
- Farahi N., Singh N.R., Heard S., Loutsios C., Summers C., Solanki C.K. Use of 111-indium-labeled autologous eosinophils to establish the in vivo kinetics of human eosinophils in healthy subjects. Blood. 2012;120:4068–4071. - PubMed
Publication types
MeSH terms
Grants and funding
LinkOut - more resources
Full Text Sources
Other Literature Sources
Medical
