. 2018 Oct 1;150(10):1408-1420.
doi: 10.1085/jgp.201812082. Epub 2018 Aug 2.

Rapid constriction of the selectivity filter underlies C-type inactivation in the KcsA potassium channel

Affiliations

Rapid constriction of the selectivity filter underlies C-type inactivation in the KcsA potassium channel

Jing Li et al. J Gen Physiol. .

Abstract

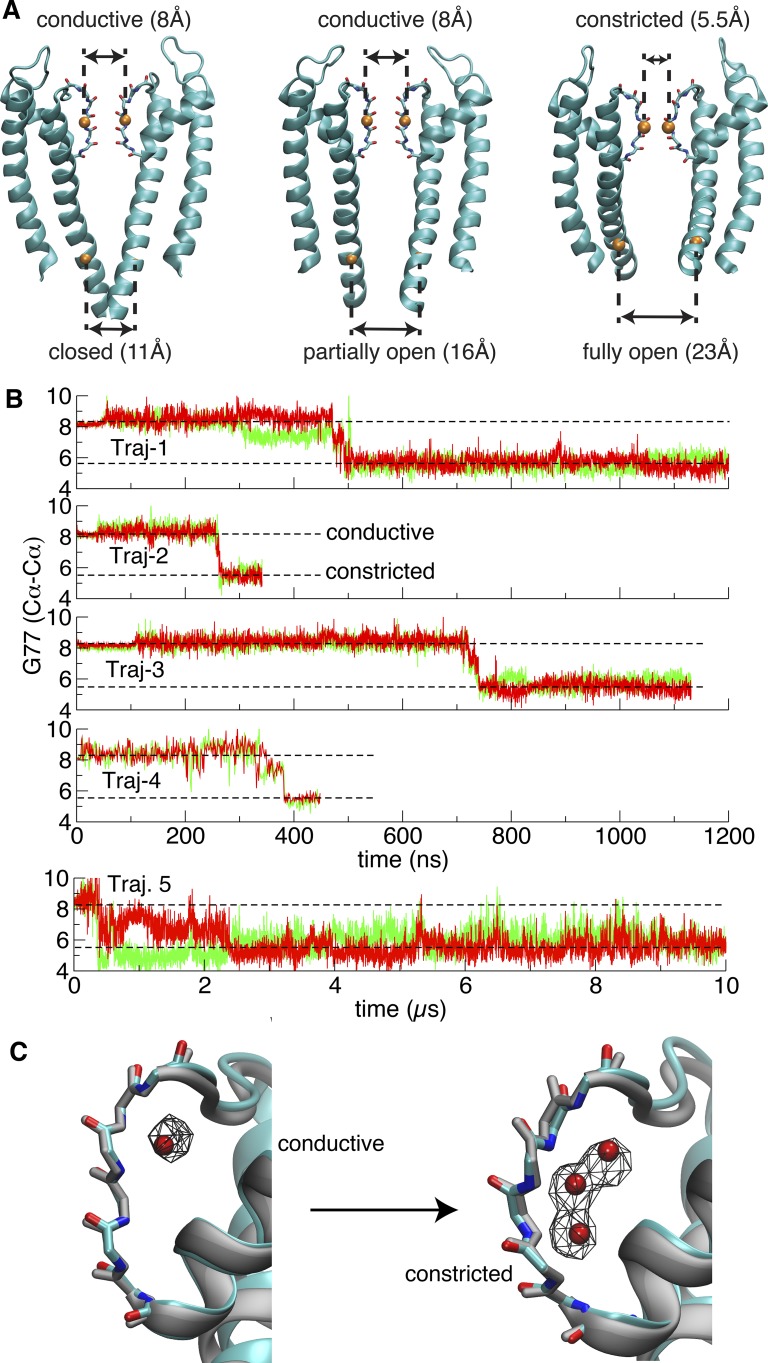
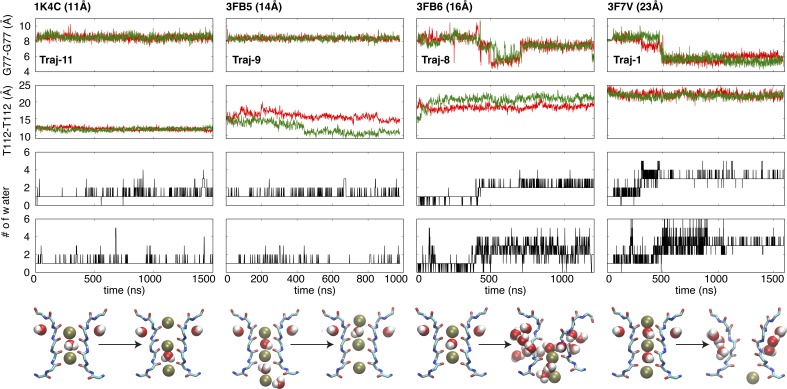
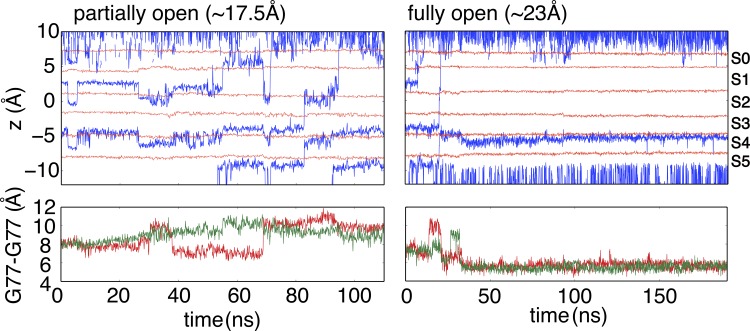
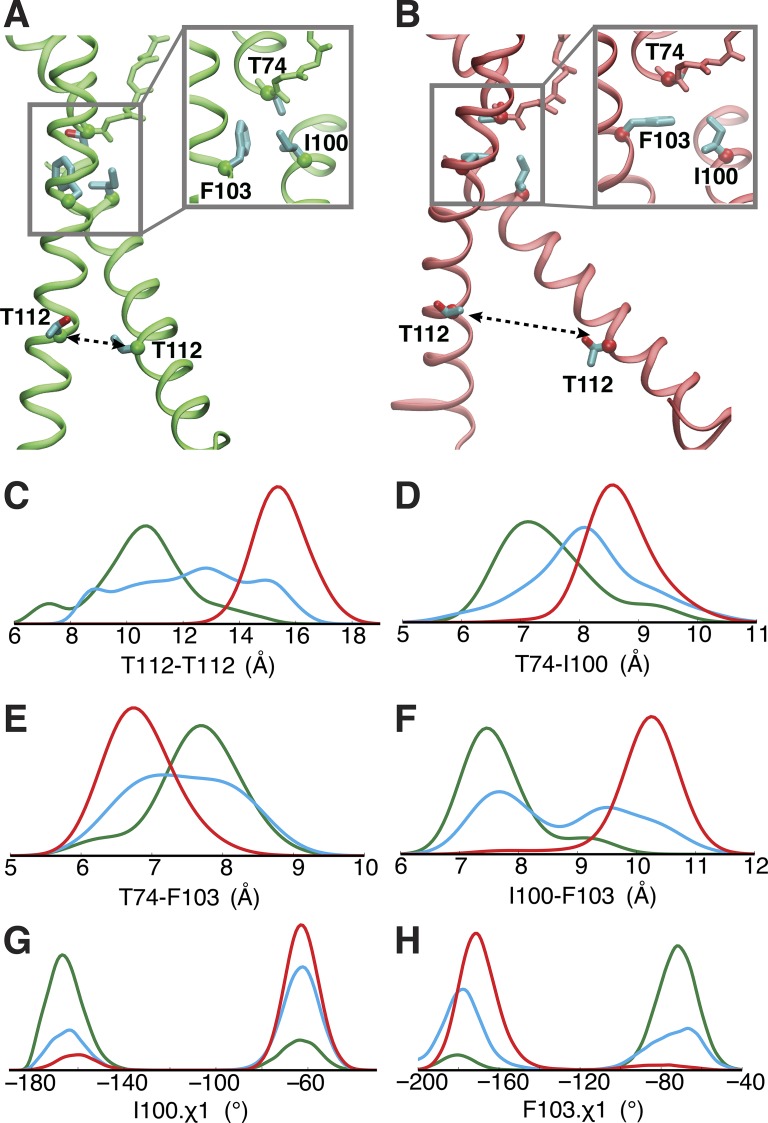
C-type inactivation is a time-dependent process observed in many K+ channels whereby prolonged activation by an external stimulus leads to a reduction in ionic conduction. While C-type inactivation is thought to be a result of a constriction of the selectivity filter, the local dynamics of the process remain elusive. Here, we use molecular dynamics (MD) simulations of the KcsA channel to elucidate the nature of kinetically delayed activation/inactivation gating coupling. Microsecond-scale MD simulations based on the truncated form of the KcsA channel (C-terminal domain deleted) provide a first glimpse of the onset of C-type inactivation. We observe over multiple trajectories that the selectivity filter consistently undergoes a spontaneous and rapid (within 1-2 µs) transition to a constricted conformation when the intracellular activation gate is fully open, but remains in the conductive conformation when the activation gate is closed or partially open. Multidimensional umbrella sampling potential of mean force calculations and nonequilibrium voltage-driven simulations further confirm these observations. Electrophysiological measurements show that the truncated form of the KcsA channel inactivates faster and greater than full-length KcsA, which is consistent with truncated KcsA opening to a greater degree because of the absence of the C-terminal domain restraint. Together, these results imply that the observed kinetics underlying activation/inactivation gating reflect a rapid conductive-to-constricted transition of the selectivity filter that is allosterically controlled by the slow opening of the intracellular gate.


Figures

Figure 1.
Figure 1.
The conformational indicators for the selectivity filter and the intracellular gate, and spontaneous constriction of the selectivity filter with fully open intracellular gate. (A) The selectivity filter and the intracellular gate with distinct opening degrees in major functional states. The orange spheres represent Cα atoms of Gly77 and Thr112. The opening of the selectivity filter and the intracellular gate are, respectively, measured by the cross-subunit distance between the Cα atoms of Gly77 or Thr112 from diagonally opposed monomers. (B) Time series of the cross-subunit distance between the Cα atoms of Gly77 of diagonally opposed monomers A and C (red), and B and D (green) for five simulations started from the fully open crystal structures (3F7V and 5VK6). Two levels representing conductive and constricted states are illustrated in dashed line (n.b., the trace of Traj-4 looks thinner because it was performed on Anton with frames saved less frequently). (C) Transition of the selectivity filter from a canonical conductive to a typical constricted conformation. Left: Overlay of a conductive snapshot (taken at 250 ns from Traj-1) with the x-ray structure 1K4C of the KcsA channel with a closed intracellular gate (gray). Right: Overlay of a constricted structure (taken from the last snapshot of Traj-1) with the x-ray structure 1K4D of the KcsA channel at low K+ with closed intracellular gate (gray). The red spheres indicate the position of the water oxygen in the crystal structures, and the wireframe represents the occupancy (50%) map of water molecules around the selectivity filter in either the conductive or constricted phase of Traj-1 with an open intracellular gate.
Figure 2.
Figure 2.
Ring-like hydrogen bonding network to stabilize the constricted structure. (A and B) Representative snapshot displaying this network formed by the buried water (van der Waals [vdW] representation) at the “bottom” site, Gly77 amide, and the carbonyl oxygen of Val76 from four subunits (stick representation), from bottom view (A), and side view (B).
Figure 3.
Figure 3.
The differentially conformational and dynamic behaviors of the selectivity filter of KcsA with various opening degrees of the intracellular gate. Time series of the cross-subunit distance between the Cα atoms of Gly77 (first panel) or Thr112 (second panel) of diagonally opposed monomers A and C (red), and B and D (green), and the number of water behind the selectivity filter within subunit A (third panel) and B (fourth panel). Fifth panel: The first and last snapshots for the selectivity filter of corresponding trajectories. The backbone and the selectivity filter are represented as stick model, and both of ions and water molecules are in vdW representation. Only two opposite monomers are shown for clarity. Although multiple simulations have been performed as shown in the Table 1, here only a typical trajectory is selected from the same crystal structure, i.e., 1K4C (Traj-11), 3FB5 (Traj-9), 3FB6 (Traj-8), and 3F7V (Traj-1). In all cases, the K+ concentration (0.15 or 0.2 M) is very similar to physiological condition.
Figure 4.
Figure 4.
2D-PMF to assess the conformational preferences of the selectivity filter with partially and fully open intracellular gate. The horizontal reaction coordinate r describes the width of the selectivity filter and is defined as the average cross-subunit pinching distance between the Cα atoms of Gly77. The vertical reaction coordinate z indicates the position of the external K+ ion along the z axis relative to the center of the selectivity filter. The lower panel is the one-dimensional PMF along horizontal reaction coordinate r, with integration of the vertical reaction coordinate z. The typical conformations (left) for three free energy basin are shown in stick for protein and vdW representation for both water and K+ ion.
Figure 5.
Figure 5.
Permeability of partially and fully open structures in the presence of external voltage (300 mV) and high K+ ion concentration (1 M). Top: Traces of K+ ions (blue) are shown through the selectivity filter, and the average z coordinates of carbonyl oxygens of G79, Y78, G77, V76, and T75, and hydroxyl oxygen of T75 are respectively shown in red lines to indicate the position of K+ binding sites. Bottom: Time series of the cross-subunit distance between the Cα atoms of Gly77 of diagonally opposed monomers. These simulations reveal that both the selectivity filter and intracellular gate are permeable for K+ ions in a partially open structure, whereas the filter constricts (RMSD drops to 0.6 Å using 1K4D selectivity filter backbone as reference) in a fully open structure.
Figure 6.
Figure 6.
Correlation between inner gate opening and local conformational rearrangement of Phe103, Ile100, and Thr74. (A and B) Critical conformational difference between partially (A) and fully (B) open structure for the transmembrane helices and the selectivity filter. (C–H) Probability densities of three ensembles, respectively, were determined by combining several trajectories started from three crystal structures, i.e., two trajectories (Traj-9 and -10) started from 3FB5 (green), three trajectories (Traj-6–8) from 3FB6 (blue), and four trajectories (Traj-1–4) from 3F7V (red), to represent the opening degrees from partially to fully open of the inner gate. The probability density functions of these Cα-atom distances and rotamers were estimated by using kernel density estimation based on the sample distributions. In C, D, and F, the histograms correspond to the distances, i.e., T112-T112, T74-I100, and I100-F103, between adjacent subunits (as opposed to diagonally opposed cross-subunit distance discussed used elsewhere) because they yield a clearer picture for the allosteric coupling due to the key inter-subunit contacts from adjacent subunits.
Figure 7.
Figure 7.
Impact of KcsA activation gate opening in the absence/presence of the C-terminal domain on the degree of C-type inactivation. Representative macroscopic current recordings elicited in response to switching the intracellular pH from 8.0 to pH 3.0 for the C-terminal–truncated (black trace) and full-length (red trace) KcsA. Inset: The time constant for C-type inactivation was obtained from single exponential fits of several independent macroscopic current recordings for the full-length (n = 28) and for the truncated form of KcsA (n = 38). The reported values are an average of the number (n) of independent experiments with the standard deviation (SD).
Figure 8.
Figure 8.
Schematic depiction of functional cycle of KcsA, and hypothetic free energy profile along activation/inactivation gating reaction coordinate. (A) Schematic depiction of the six dominant structural states. The thickness of horizontal arrows indicates the transition probability along the direction, whereas the thickness of vertical arrows is the same as the transition probability and is dependent on external stimulus. (B) Hypothetic free energy profile along activation/inactivation gating reaction coordinate in the presence of external stimulus, such as pH changing, for gate opening.

Comment in

References

    1. Aldrich R.W. Jr., Getting P.A., and Thompson S.H.. 1979. Mechanism of frequency-dependent broadening of molluscan neurone soma spikes. J. Physiol. 291:531–544. 10.1113/jphysiol.1979.sp012829 - DOI - PMC - PubMed
    1. Baker K.A., Tzitzilonis C., Kwiatkowski W., Choe S., and Riek R.. 2007. Conformational dynamics of the KcsA potassium channel governs gating properties. Nat. Struct. Mol. Biol. 14:1089–1095. 10.1038/nsmb1311 - DOI - PMC - PubMed
    1. Beglov D., and Roux B.. 1994. Finite representation of an infinite bulk system: Solvent Boundary Potential for Computer Simulations. J. Chem. Phys. 100:9050–9063. 10.1063/1.466711 - DOI
    1. Bernèche S., and Roux B.. 2001. Energetics of ion conduction through the K+ channel. Nature. 414:73–77. 10.1038/35102067 - DOI - PubMed
    1. Best R.B., Zhu X., Shim J., Lopes P.E., Mittal J., Feig M., and Mackerell A.D. Jr. 2012. Optimization of the additive CHARMM all-atom protein force field targeting improved sampling of the backbone φ, ψ and side-chain χ(1) and χ(2) dihedral angles. J. Chem. Theory Comput. 8:3257–3273. 10.1021/ct300400x - DOI - PMC - PubMed

Publication types

MeSH terms

LinkOut - more resources