Clinical Trial
. 2018 Sep 3;215(9):2311-2324.
doi: 10.1084/jem.20180936. Epub 2018 Aug 2.

Relationship between latent and rebound viruses in a clinical trial of anti-HIV-1 antibody 3BNC117

Affiliations
Clinical Trial

Relationship between latent and rebound viruses in a clinical trial of anti-HIV-1 antibody 3BNC117

Yehuda Z Cohen et al. J Exp Med. .

Abstract

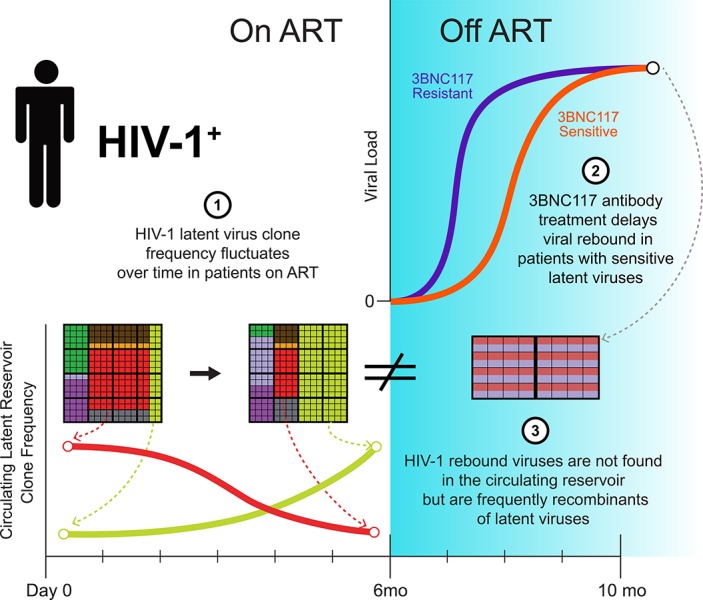
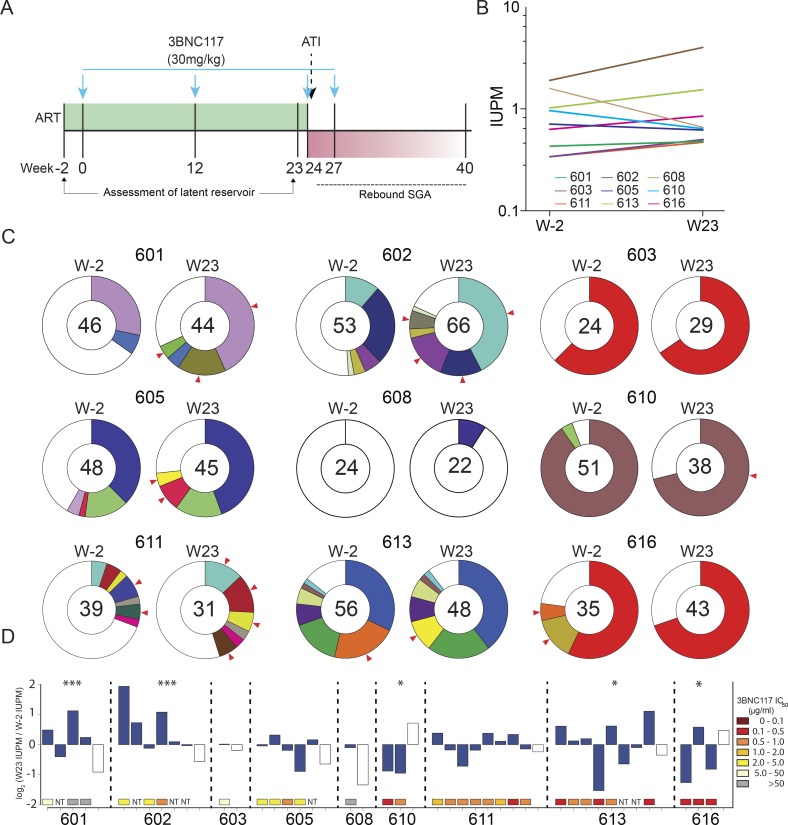
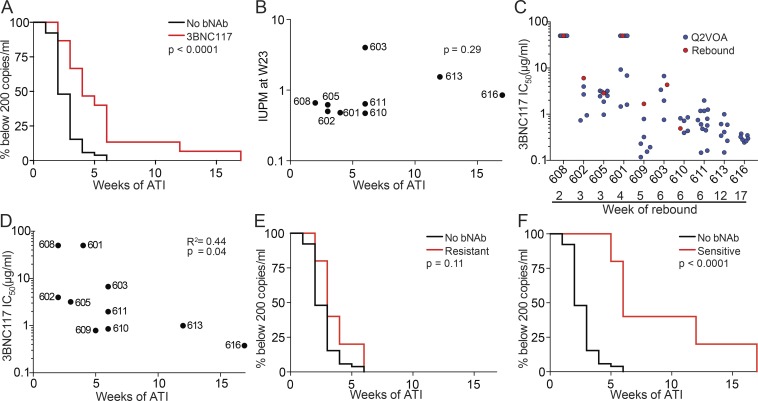
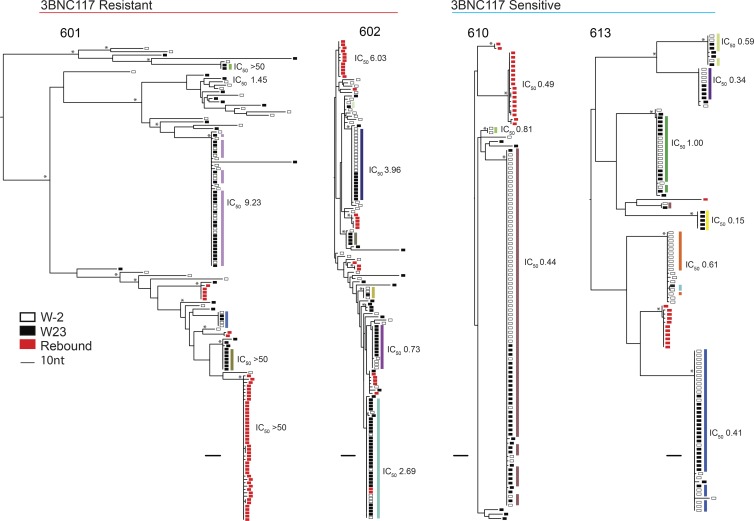
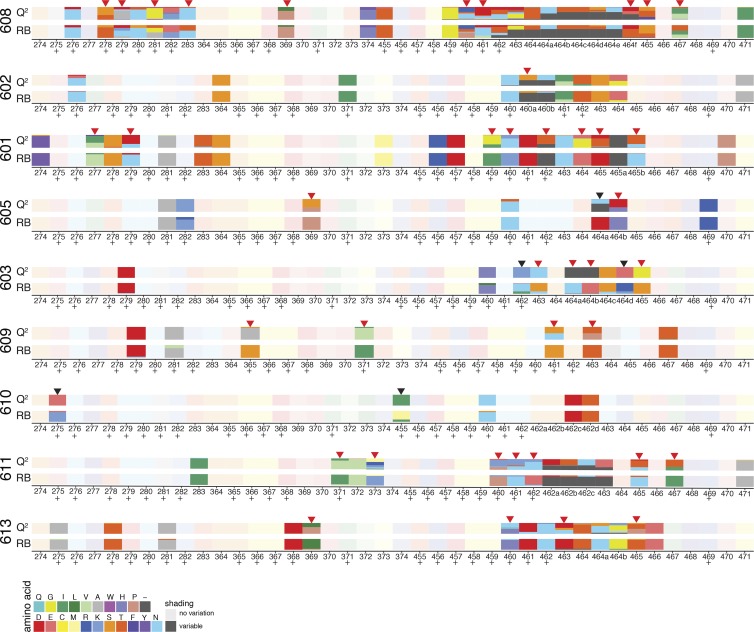
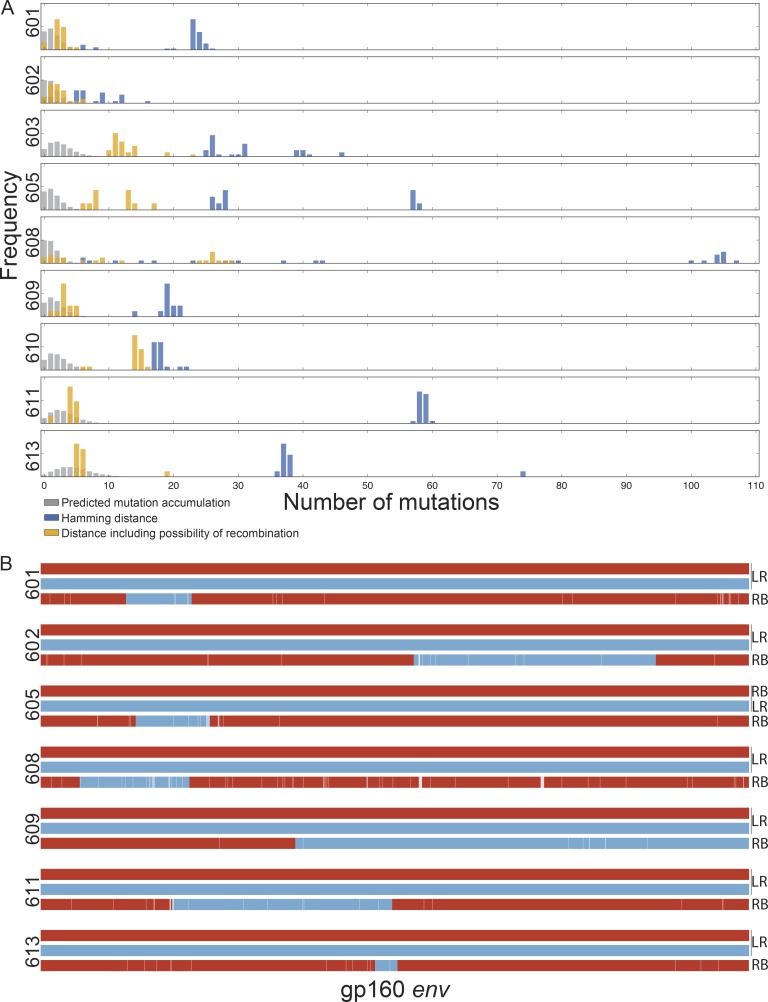
A clinical trial was performed to evaluate 3BNC117, a potent anti-HIV-1 antibody, in infected individuals during suppressive antiretroviral therapy and subsequent analytical treatment interruption (ATI). The circulating reservoir was evaluated by quantitative and qualitative viral outgrowth assay (Q2VOA) at entry and after 6 mo. There were no significant quantitative changes in the size of the reservoir before ATI, and the composition of circulating reservoir clones varied in a manner that did not correlate with 3BNC117 sensitivity. 3BNC117 binding site amino acid variants found in rebound viruses preexisted in the latent reservoir. However, only 3 of 217 rebound viruses were identical to 868 latent viruses isolated by Q2VOA and near full-length sequencing. Instead, 63% of the rebound viruses appeared to be recombinants, even in individuals with 3BNC117-resistant reservoir viruses. In conclusion, viruses emerging during ATI in individuals treated with 3BNC117 are not the dominant species found in the circulating latent reservoir, but frequently appear to represent recombinants of latent viruses.


Figures

None
Graphical abstract
Figure 1.
Figure 1.
Changes in the circulating latent reservoir before treatment interruption. (A) Study design; blue arrows represent 3BNC117 infusions. (B) Change in IUPM of HIV-1 between week −2 and week 23, as determined by Q2VOA. There were no significant changes in IUPM between these two time points for any participant (defined by a more than sixfold change; Crooks et al., 2015). (C) Pie charts depicting the distribution of culture-derived env sequences from the two time points. The number in the inner circle indicates the total number of env sequences analyzed. White represents sequences isolated only once across both time points (singles), and colored areas represent identical sequences that appear more than once (clones). The size of the pie slice is proportional to the size of the clone. Red arrows denote clones that change in size between the two time points. These data include a second set of independent experiments that were performed for five participants to confirm reproducibility (Fig. S3). (D) Fluctuations within the latent reservoirs of each participant. Changes are measured in log2 fold change of IUPM between week −2 and week 23. Full bars represent clones, and empty bars represent all singles as one group. P values from Fisher’s exact test (two-sided) are shown for participants with significant changes between the two time points. ***, P < 0.001; *, P < 0.05. Colored boxes below each bar represent the 3BNC117 IC50 titer of the particular clone. NT, not tested.
Figure 2.
Figure 2.
Time to rebound following treatment interruption. (A) Kaplan–Meier plot comparing viral rebound in 52 historical controls who underwent ATI without antibody treatment (black), and the 15 participants (red) who underwent ATI with 3BNC117 infusions. Y axis indicates percentage of participants with viral loads below 200 RNA copies/ml, x axis indicates weeks after ATI. The P value is based on the log-rank test (two-sided). (B) Dot plot representing the relationship between IUPM at week 23 and time to rebound for all participants for whom Q2VOA was performed. The P value was calculated using the Spearman correlation (two sided). (C) Dot plot representing the 3BNC117 sensitivities of latent and rebound viruses. Q2VOA-derived latent viruses are shown as blue circles, and culture-derived rebound viruses as red circles. Culture-derived rebound viruses could not be obtained from participants 611, 613, and 616. (D) Dot plot representing the correlation between 3BNC117 sensitivity of the most resistant virus isolated by Q2VOA and week of rebound. The P value was calculated using the Spearman correlation (two-sided). (E) Kaplan–Meier plot comparing viral rebound in 52 historical controls (black), and five participants (red) whose latent reservoirs were found to contain viruses resistant to 3BNC117 (IC50 > 2.0 µg/ml) by Q2VOA. (F) Kaplan–Meier plot comparing viral rebound in 52 historical controls (black), and five participants (red) whose latent reservoirs were found to only contain viruses sensitive to 3BNC117 (IC50 ≤ 2.0 µg/ml) by Q2VOA.
Figure 3.
Figure 3.
Phylogenetic trees of latent and rebound env sequences. Maximum likelihood phylogenetic trees of env sequences of viruses isolated from Q2VOA outgrowth cultures and rebound SGA. Four participants with varying 3BNC117 sensitivity, clonal structure, and diversity are shown. Participants are categorized as 3BNC117 resistant or sensitive based on the presence of any resistant (IC50 > 2.0 µg/ml) viruses within the reservoir. Q2VOA-derived viruses from week −2 are represented as empty black rectangles; viruses from week 23 as full black rectangles; and rebound SGA viruses as red rectangles. Asterisks indicate nodes with significant bootstrap values (bootstrap support ≥90%). Clones are denoted by colored rectangles beside the phylogenetic tree. These colors correspond to colors in the pie charts in Fig. 1 C. Numbers represent 3BNC117 IC50 neutralization titers. For rebound viruses, neutralization values shown were determined from culture-derived viruses that were identical or highly similar to the particular SGA viruses.
Figure 4.
Figure 4.
Amino acid variants at 3BNC117 binding sites in latent and rebound viruses. Chart illustrates amino acid changes in and around known 3BNC117 contact residues in Env (amino acid positions 274–283, 364–374, and 455–471), according to HXB2 numbering. Plus symbols represent 3BNC117 contact sites confirmed by crystal structures. Q2 indicates latent viruses isolated by Q2VOA, and RB represents rebound viruses isolated by SGA. Each amino acid is represented by a color, and the frequency of each amino acid is indicated by the height of the rectangle. Red arrows represent instances in which an amino acid found at low frequency in latent viruses became a majority amino acid in rebound viruses, and black arrows represent instances in which a majority rebound virus amino acid variant was not found among latent viruses.
Figure 5.
Figure 5.
Relationship between latent and rebound sequences. (A) Histograms show the percentage of env sequences (y axis) and nucleotide distance (x axis). The blue bars represent the observed Hamming distance between rebound and latent viruses. The gray bars represent the predicted distance between rebound and latent viruses based on a simulation of mutation accumulation during the ATI period for each participant. The yellow bars represent the minimal possible distance between the rebound and latent viruses including the possibility of recombination. (B) Examples of putative recombination events. Parent env sequences are represented in red or blue and child sequences in combined red and blue. LR denotes latent reservoir sequences, and RB denotes rebound sequences. The recombination breakpoints shown are the midpoints of the ranges determined by the 3SEQ algorithm (Table S8). White lines represent point mutations unique to the child sequence. Parent and child sequences shown here are marked with green and red stars, respectively, in the phylogenetic trees in Dataset S3.

References

    1. Abram M.E., Ferris A.L., Shao W., Alvord W.G., and Hughes S.H.. 2010. Nature, position, and frequency of mutations made in a single cycle of HIV-1 replication. J. Virol. 84:9864–9878. 10.1128/JVI.00915-10 - DOI - PMC - PubMed
    1. Bar K.J., Sneller M.C., Harrison L.J., Justement J.S., Overton E.T., Petrone M.E., Salantes D.B., Seamon C.A., Scheinfeld B., Kwan R.W., et al. . 2016. Effect of HIV antibody VRC01 on viral rebound after treatment interruption. N. Engl. J. Med. 375:2037–2050. 10.1056/NEJMoa1608243 - DOI - PMC - PubMed
    1. Barouch D.H., Whitney J.B., Moldt B., Klein F., Oliveira T.Y., Liu J., Stephenson K.E., Chang H.W., Shekhar K., Gupta S., et al. . 2013. Therapeutic efficacy of potent neutralizing HIV-1-specific monoclonal antibodies in SHIV-infected rhesus monkeys. Nature. 503:224–228. 10.1038/nature12744 - DOI - PMC - PubMed
    1. Barton J.P. 2017. Simple rebound simulation. Simulating viral rebound from the latent reservoir. Available at: https://github.com/bartonlab/simple-rebound-simulation. Accessed March 28, 2018.
    1. Batorsky R., Kearney M.F., Palmer S.E., Maldarelli F., Rouzine I.M., and Coffin J.M.. 2011. Estimate of effective recombination rate and average selection coefficient for HIV in chronic infection. Proc. Natl. Acad. Sci. USA. 108:5661–5666. 10.1073/pnas.1102036108 - DOI - PMC - PubMed

Publication types

MeSH terms