. 2018 Aug 3;361(6401):469-474.
doi: 10.1126/science.aat1168.

Emergent simplicity in microbial community assembly

Affiliations

Emergent simplicity in microbial community assembly

Joshua E Goldford et al. Science. .

Abstract

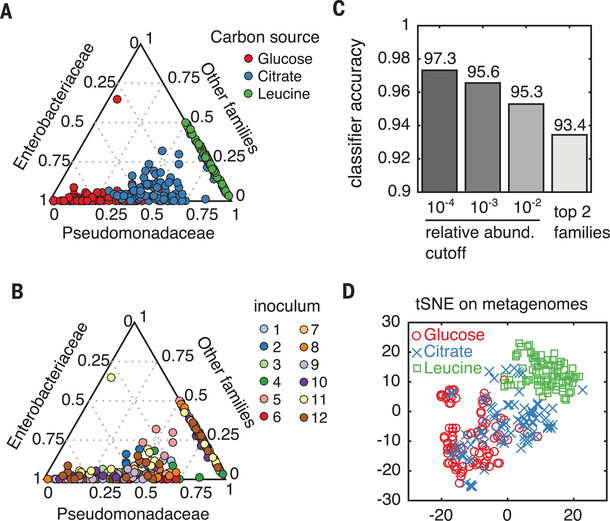
A major unresolved question in microbiome research is whether the complex taxonomic architectures observed in surveys of natural communities can be explained and predicted by fundamental, quantitative principles. Bridging theory and experiment is hampered by the multiplicity of ecological processes that simultaneously affect community assembly in natural ecosystems. We addressed this challenge by monitoring the assembly of hundreds of soil- and plant-derived microbiomes in well-controlled minimal synthetic media. Both the community-level function and the coarse-grained taxonomy of the resulting communities are highly predictable and governed by nutrient availability, despite substantial species variability. By generalizing classical ecological models to include widespread nonspecific cross-feeding, we show that these features are all emergent properties of the assembly of large microbial communities, explaining their ubiquity in natural microbiomes.


Conflict of interest statement

Competing interests: The authors declare that no competing interests exist in relation to this manuscript.

Figures

Fig. 1.
Fig. 1.. Top-down assembly of bacterial consortia.
(A) Experimental scheme: Large ensembles of taxa were obtained from 12 leaf and soil samples and used as inocula in serial dilution cultures containing synthetic media supplemented with glucose as the sole carbon source. After each transfer, 16S rRNA amplicon sequencing was used to assay bacterial community structure. (B) Analysis of the structure of a representative community (from inoculum 2) after every dilution cycle (about seven generations) reveals a five-member consortium from the Enterobacter, Raoultella, Citrobacter, Pseudomonas, and Stenotrophomonas genera. The community composition of all 12 starting inocula after 84 generations is shown at (C) the exact sequence variant (ESV) level or (D) the family taxonomic level, converging to characteristic fractions of Enterobacteriaceae and Pseudomonadaceae. (E) Simplex representation of family-level taxonomy before (t = 0) and after (t = 84) the passaging experiment. (F and G) Experiments were repeated with eight replicates from a single source (inocula 2). Communities converged to very similar family-level distributions (G) but displayed characteristic variability at the genus and species level (F).
Fig. 2.
Fig. 2.. Family-level and metagenomic attractors are associated with different carbon sources.
(A and B) Family-level community compositions are shown for all replicates across 12 inocula grown on either glucose, citrate, or leucine as the limiting carbon source. Data points are colored by carbon source (A) or initial inoculum (B). (C) A support vector machine (methods) was trained to classify the carbon source from the family-level community structure. Low-abundance taxa were filtered using a predefined cutoff (x axis) before training and performing 10-fold cross-validation (averaged 10 times). Classification accuracy with only Enterobacteriaceae and Pseudomonadaceae resulted in a model with ~93% accuracy (rightmost bar), while retaining low-abundance taxa (relative abundance cutoff of 10−4) yielded a classification accuracy of ~97% (leftmost bar). (D) Metagenomes were inferred using PICRUSt (40) and dimensionally reduced using t-distributed stochastic neighbor embedding (tSNE), revealing that carbon sources are strongly associated with the predicted functional capacity of each community.
Fig. 3.
Fig. 3.. Nonspecific metabolic facilitation may stabilize competition for the supplied resource.
(A) Representatives of the four most abundant genera in a representative community (percentages shown in the pie chart) were isolated on M9 minimal glucose medium. (B) Experimental setup: Isolates were independently grown in 1X M9 media supplemented with 0.2% glucose for 48 hours, after which cells were filtered out from the suspension. The filtrate was mixed 1:1 with 2X M9 media in the absence of any other carbon sources and used as the growth media for all other isolates (methods). (C) Three replicate growth curves of the Citrobacter isolate on either M9-glucose media (gray) or the M9-filtrate media from Enterobacter monoculture (black). Maximum growth rate (r) and carrying capacity (K) were obtained by fitting to a logistic growth model. (D) All isolates were grown on every other isolate’s metabolic by-products, and logistic models were used to fit growth curves. We plotted the fitted growth parameters (carrying capacity) as edges on a directed graph. Edge width and color encode the carrying capacity of the target node isolate when grown using the secreted by-products from the source node isolate. Edges from the top node encode the carrying capacity on 0.2% glucose. (E and F) Growth curves of 95 stabilized communities in M9 glucose media (gray lines) were obtained by measuring the optical density at 620 nm (OD620) at different incubation times. Open circles represent the mean OD620 over all communities at different time points, joined by a dashed line as a guide to the eye. Communities grew on average an additional 25% after glucose had been entirely depleted (~24 hours).
Fig. 4.
Fig. 4.. A simple extension of classic ecological models recapitulates experimental observations.
MacArthur’s consumer-resource model was extended to include 10 by-product secretions along with consumption of a single primary limiting nutrient (supplementary materials), controlled by secretion coefficient Dβα, which encodes the proportion of the consumed resource α that is transformed to resource β and secreted back into the environment. Consumer coefficients were sampled from four distributions, representing four “families” of similar consumption vectors (fig. S19 and supplementary text). (A) Simulations using randomly sampled secretion and uptake rates resulted in coexistence of multiple competitors, whereas setting secretion rates to zero eliminated coexistence (inset). a.u., arbitrary units. (B and C) Random ecosystems often converged to similar “family”-level structures (C), despite variation in the “species”-level structure (B).The “family”-level attractor changed when a different resource was provided to the same community (lower plots). (D) The total resource uptake capacity of the community was computed (supplementary materials) and is, like the family-level structure, highly associated with the supplied resource. (E) Communities that formed did not simply consist of single representatives from each family, but often of guilds of several species within each family, similar to what we observed experimentally. (F) The topology of the flux distribution shows that surviving species all compete for the primary nutrient, and competition is stabilized by differential consumption of secreted by-products. The darkness of the arrows encodes the magnitude of flux.

References

    1. Falkowski PG, Fenchel T, Delong EF, Science 320, 1034–1039 (2008). - PubMed
    1. Sunagawa S et al., Science 348, 1261359 (2015). - PubMed
    1. Human Microbiome Project Consortium, Nature 486, 207–214 (2012). - PMC - PubMed
    1. Costello EK, Stagaman K, Dethlefsen L, Bohannan BJM, Relman DA, Science 336, 1255–1262 (2012). - PMC - PubMed
    1. Turnbaugh PJ et al., Nature 457, 480–484 (2009). - PMC - PubMed

Publication types