. 2018 Aug 2;9(1):3033.
doi: 10.1038/s41467-018-05516-7.

Soil bacterial networks are less stable under drought than fungal networks

Affiliations

Soil bacterial networks are less stable under drought than fungal networks

Franciska T de Vries et al. Nat Commun. .

Abstract

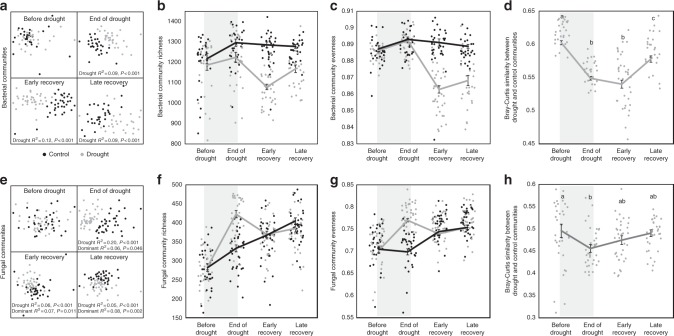
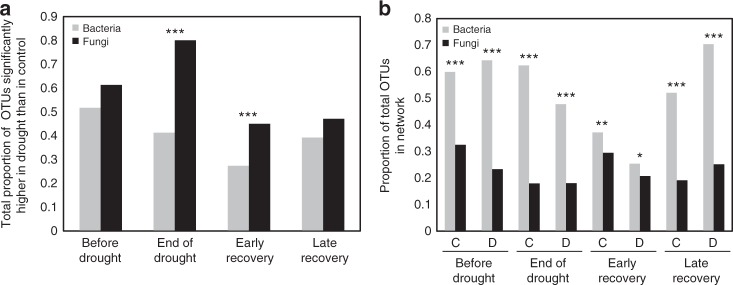
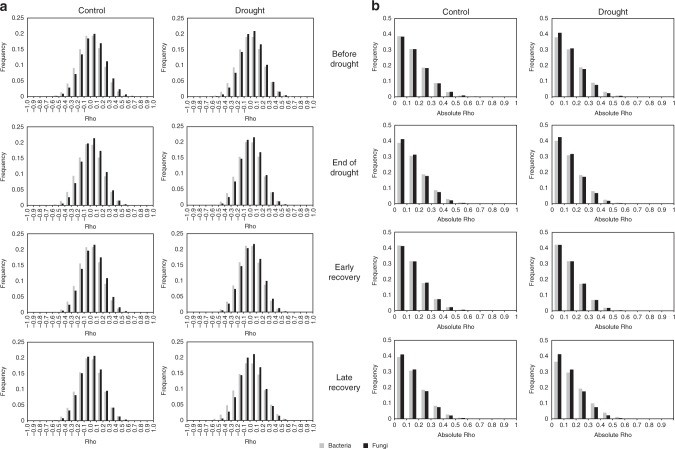
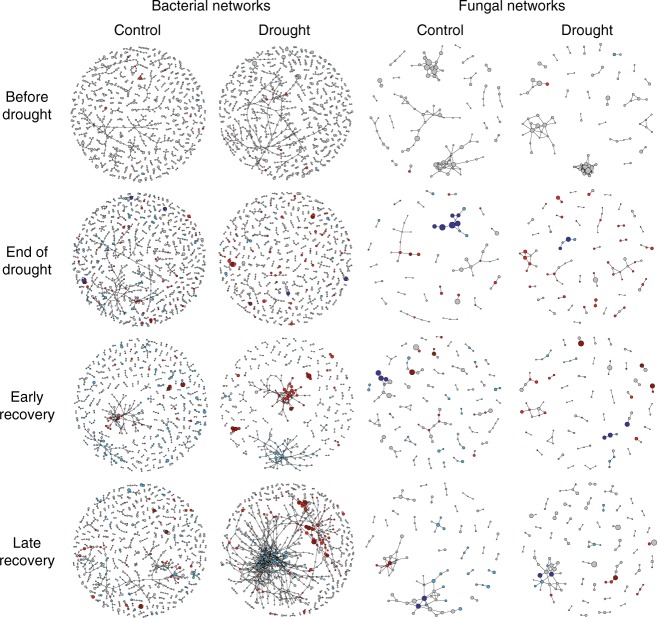
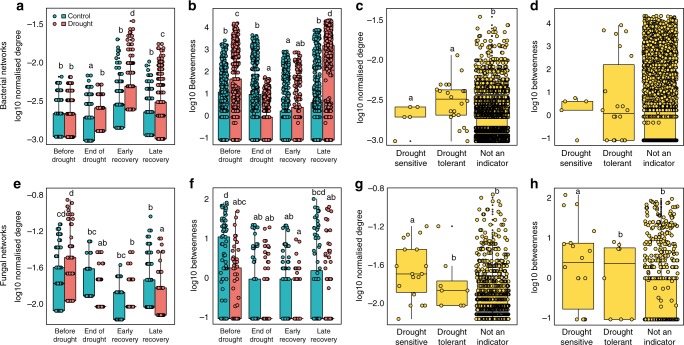
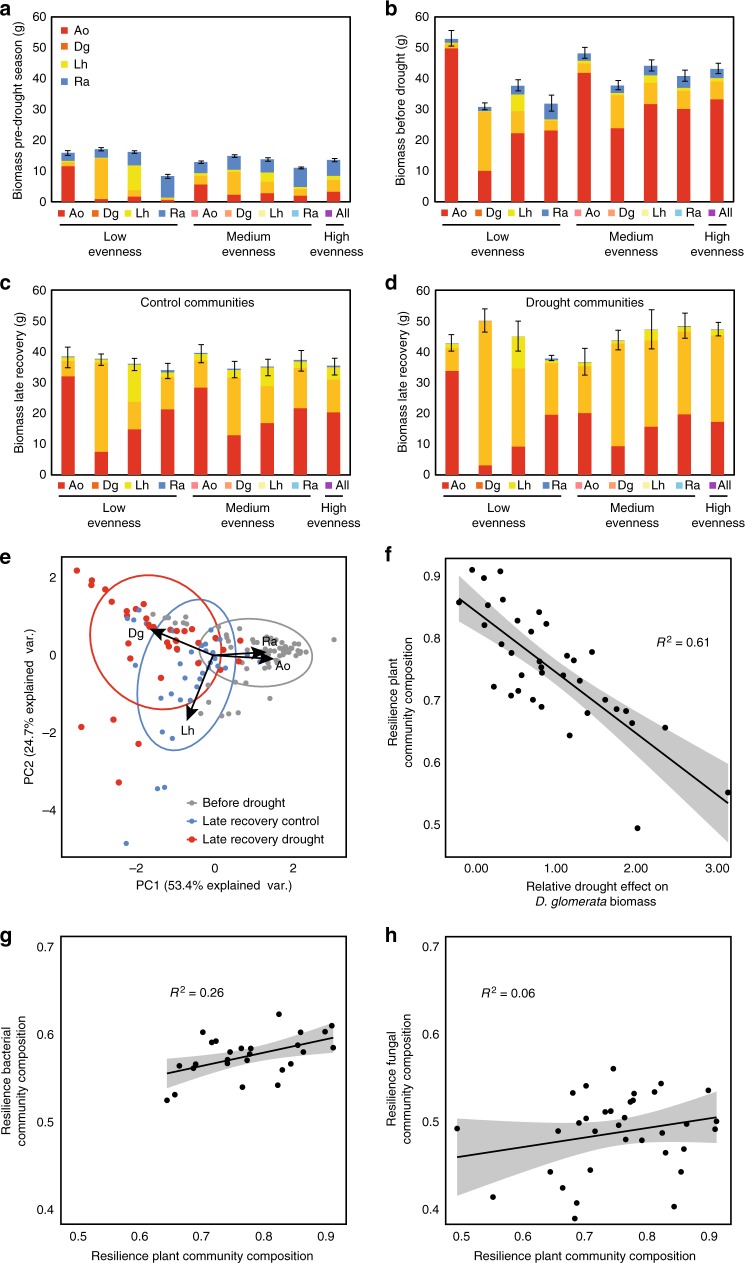
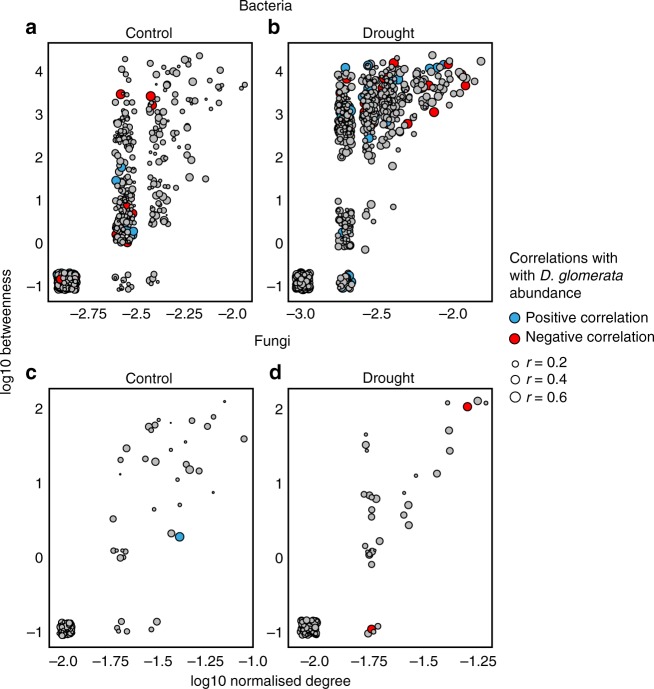
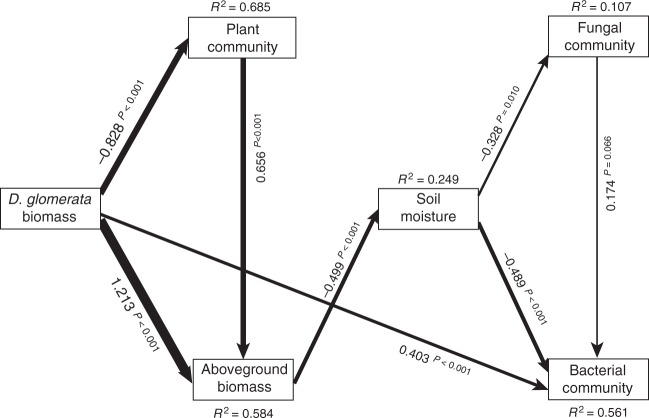
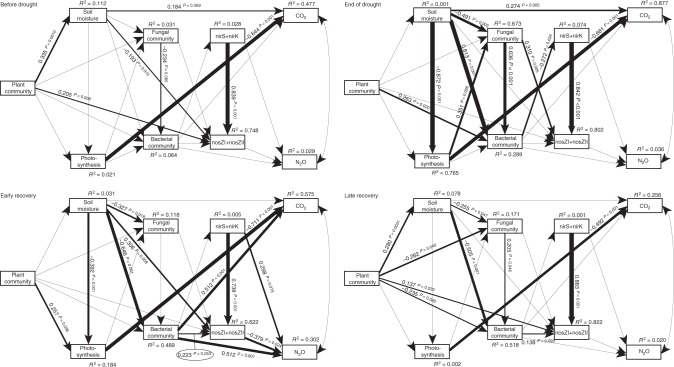
Soil microbial communities play a crucial role in ecosystem functioning, but it is unknown how co-occurrence networks within these communities respond to disturbances such as climate extremes. This represents an important knowledge gap because changes in microbial networks could have implications for their functioning and vulnerability to future disturbances. Here, we show in grassland mesocosms that drought promotes destabilising properties in soil bacterial, but not fungal, co-occurrence networks, and that changes in bacterial communities link more strongly to soil functioning during recovery than do changes in fungal communities. Moreover, we reveal that drought has a prolonged effect on bacterial communities and their co-occurrence networks via changes in vegetation composition and resultant reductions in soil moisture. Our results provide new insight in the mechanisms through which drought alters soil microbial communities with potential long-term consequences, including future plant community composition and the ability of aboveground and belowground communities to withstand future disturbances.


Conflict of interest statement

The authors declare no competing interests.

Figures

Fig. 1
Fig. 1
Bacterial and fungal community response to drought. The duration of the drought is indicated as a shaded area in bd and fh. NMDS of bacterial (a) and fungal (e) community composition shows that drought significantly affected bacterial and fungal communities at all sampling dates following drought (ADONIS). Bacterial (b, c) and fungal (f, g) richness and evenness were strongly affected by drought, but this response differed over time (Repeated measures ANOVA sampling × Drought interaction F3,153 = 10.4, P < 0.001 and F3,195 = 14.8, P < 0.001 for richness of bacteria and fungi, respectively; Sampling × Drought interaction F3,153 = 23.1, P < 0.001 and F3,195 = 23.1, P < 0.001 for evenness of bacteria and fungi, respectively). The similarity between drought and control communities changed over time for both bacteria and fungi, but bacterial drought and control communities were still less similar than before drought at late recovery (ANOVA sampling effect F3,80 = 40.9, P < 0.001 and F3,103 = 2.8, P = 0.04 for bacteria and fungi, respectively). In bd and fh, dots represent individual observations and lines indicate means ± 1 SE. In d, h, symbols with the same letter are not statistically different
Fig. 2
Fig. 2
Relative abundance and proportion of total bacterial and fungal OTUs included in co-occurrence networks. A significantly larger proportion of fungal OTUs than bacterial OTUs increased under drought at the end of the drought and early recovery (a χ2 = 122, df = 1, P < 0.001 and χ2 = 23.2, df = 1, P < 0.001, respectively). A significantly larger proportion of bacterial OTUs was included in bacterial co-occurrence networks than of fungal OTUs in fungal co-occurrence networks (b χ2-tests for all drought (D) and control (C) treatments over time were significant). Asterisks indicate the significance of the difference between proportions in bacterial and fungal communities (*P < 0.05, **P < 0.01, ***P < 0.001)
Fig. 3
Fig. 3
Frequency distributions of correlations in fungal and bacterial networks. Frequency distributions of the sign and strength of all correlations in fungal and bacterial networks (a), and of the absolute strength of all correlations in fungal and bacterial networks (b), in drought and control treatments over time (top to bottom). Correlations in bacterial networks are light grey, correlations in fungal networks are dark grey
Fig. 4
Fig. 4
Bacterial and fungal co-occurrence networks over time as affected by drought. Nodes represent individual OTUs; edges represent significant positive Spearman correlations (ρ > 0.6, P < 0.001). Light blue and light red OTUs decrease and increase under drought, respectively; dark blue and dark red OTUs indicate high abundance OTUs that decrease and increase strongly under drought, respectively (drought-sensitive and drought-tolerant indicator OTUs). For detailed network properties, see Supplementary Table 1
Fig. 5
Fig. 5
Node connectedness and centrality of bacterial and fungal networks. In bacterial networks, drought increased connectedness (normalised degree) and centrality (betweenness) at post-drought samplings (a, b Sampling × Drought interaction F3,5973 = 67.3, P < 0.001 and F3,5973 = 107.5, P < 0.001, respectively), while in fungal networks, drought did either not affect, or decrease these properties (e, f Sampling × Drought interaction F3,833 = 21.6, P < 0.001 and F3,833 = 1.4, P = 0.234 for normalised degree and betweenness, respectively). In bacterial networks, the normalised degree of drought-sensitive and drought-tolerant indicator OTUs was higher than those of non-indicator OTUs (c F2,5977 = 12.5, P < 0.001), but betweenness was not affected (d). In fungal networks, drought-sensitive OTUs had a higher normalised degree and betweenness than non-indicator OTUs (g, h F2,834 = 10.8, P < 0.001 and F2,834 = 11.6, P < 0.001, respectively). Lines in boxes represent median, top and bottom of boxes represent first and third quartiles, and whiskers represent 1.5 interquartile range; dots represent single observations. Boxes with the same lower-case letters are not statistically different
Fig. 6
Fig. 6
Drought effects on plant community composition and the relationship between changes in plant community composition and microbial community composition. Biomass of the four species in our established plant communities in the pre-drought season (a), just before drought (b) and 2 months after ending the drought (c, d), split for control (c) and drought communities (d). Plant community treatments are on the x-axis, with three different evenness levels and each species dominating within each evenness level. Total community biomass increased marginally in response to drought (ANOVA F1,48 = 273, P = 0.08); D. glomerata (Dg) biomass increased strongly under drought, except in Anthoxanthum odoratum (Ao)-dominated communities (ANOVA dominant species × Drought interaction F14,48 = 4.52, P = 0.004). Ao Anthoxanthum odoratum, Dg Dactylis glomerata, Lh Leontodon hispidus, Ra Rumex acetosa. PCA-biplot of plant community composition (e) shows that PC-axes 1 and 2 scores were significantly affected by drought at the late recovery sampling (ANOVA F1,48 = 273, P < 0.001 and F1,48 = 37.2, P = 0.008, respectively). Resilience of plant community composition (similarity between drought and control, measured as Bray–Curtis distances) explained by the relative change in D. glomerata biomass in response to drought (f). With a larger drought-induced increase in D. glomerata biomass, droughted plant communities were less similar to control communities (P < 0.001). The resilience of bacterial community composition (g) was positively explained by the resilience of plant community composition (R2 = 0.26, P = 0.008), but this relationship was not significant for fungal community resilience (h R2 = 0.06, P = 0.182). In ad, bars represent means ± 1 SE (n = 4, SE for total biomass only); in fh, dots represent single observations, with shaded areas indicating 95% confidence intervals
Fig. 7
Fig. 7
Relationship between network properties and correlation with D. glomerata biomass at the late recovery sampling time point. Symbol size indicates the strength of the correlation of that node with D. glomerata abundance; blue and red symbols indicate significant positive and negative correlations with D. glomerata, respectively, while grey symbols represent non-significant correlations. All networks had a positive correlation between node-normalised degree and betweenness (ad), but only in bacterial drought networks, there was a strong positive relationship between both normalised degree and betweenness and the strength of node correlation with D. glomerata abundance (ANCOVA normalised degree × Drought interaction F1,1676 = 25.9, P < 0.001 and Betweenness × Drought interaction F1,1676 = 14.5, P < 0.001 for bacteria (b); and Normalised degree F1,225 = 1.1, P = 0.742, Normalised degree × Drought F1,225 = 1.2, P = 0.275, Betweenness F1,225 = 0.08, P = 0.772, Betweenness × Drought F1,225 = 0.678, P = 0.411 for fungi (d))
Fig. 8
Fig. 8
Structural equation model of relationships between D. glomerata biomass, plant community attributes and microbial properties, at the final, late recovery sampling. For each significant relationship, standardised coefficient and P values are given alongside arrow, and arrow weights are proportional to standardised coefficients. The model fit the data well: P = 0.345, CFI = 0.995, P RMSEA < = 0.05 = 0.439
Fig. 9
Fig. 9
Structural equation model of relationships between plant community attributes, microbial properties and ecosystem functioning for each sampling. For each significant relationship, standardised coefficient and P = values are given alongside arrow, and arrow weights are proportional to standardised coefficients. Our multigroup model fit the data well: P = 0.309, CFI = 0.994, P RMSEA < = 0.05 = 0.574

References

    1. De Vries FT, Wallenstein MD. Belowground connections underlying aboveground food production: a framework for optimising ecological connections in the rhizosphere. J. Ecol. 2017;105:913–920. doi: 10.1111/1365-2745.12783. - DOI
    1. Bardgett RD, van der Putten WH. Belowground biodiversity and ecosystem functioning. Nature. 2014;515:505–511. doi: 10.1038/nature13855. - DOI - PubMed
    1. IPCC. in Climate Change 2014: Impacts, Adaptation, and Vulnerability (eds Vicente R. et al.) (Cambridge University Press, Cambridge, 2014).
    1. De Vries FT, Shade A. Controls on soil microbial community stability under climate change. Front. Microbiol. 2013;4:265. doi: 10.3389/fmicb.2013.00265. - DOI - PMC - PubMed
    1. Kaisermann A, de Vries FT, Griffiths RI, Bardgett RD. Legacy effects of drought on plant–soil feedbacks and plant–plant interactions. New Phytol. 2017;215:1413–1424. doi: 10.1111/nph.14661. - DOI - PubMed

Publication types