. 2018 Jul 20:9:1618.
doi: 10.3389/fmicb.2018.01618. eCollection 2018.

Fiber Supplements Derived From Sugarcane Stem, Wheat Dextrin and Psyllium Husk Have Different In Vitro Effects on the Human Gut Microbiota

Affiliations

Fiber Supplements Derived From Sugarcane Stem, Wheat Dextrin and Psyllium Husk Have Different In Vitro Effects on the Human Gut Microbiota

Hasinika K A H Gamage et al. Front Microbiol. .

Abstract

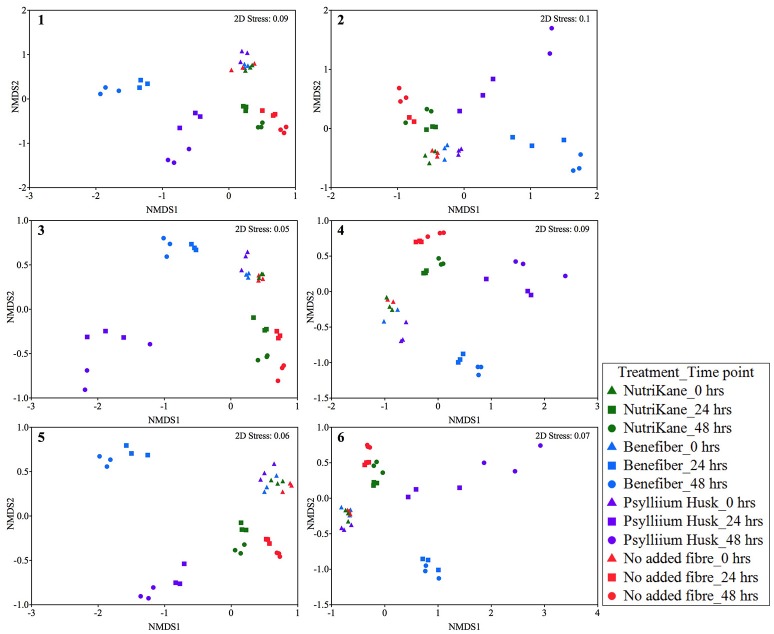
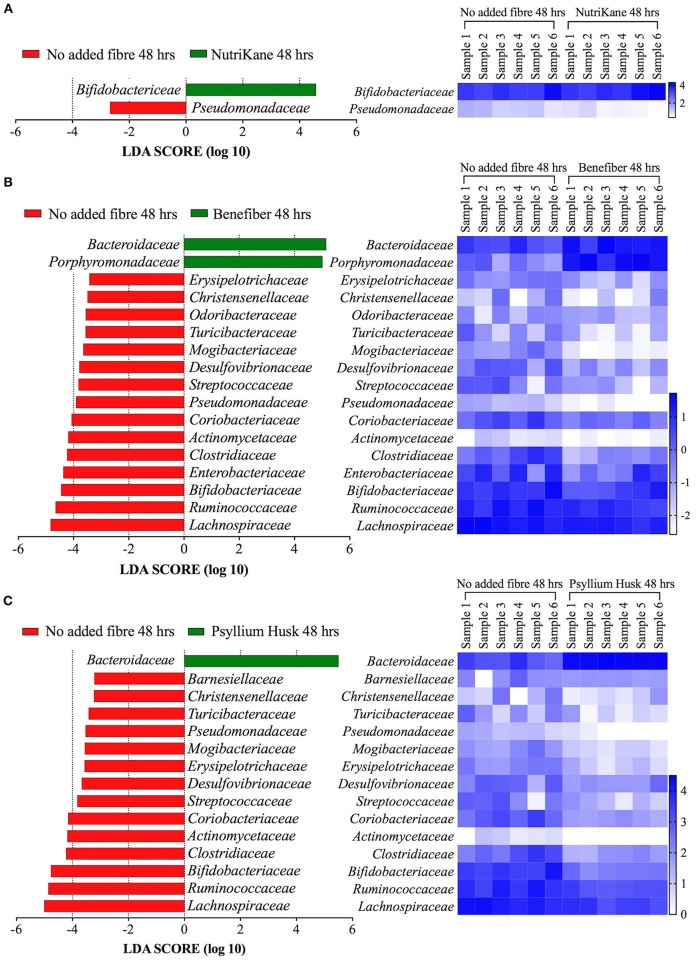
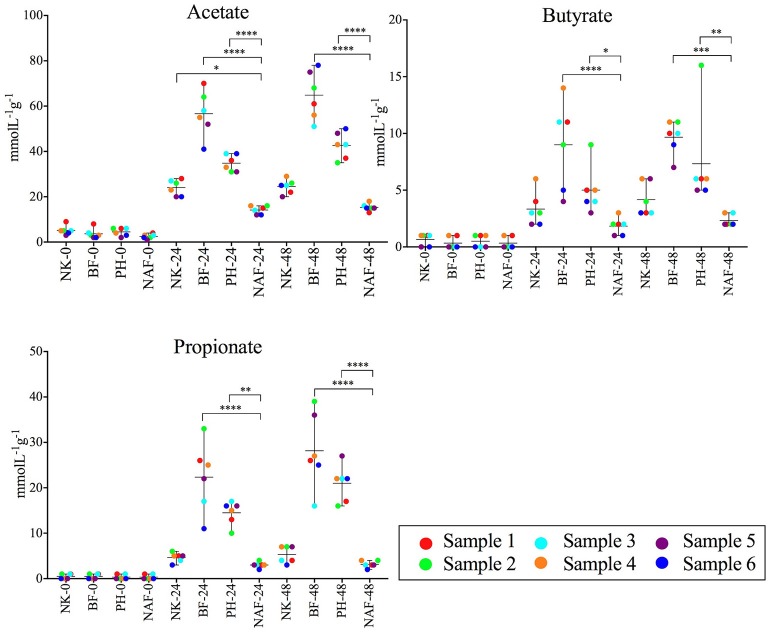
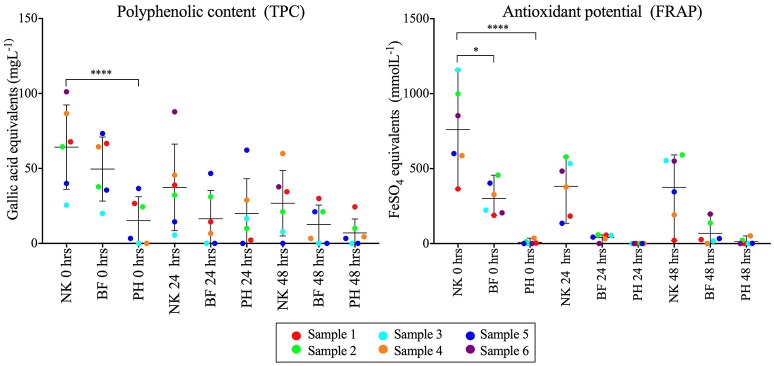
There is growing public interest in the use of fiber supplements as a way of increasing dietary fiber intake and potentially improving the gut microbiota composition and digestive health. However, currently there is limited research into the effects of commercially available fiber supplements on the gut microbiota. Here we used an in vitro human digestive and gut microbiota model system to investigate the effect of three commercial fiber products; NutriKane™, Benefiber® and Psyllium husk (Macro) on the adult gut microbiota. The 16S rRNA gene amplicon sequencing results showed dramatic fiber-dependent changes in the gut microbiota structure and composition. Specific bacterial OTUs within the families Bacteroidaceae, Porphyromonadaceae, Ruminococcaceae, Lachnospiraceae, and Bifidobacteriaceae showed an increase in the relative abundances in the presence of one or more fiber product(s), while Enterobacteriaceae and Pseudomonadaceae showed a reduction in the relative abundances upon addition of all fiber treatments compared to the no added fiber control. Fiber-specific increases in SCFA concentrations showed correlation with the relative abundance of potential SCFA-producing gut bacteria. The chemical composition, antioxidant potential and polyphenolic content profiles of each fiber product were determined and found to be highly variable. Observed product-specific variations could be linked to differences in the chemical composition of the fiber products. The general nature of the fiber-dependent impact was relatively consistent across the individuals, which may demonstrate the potential of the products to alter the gut microbiota in a similar, and predictable direction, despite variability in the starting composition of the individual gut microbiota.

Keywords: 16S rRNA gene; dietary fiber supplementation; gut microbiota; in vitro gut models; polyphenols; short chain fatty acids.


Figures

Figure 1
Figure 1
Ordination of the gut microbiota in each biological sample (sample 1-6) at 0, 24, and 48 h. Data is shown as Bray-Curtis similarity of Log (X+1) relative abundance based nMDS plots. At 0 h (triangles) all samples group together. Fiber-dependent shifts were observed at 24 (squares) and 48 (circles) hours in all the treatments. NutriKane (green), Benefiber (blue) and Psyllium husk (purple) had different communities to the no added fiber control (red) while samples with Benefiber and Psyllium husk showed the most dramatic shifts compared to the no added fiber control and other treatments.
Figure 2
Figure 2
The (A) Shannon diversity indices and (B) Simpson's evenness indices of microbial communities from each treatment at 0, 24, and 48 h. Data is shown as mean ± SD for samples with NutriKane (NK), Benefiber (BF), Psyllium husk (PH) and no added fiber control (NAF) at 0, 24, and 48 h. Biological samples (sample 1–6) are indicted by color-coded dots as shown in the key. Significance was determined using Kruskal-Wallis test with Dunn's multiple comparisons (*P < 0.05, **P < 0.01).
Figure 3
Figure 3
Key gut microbiota bacterial families that respond to fiber supplementation at 48 h. Data was obtained using LEfSe analyses between (A) NutriKane vs. no added fiber control, (B) Benefiber vs. no added fiber control and (C) Psyllium husk vs. no added fiber control. The left histogram shows the LDA scores computed for each bacterial family and the right heat map shows the relative abundance (Log10 transformation) of the families in each of the six biological samples. In the heat map, rows correspond to bacterial families and columns correspond to an individual (Sample 1–6). Blue and white denote the highest and lowest relative abundance, respectively, as shown in the key.
Figure 4
Figure 4
Average concentrations of acetate, butyrate and propionate in each sample at 0, 24, and 48 h. Concentrations of all the SCFAs increased upon the fiber additions (NK- NutriKane, BF- Benefiber, PH- Psyllium husk) at 24 and 48 h compared to the no added fiber control (NAF). The mean ± SD concentrations per treatment at 0, 24, and 48 h are shown. The mean concentration for each biological sample (sample 1–6) is indicated by color-coded dots as shown in the key. Significance was determined using Tukeys's multiple comparison tests (*P < 0.05, **P < 0.01, ***P < 0.001, ****P < 0.0001). The measured SCFA concentrations are provided in Supplementary Table S7.
Figure 5
Figure 5
Comparison of the polyphenol content (mgL−1) and antioxidant potential (mmolL−1) of the fiber products (NK- NutriKane, BF- Benefiber, PH- Psyllium husk) in each sample at 0, 24 and 48 h. Measurements for each fiber addition in each biological sample have been normalized against the no added fiber control at equivalent time points. Data is shown as mean ± SD for each treatment at 0, 24, and 48 h. Biological samples are indicted by color-coded dots as shown in the key. Significance was determined using Kruskal-Wallis test with Dunn's multiple comparisons (*P < 0.05, ****P < 0.0001). The measured concentrations are provided in Supplementary Table S8.

References

    1. Aguirre M., Eck A., Koenen M. E., Savelkoul P. H., Budding A. E., Venema K. (2016). Diet drives quick changes in the metabolic activity and composition of human gut microbiota in a validated in vitro gut model. Res. Microbiol. 167, 114–125. 10.1016/j.resmic.2015.09.006 - DOI - PubMed
    1. Arumugam M., Raes J., Pelletier E., Le Paslier D., Yamada T., Mende D. R., et al. (2011). Enterotypes of the human gut microbiome. Nature 473, 174–180. 10.1038/nature09944 - DOI - PMC - PubMed
    1. Bäckhed F., Ley R. E., Sonnenburg J. L., Peterson D. A., Gordon J. I. (2005). Host-bacterial mutualism in the human intestine. Science 307, 1915–1920. 10.1126/science.1104816 - DOI - PubMed
    1. Balch W. E., Fox G. E., Magrum L. J., Woese C. R., Wolfe R. S. (1979). Methanogens: Reevaluation of a unique biological group. Microbiol. Rev. 43, 260–296. - PMC - PubMed
    1. Benzie I. F., Strain J. J. (1996). The ferric reducing ability of plasma (FRAP) as a measure of “antioxidant power”: The FRAP assay. Anal. Biochem. 239, 70–76. - PubMed

LinkOut - more resources