. 2018 Jul 11;5(4):ENEURO.0166-18.2018.
doi: 10.1523/ENEURO.0166-18.2018. eCollection 2018 Jul-Aug.

Genetic Control of Myelin Plasticity after Chronic Psychosocial Stress

Affiliations

Genetic Control of Myelin Plasticity after Chronic Psychosocial Stress

Mikaela A Laine et al. eNeuro. .

Abstract

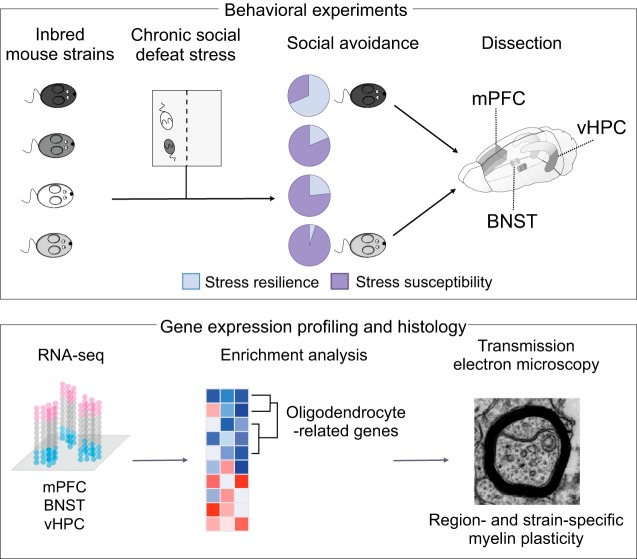
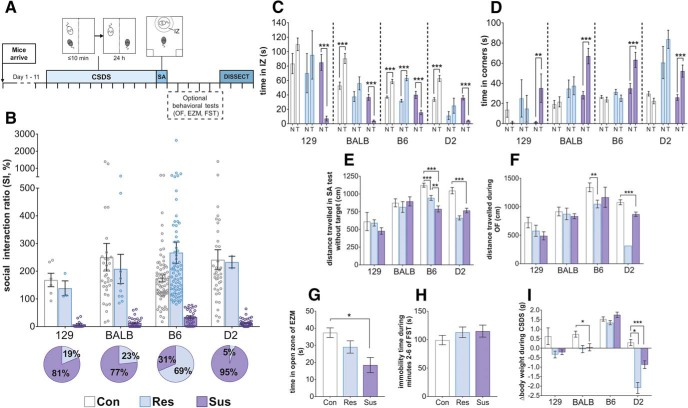
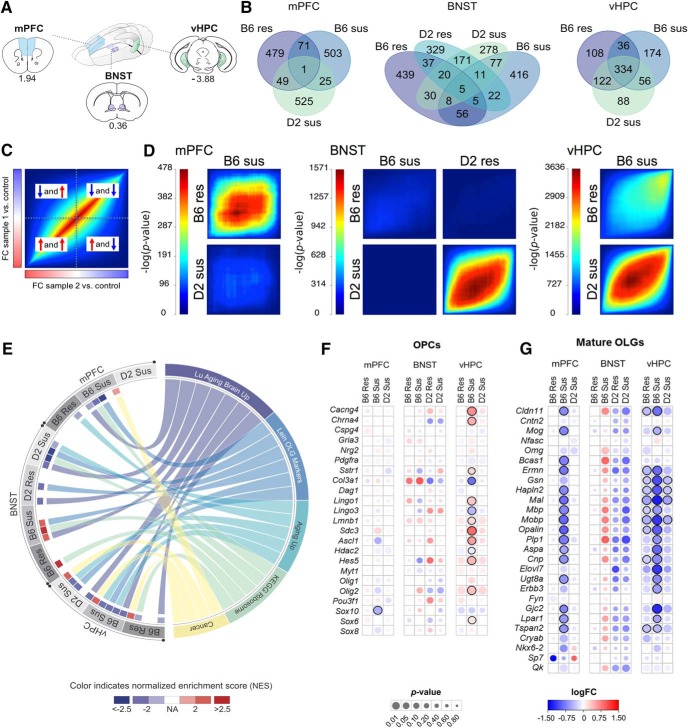
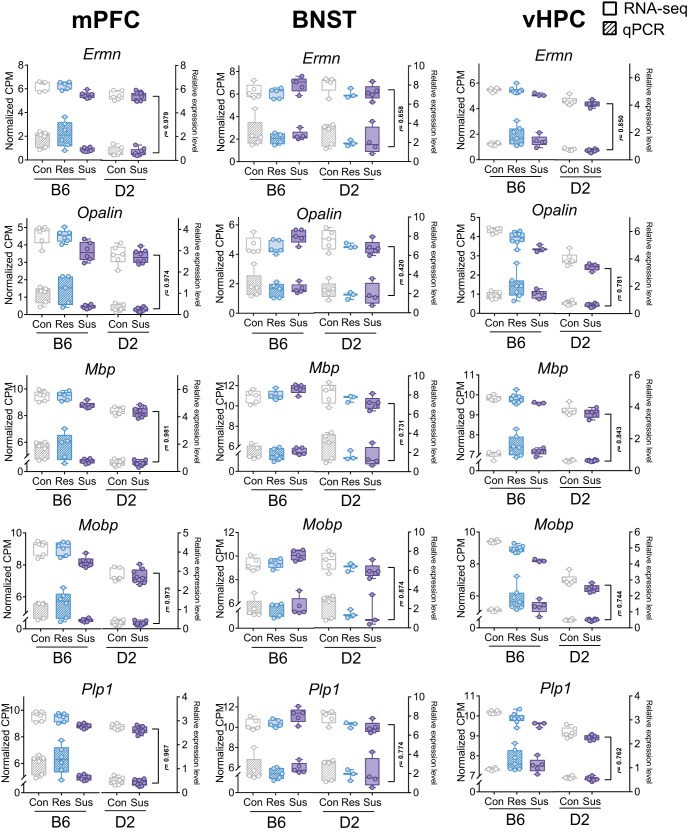
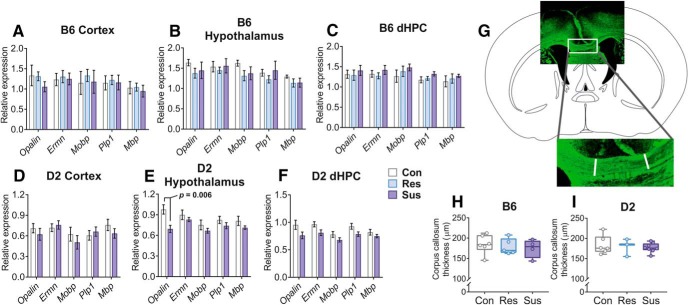
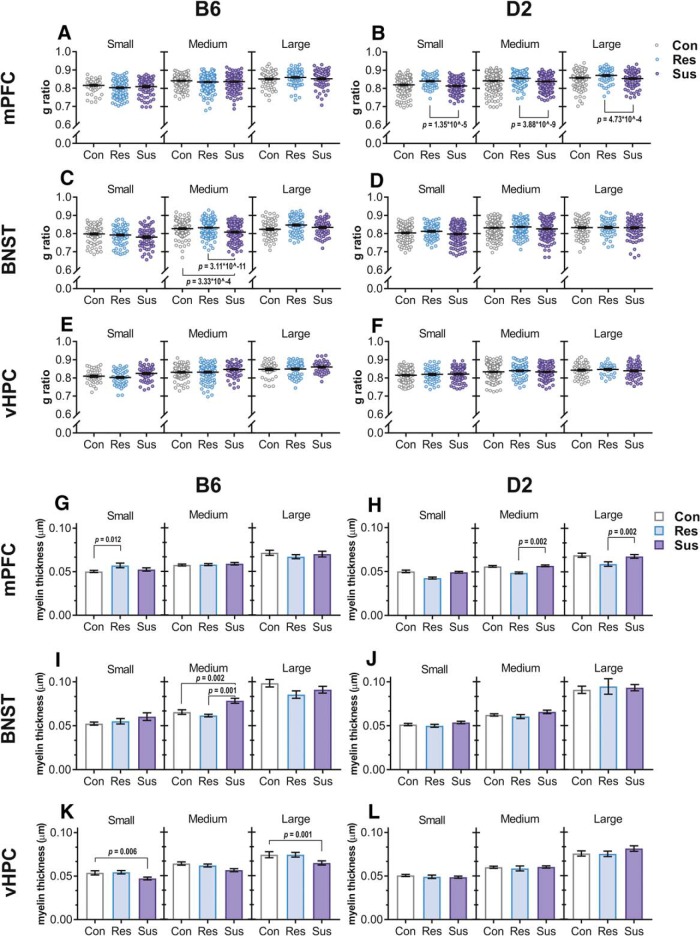
Anxiety disorders often manifest in genetically susceptible individuals after psychosocial stress, but the mechanisms underlying these gene-environment interactions are largely unknown. We used the chronic social defeat stress (CSDS) mouse model to study resilience and susceptibility to chronic psychosocial stress. We identified a strong genetic background effect in CSDS-induced social avoidance (SA) using four inbred mouse strains: 69% of C57BL/6NCrl (B6), 23% of BALB/cAnNCrl, 19% of 129S2/SvPasCrl, and 5% of DBA/2NCrl (D2) mice were stress resilient. Furthermore, different inbred mouse strains responded differently to stress, suggesting they use distinct coping strategies. To identify biological pathways affected by CSDS, we used RNA-sequencing (RNA-seq) of three brain regions of two strains, B6 and D2: medial prefrontal cortex (mPFC), ventral hippocampus (vHPC), and bed nucleus of the stria terminalis (BNST). We discovered overrepresentation of oligodendrocyte (OLG)-related genes in the differentially expressed gene population. Because OLGs myelinate axons, we measured myelin thickness and found significant region and strain-specific differences. For example, in resilient D2 mice, mPFC axons had thinner myelin than controls, whereas susceptible B6 mice had thinner myelin than controls in the vHPC. Neither myelin-related gene expression in several other regions nor corpus callosum thickness differed between stressed and control animals. Our unbiased gene expression experiment suggests that myelin plasticity is a substantial response to chronic psychosocial stress, varies across brain regions, and is genetically controlled. Identification of genetic regulators of the myelin response will provide mechanistic insight into the molecular basis of stress-related diseases, such as anxiety disorders, a critical step in developing targeted therapy.

Keywords: RNA-sequencing; anxiety; chronic social defeat stress; inbred mouse strain; myelin; transmission electron microscopy.


Figures

None
Graphical abstract
Figure 1.
Figure 1.
Strong genetic background effect on the behavioral response to CSDS. A, Timeline of experiments. Each perpendicular line represents 1 d. B, SI ratios of the four strains in the SA test. Pie charts represent the proportion of resilient and susceptible mice in each mouse strain. 129, BALB, and D2 strains were highly susceptible to CSDS, while B6 strain was the most resilient to CSDS. Time spent in the IZ (C) and the corner zones (D) of the SA test during sessions with no social target (N) and a CD1 mouse as a social target (T). Susceptible mice of all strains spent less time in the IZ when the target was present compared to when it was not. E, Distance traveled during the no-target trial of the SA test. In the B6 strain, both susceptible and resilient mice had lower locomotor activity, while in the D2 strain only susceptible mice moved significantly less than controls; n (B–E, I) = 129: Con = 7, Res = 3, Sus = 13; C: Con = 34, Res = 10, Sus = 33; B6: Con = 72, Res = 70, Sus = 32; D2: Con = 39, Res = 2, Sus = 40. F, Distance traveled during the 5-min OF test. B6 resilient and D2 susceptible mice traveled significantly shorter distances than their same-strain control mice; n = 129: Con = 7, Res = 3, Sus = 13; C: Con = 18, Res = 6, Sus = 19; B6: Con = 20, Res = 19, Sus = 4; D2: Con = 19, Res = 1 (not analyzed), Sus = 22. G, Time B6 mice spent in the open area of the EZM. Susceptible mice spent significantly less time in the open zones compared to controls; n: Con = 20, Res = 29, Sus = 11. H, Immobility time of B6 mice during minutes 2–6 of the FST did not differ between groups; n = Con = 28, Res = 32, Sus = 21. I, Difference in body weight before and after CSDS. B6 defeated mice gained weight during CSDS similarly to their same-strain controls, BALB susceptible mice gained significantly less weight than controls, and both resilient and susceptible D2 mice lost weight. All figures depict mean ± 1 SEM; *p < 0.05, **p < 0.01, ***p < 0.001, see Extended Data Figure 1-1 for exact p values. D2: DBA/2NCrl strain; BALB: Balb/cAnNCrl; 129: 129S2/SvPasCrl; B6: C57BL/6NCrl; Con: control; Res: resilient; Sus: susceptible; mPFC: medial prefrontal cortex; BNST: bed nucleus of the stria terminalis; vHPC: ventral hippocampus.
Figure 2.
Figure 2.
RNA-seq implicates OLG-related gene expression changes after CSDS. A, Regions dissected for RNA-seq from D2 and B6 mice (for sample and RNA-seq details, see Extended Data Fig. 2-1). B, Overlap of 300 top downregulated and 300 top upregulated genes between stressed and control mice, separately for each brain region (see Extended Data Fig. 2-2 for top 300 differentially expressed genes and Extended Data Fig. 2-3A,B for overlap separately for upregulated and downregulated genes). C, Key to RRHO showing a hypothetical heatmap of two identical datasets (“FC sample 1 versus control” and “FC sample 2 versus control”). Following differential gene expression analysis, genes were ranked by their fold change (FC) and assigned to bins of 100 genes. Overlap of genes was then compared between each ranking matched bin of “sample 1 versus control” and “sample 2 versus control.” Heatmap color represents the significance of the overlap [-log10(p)] of genes between bins. Thus significant p values in the bottom-left corner indicate that the two datasets have shared upregulated genes, significant p values in the top-right corner indicate shared downregulated genes, and significant p values in the middle indicate genes not differentially expressed or with small FC. Significant p values in the top-left or bottom-right corner represent genes regulated in opposite directions between the two datasets. D, RRHO shows significant similarity in the gene expression response to CSDS between resilient and susceptible mice within strains (B6 mPFC and vHPC, D2 BNST) and between susceptible mice of B6 and D2 strains (vHPC). Scale bar = –log(p) of rank classes (n = 100), for each brain region separately. E, Circos plot showing the top five enriched gene sets overlapping between the brain regions in stress-resilient and susceptible mice compared to controls. Only normalized enrichment scores (NESs) achieving significance (pFDR < 0.05) are shown. A positive (or negative) NES for a given gene set indicates its overrepresentation at the top (or bottom, respectively) of the ranked list of upregulated (or downregulated, respectively) genes. See Extended Data Figures 2-4, 2-5 for GSEA and GO analyses, respectively; see Extended Data Figure 2-3C for expression FC for genes in the Lein OLG Markers gene set. F, G, Merged heat map showing the expression FC (logFC) and significance (p) of OPC-specific (F) and OLG-specific (G) genes. B6: C57BL/6NCrl strain; D2: DBA/2NCrl strain; Res: resilient; Sus: susceptible; mPFC: medial prefrontal cortex; BNST: bed nucleus of the stria terminalis; vHPC: ventral hippocampus; Lu Aging Brain Up: LU_AGING_BRAIN_UP; Lein OLG Markers: LEIN_OLIGODENDROCYTE_MARKERS; Aging Up: DEMAGALHAES_AGING_UP; KEGG Ribosome: KEGG_RIBOSOME; Cancer: GINESTIER_BREAST_CANCER_ZNF217_AMPLIFIED_DN.
Figure 3.
Figure 3.
Strong correlation of gene expression levels of selected myelin-related genes determined by RNA-seq and q-RT-PCR. Box plots show the gene expression levels of five myelin-related genes (Ermn, Opalin, Mbp, Mobp, and Plp1) measured by RNA-seq (voom normalized number of reads, left y-axis, solid fill) and q-RT-PCR (right y-axis, striped fill). Pearson correlation coefficient (r) was calculated across the five (mPFC, vHPC) or six (BNST) group means. Box plots show distribution of values from min to max. mPFC: medial prefrontal cortex; vHPC: ventral hippocampus; BNST: bed nucleus of the stria terminalis; B6: C57BL/6NCrl: D2: DBA/2NCrl; Con: control; Res: resilient; Sus: susceptible.
Figure 4.
Figure 4.
No generalized effects on OLG-related gene expression or corpus callosum thickness after CSDS. A–F, Bar graphs showing the normalized expression levels of myelin-related genes in the hypothalamus and two brain regions not critically influenced by CSDS [cortex (without mPFC) and dHPC]. B6 and D2 mice were analyzed 6–8 d following CSDS. Myelin-related gene expression did not differ between phenotype groups in any of the brain regions of either strain. Only Opalin was expressed at a lower level in the hypothalamus of D2 susceptible mice compared to controls as shown by post hoc analysis. Mean ± 1 SEM is shown. G, H, CSDS does not affect corpus callosum thickness in B6 or D2 mice. Myelin visualized by anti-CNPase staining. Atlas outline modified from Franklin and Paxinos (2008); n = B6: Con = 6, Res = 5, Sus = 4; D2: Con = 6, Res = 3, Sus = 8. Error bars = min – max; D2: DBA/2NCrl strain; B6: C57BL/6NCrl strain; Con: control; Res: resilient; Sus: susceptible; dHPC: dorsal hippocampus.
Figure 5.
Figure 5.
CSDS influences g ratio, myelin thickness, and axon diameter as measured by TEM. A–F, Scatter plots of g ratio with mean indexed by a horizontal line. G ratio was lower in medium sized BNST axons of B6 susceptible mice compared to both control and resilient mice, and higher in all axon size categories in the mPFC of D2 resilient mice compared to susceptible mice. G–L, Bar graphs of mean myelin thickness. Concurrently to g ratio measurements, B6 susceptible mice had thicker myelin on medium sized axons in the BNST compared to resilient or control mice, and D2 resilient mice had thinner myelin on medium and large axons in the mPFC compared to susceptible mice. Additionally, myelin was thicker in the small axons of the mPFC in B6 resilient mice compared to controls and thinner in the small and large axons of the vHPC in B6 susceptible mice compared to controls; n = B6: Con = 3, Res = 4, Sus = 3; D2: Con = 6, Res = 3, Sus = 5. Error bars ± 1 SEM. See Extended Data Figure 5-1 for schematics of dissected regions, Extended Data Figure 5-2 for analyses without division of axons into size categories, and Extended Data Figure 5-3 for size category division criteria. All nominal p values surviving Bonferroni correction are shown. D2: DBA/2NCrl; B6: C57BL/6NCrl; mPFC: medial prefrontal cortex; BNST: bed nucleus of the stria terminalis; vHPC: ventral hippocampus; Con: control; Res: resilient; Sus: susceptible.

References

    1. Adhikari A, Topiwala MA, Gordon JA (2010) Synchronized activity between the ventral hippocampus and the medial prefrontal cortex during anxiety. Neuron 65:257–269. 10.1016/j.neuron.2009.12.002 - DOI - PMC - PubMed
    1. Ahima RS, Harlan RE (1990) Charting of type II glucocorticoid receptor-like immunoreactivity in the rat central nervous system. Neuroscience 39:579–604. - PubMed
    1. Ahima RS, Krozowski Z, Harlan R (1991) Type I corticosteroid receptor-like immunoreactivity in the rat CNS: distribution and regulation by corticosteroids. J Comp Neur 313:522–538. 10.1002/cne.903130312 - DOI - PubMed
    1. Alexa A, Rahnenführer J, Lengauer T (2006) Improved scoring of functional groups from gene expression data by decorrelating GO graph structure. Bioinformatics 22:1600–1607. 10.1093/bioinformatics/btl140 - DOI - PubMed
    1. Almeida RG, Lyons DA (2017) On myelinated axon plasticity and neuronal circuit formation and function. J Neurosci 37:10023–10034. 10.1523/JNEUROSCI.3185-16.2017 - DOI - PMC - PubMed

Publication types

MeSH terms