. 2018 Dec;596(24):6219-6233.
doi: 10.1113/JP276356. Epub 2018 Sep 19.

A simple decision to move in response to touch reveals basic sensory memory and mechanisms for variable response times

Affiliations

A simple decision to move in response to touch reveals basic sensory memory and mechanisms for variable response times

Stella Koutsikou et al. J Physiol. 2018 Dec.

Abstract

Key points: Short-term working memory and decision-making are usually studied in the cerebral cortex; in many models of simple decision making, sensory signals build slowly and noisily to threshold to initiate a motor response after long, variable delays. When touched, hatchling frog tadpoles decide whether to swim; we define the long and variable delays to swimming and use whole-cell recordings to uncover the neurons and processes responsible. Firing in sensory and sensory pathway neurons is short latency, and too brief and invariant to explain these delays, while recordings from hindbrain reticulospinal neurons controlling swimming reveal a prolonged and variable build-up of synaptic excitation which can reach firing threshold and initiate swimming. We propose this excitation provides a sensory memory of the stimulus and may be generated by small reverberatory hindbrain networks. Our results uncover fundamental network mechanisms that allow animals to remember brief sensory stimuli and delay simple motor decisions.

Abstract: Many motor responses to sensory input, like locomotion or eye movements, are much slower than reflexes. Can simpler animals provide fundamental answers about the cellular mechanisms for motor decisions? Can we observe the 'accumulation' of excitation to threshold proposed to underlie decision making elsewhere? We explore how somatosensory touch stimulation leads to the decision to swim in hatchling Xenopus tadpoles. Delays measured to swimming in behaving and immobilised tadpoles are long and variable. Activity in their extensively studied sensory and sensory pathway neurons is too short-lived to explain these response delays. Instead, whole-cell recordings from the hindbrain reticulospinal neurons that drive swimming show that these receive prolonged, variable synaptic excitation lasting for nearly a second following a brief stimulus. They fire and initiate swimming when this excitation reaches threshold. Analysis of the summation of excitation requires us to propose extended firing in currently undefined presynaptic hindbrain neurons. Simple models show that a small excitatory recurrent-network inserted in the sensory pathway can mimic this process. We suggest that such a network may generate slow, variable summation of excitation to threshold. This excitation provides a simple memory of the sensory stimulus. It allows temporal and spatial integration of sensory inputs and explains the long, variable delays to swimming. The process resembles the 'accumulation' of excitation proposed for cortical circuits in mammals. We conclude that fundamental elements of sensory memory and decision making are present in the brainstem at a surprisingly early stage in development.

Keywords: Decision-making; Locomotion; Reticulospinal neurons; Somatosensory; Xenopus laevis.


Figures

Figure 1
Figure 1. Response times to the first flexion and ventral root burst of swimming to current pulse trunk skin stimulation
A, Xenopus tadpole with stimulus site marked (*) and frames from a video (stimulus at t = 0 ms). The tadpole (supported by pins in the neck region) flexes to unstimulated left side starting at 76 ms (arrowhead) and swims off. B, distribution of delays to the start of the 1st flexion of swimming. C, diagram of immobilised tadpole with stimulating and ventral root (VR) recording electrodes. D and E, motor nerve responses to 0.1 ms pulse to trunk skin (↓) to show when swimming started on the right, unstimulated side (red arrowheads). F, distribution of delays to the first ventral root spikes when swimming started on the unstimulated side. Numbers in brackets on graphs are median and interquartile range (IQR).
Figure 2
Figure 2. Firing times in sensory pathway DLC neurons following a trunk skin stimulus
A, diagram to show the location of electrodes and the recorded neuron. B, ten superimposed responses in a DLC. Delays to the EPSP (grey arrowheads) give the sensory RB spike times and DLC spikes are clear (red arrowheads). C, spike time raster plots for RBs (grey squares) and DLCs (coloured circles: 1st spikes filled, 2nd/3rd spikes open; n = 9 DLCs). D, spike latency plots of RBs and DLCs.
Figure 3
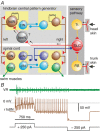
Figure 3. The tadpole swimming network and role of reticulospinal hdIN neurons
A, diagram of the touch sensory pathways to the opposite side from the head and trunk skin, and the hindbrain and spinal neurons controlling swimming. Tt, trigeminal touch sensory; RB, Rohon‐Beard touch sensory; DLC, dorsolateral commissural sensory pathway; hexN, hindbrain extension neurons; hdIN, hindbrain descending interneurons; cIN, reciprocal inhibitory commissural interneurons; aIN, recurrent inhibitory ascending interneurons; mn, motoneurons. Red triangles are glutamatergic excitatory synapses. Blue circles are glycinergic inhibitory synapses. Synapses onto a box connect to all neurons in the box. B, recording from a right hdIN where activity in the whole swimming network (seen in left ventral root (VR): green trace) could be initiated by positive current and terminated by negative current into this single neuron. The right hindbrain was transected just caudal to the otic capsules (see Fig. 1 C).
Figure 4
Figure 4. Responses of reticulospinal hdIN neurons to contralateral trunk skin stimulation
A, diagram to show the location of electrodes and the recorded hdIN neuron. B, anatomy of hdIN revealed by neurobiotin filling. C, examples of 4 hdIN responses to trunk skin stimulus. Arrowheads mark 1st spike. D and E, hdIN 1st spike time raster plot and 1st spike delays (n = 80 trials in 13 hdINs).
Figure 5
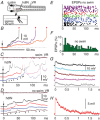
Figure 5. Summation of EPSPs to firing threshold in reticulospinal hdINs following a trunk skin stimulus on the opposite side
A, neurobiotin fill of the neuron in the left caudal hindbrain recorded in BD (box location as in Fig. 4 A.) B, three superimposed responses (from C) to contralateral stimuli evoking swimming show the noisy rise of excitation towards spike threshold (spike onsets marked by red arrowheads). C and D, recordings show variability in EPSP summation in responses to trunk skin stimulation just above (C) and below (D) swim threshold (see ventral root (VR)). Arrowheads mark example EPSPs and responses are offset for clarity. Asterisks mark artifacts due to spikes in another hdIN recording electrode on the other side. E and F, raster plots of EPSP latencies in response to skin stimuli at t = 0 where each colour is a different hdIN and each row is a different response. E, EPSPs up to the time of the first hdIN spike of swimming (14 hdINs). F, EPSPs to stimuli below swimming threshold (6 hdINs), persist for more than 150 ms after the stimulus. G, EPSP latency distributions for responses in F. H, slower time scale recordings show long duration of responses below swim threshold. Arrowheads mark example EPSPs. I, the long duration of the excitation is clear from an average of the 5 responses in H. J and K, raster plots and distributions of EPSP latencies, as in F and G, in animals with the midbrain removed.
Figure 6
Figure 6. Summation of EPSPs to firing threshold in reticulospinal hdINs following a head skin stimulus on the opposite side
A, diagram to show the location of electrodes. The inset is the hdIN neuron recorded in C and D. B and C, responses of hdINs to head skin stimulation (at arrow). B, three superimposed responses from different neurons leading to firing (red arrowheads). Dotted line shows resting potential. C and D, responses of hdIN in A to stimuli above (C) and below (D) threshold for the hdIN spike and swimming (see VR traces at top of panels) Arrowheads mark example EPSPs. E, raster plot of EPSP latencies from 5 hdINs (different colours) over the first 150 ms after the stimulus when swimming did not occur. F, EPSP latency distributions for responses in E. G, slower time scale recordings of responses below swim threshold show the prolonged responses in another hdIN. H, an average of responses in G.
Figure 7
Figure 7. Recurrent models of reticulospinal hdIN excitation and recruitment
A, recurrent hexN network excited by single spikes in 30 sensory pathway DLCs with 5 hdINs to monitor output. B–D, responses to 30 DLC spikes. Raster plots show spike times for DLCs (black) and hexNs (colours); stimulus to DLCs at arrow. Lower panels show selected hdIN voltage records. The hexNs produce variable, summating EPSPs in hdINs (black arrowheads). EPSP summation can reach threshold (dashed red line) and lead to hdIN firing (red arrowhead) after variable delays. D, when hexN firing is brief, EPSPs sum but do not reach hdIN firing threshold (all five traces separated for clarity). E, histogram of all hexN firing times in 30 trials of a single network. F, model of a population of 30 hdINs with electrical coupling and feedback glutamate excitation (Hull et al. 2015) excited by hexN spikes at times determined by the hexN recurrent network model. G–I, overlapped voltage records of all 30 hdINs in response to hexN excitation in one trial. G, excitation can sum to threshold so hdINs are recruited to spike rhythmically and almost synchronously. H, in another trial the EPSPs sum but do not reach hdIN firing threshold (some traces separated for clarity). I, without electrical coupling, hdINs fire earlier and then asynchronously. All voltage scales as in B and G.

References

    1. Aksay E, Olasagasti I, Mensh BD, Baker R, Goldman MS & Tank DW (2007). Functional dissection of circuitry in a neural integrator. Nat Neurosci 10, 494–504. - PMC - PubMed
    1. Arber S ( 2012). Motor circuits in action: specification, connectivity, and function. Neuron 74, 975–989. - PubMed
    1. Bogacz R, Wagenmakers EJ, Forstmann BU & Nieuwenhuis S (2010). The neural basis of the speed‐accuracy tradeoff. Trends Neurosci 33, 10–16. - PubMed
    1. Boothby KM & Roberts A (1995). Effects of site and strength of tactile stimulation on the swimming responses of Xenopus laevis embryos. J Zool (Lond) 235, 113–125.
    1. Brody CD & Hanks TD (2016). Neural underpinnings of the evidence accumulator. Curr Opin Neurobiol 37, 149–157. - PMC - PubMed

Publication types