

Trends in Dental Implant Use in the U.S., 1999-2016, and Projections to 2026
- PMID: 30075090
- PMCID: PMC6854267
- DOI: 10.1177/0022034518792567
Trends in Dental Implant Use in the U.S., 1999-2016, and Projections to 2026
Abstract
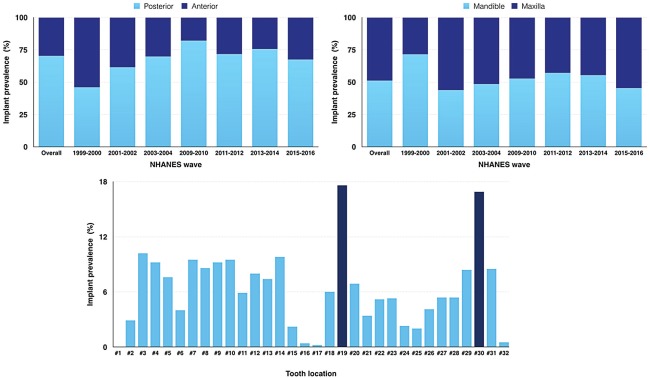
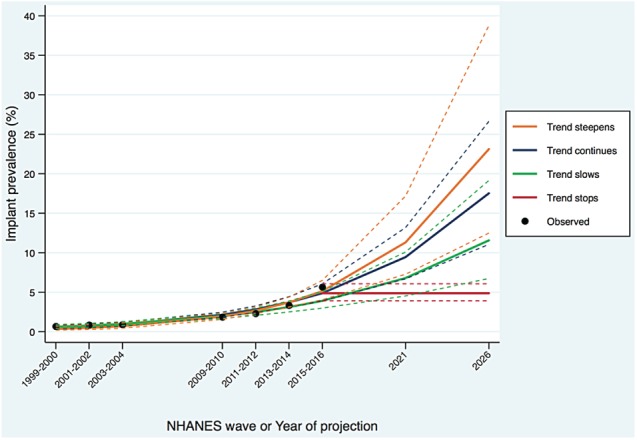
Dental implants have become an increasingly popular treatment choice for replacing missing teeth. Yet, little is known about the prevalence and sociodemographic distribution of dental implant use in the United States. To address this knowledge gap, we analyzed data from 7 National Health and Nutrition Examination Surveys from 1999 to 2016. We estimated dental implant prevalence among adults missing any teeth for each survey period overall as stratified by sociodemographic characteristics. We calculated absolute and relative differences from 1999-2000 to 2015-2016 and fit logistic regression models to estimate changes over time. We also used multivariable logistic regression to estimate independent associations of sociodemographic covariates with the presence of any implant. We projected the proportion of patients treated with dental implants into the year 2026 under varying assumptions of how the temporal trend would continue. There has been a large increase in the prevalence of dental implants, from 0.7% in 1999 to 2000 to 5.7% in 2015 to 2016. The largest absolute increase in prevalence (12.9%) was among individuals 65 to 74 y old, whereas the largest relative increase was ~1,000% among those 55 to 64 y old. There was an average covariate-adjusted increase in dental implant prevalence of 14% per year (95% CI, 11% to 18%). Having private insurance (vs. none or public insurance) or more than a high school education (vs. high school or less) was each associated with a 2-fold increase in prevalence, with an almost 13-fold (95% CI, 8 to21) increase for older adults. Dental implant prevalence projected to 2026 ranged from 5.7% in the most conservative scenario to 23% in the least. This study demonstrates that dental implant prevalence among US adults with missing teeth has substantially increased since 1999. Yet access overall is still very low, and prevalence was consistently higher among more advantaged groups.
Keywords: National Health and Nutrition Examination Survey; cross-sectional studies; dental care; endosseous dental implantation; prevalence; projection.
Conflict of interest statement
The authors declare no potential conflicts of interest with respect to the authorship and/or publication of this article.
Figures
References
-
- Alkan EA, Mau LP, Schoolfield J, Guest GF, Cochran DL. 2018. Prevalence of dental implants and evaluation of peri-implant bone levels in patients presenting to a dental school: a radiographic cross-sectional 2-year study. Int J Oral Maxillofac Implants. 33(1):145–151. - PubMed
-
- Annibali S, Cristalli MP, Dell’Aquila D, Bignozzi I, La Monaca G, Pilloni A. 2012. Short dental implants: a systematic review. J Dent Res. 91(1):25–32. - PubMed
-
- Battle-Siatita SO, Bartoloni JA, Hancock RH, Chong CH. 2009. Retrospective analysis of dental implants among United States Air Force basic military trainees. Mil Med. 174(4):437–440. - PubMed
-
- Brånemark PI, Adell R, Breine U, Hansson BO, Lindström J, Ohlsson A. 1969. Intra-osseous anchorage of dental prostheses: I. Experimental studies. Scand J Plast Reconstr Surg. 3(2):81–100. - PubMed
-
- Buser D, Sennerby L, De Bruyn H. 2017. Modern implant dentistry based on osseointegration: 50 years of progress, current trends and open questions. Periodontol 2000. 73(1):7–21. - PubMed
Publication types
MeSH terms
Substances
Grants and funding
LinkOut - more resources
Full Text Sources
Other Literature Sources
Medical
Miscellaneous
