. 2018 Aug 2;23(2):210-225.e6.
doi: 10.1016/j.stem.2018.07.011.

Endothelial Regeneration of Large Vessels Is a Biphasic Process Driven by Local Cells with Distinct Proliferative Capacities

Affiliations

Endothelial Regeneration of Large Vessels Is a Biphasic Process Driven by Local Cells with Distinct Proliferative Capacities

Austin I McDonald et al. Cell Stem Cell. .

Abstract

The cellular and mechanistic bases underlying endothelial regeneration of adult large vessels have proven challenging to study. Using a reproducible in vivo aortic endothelial injury model, we characterized cellular dynamics underlying the regenerative process through a combination of multi-color lineage tracing, parabiosis, and single-cell transcriptomics. We found that regeneration is a biphasic process driven by distinct populations arising from differentiated endothelial cells. The majority of cells immediately adjacent to the injury site re-enter the cell cycle during the initial damage response, with a second phase driven by a highly proliferative subpopulation. Endothelial regeneration requires activation of stress response genes including Atf3, and aged aortas compromised in their reparative capacity express less Atf3. Deletion of Atf3 reduced endothelial proliferation and compromised the regeneration. These findings provide important insights into cellular dynamics and mechanisms that drive responses to large vessel injury.

Keywords: angiogenesis; endothelial progenitor; single-cell sequencing; vascular; vascular repair.


Conflict of interest statement

Disclosure of Conflicts of Interest:

The authors have no conflicts to disclose.

Figures
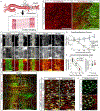
Figure 1.
Figure 1.. Kinetics of Endothelial Regeneration.
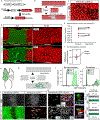
(A) Schema of aortic injury and dissection procedure for en face imaging. (B) Images demonstrating removal of endothelial cells by clamp injury, VE-Cadherin staining (red) and fibrin (green). Scale bar=50µm. (C) Regeneration of the endothelial lining over time. Top, fibrin staining highlights endothelial injury (yellow dotted lines). Regenerated area shows residual dim fibrin (blue dotted lines). Second from top, endothelial cell coverage, VE-Cadherin (red). Third from top, merged images. Scale bar=800µm. (D) Kinetics of lining regeneration. Denuded area (yellow area in C) decreases as the regenerated area marked by residual fibrin (blue area in C) increases. Each dot represents one animal/injury. n=5 animals/point (average +/− SD). (E) Left, plot of regeneration, defined by regenerated area over original wound width. Straight lines indicate linear regressions; dotted lines indicate 95% confidence prediction values based on regressions. Right, rates of endothelialization along the vessel’s long axis. n=4 animals/point (average +/− SD). (F) Polarization of endothelial cells during regeneration. VE-Cadherin (red) and Giantin (green) to mark Golgi. Areas shown in next panel are indicated by the white boxes. Blue dotted line: original clamped area (injury). Yellow dotted line: leading edges of regenerating endothelial lining. Scale bar=800µm. (G) High magnification showing endothelial polarity as defined by Golgi complex (Giantin, green) in relation to the nucleus (DAPI staining, white). In regenerating regions, the Golgi complex aligns with the direction of regeneration rather than with flow. Upstream (panel c) and downstream (panel d) wound edges marked with white arrows indicate the location of the Golgi. Scale bar=20µm. (H) DAPI (white), Notch1-ICD (green), and VE-Cadherin (red) at the regenerating front (yellow dotted line). Arrows indicate Notch1 protein at edge of the regenerative front during arterial endothelium regeneration. Scale bar=10µm. See also Figure S1 and Video S1.
Figure 2.
Figure 2.. Distribution of Proliferative Cells in the Regenerated Zone
(A) Timeline of experimental design and data points. EdU was injected 2hrs prior to sacrifice. (B) Graphical representation of hypotheses. (C) Colocalization of EdU+ (red) and Erg+ (green) nuclei. Aortae harvested 48hrs postinjury. White boxes (top) indicate areas of high magnification (bottom). Scale bars= 800µm (upper) and 20µm (lower). (D) EdU+ nuclei fraction after a pulse of 2h, 48h post-injury. n=5 aortae evaluated 400µm2 to the right and left of the wound (mean +/−SD). (E) Images depicting localization of EdU+ nuclei (white) in the regeneration zone. Scale bar=800µm. (F) Quantification and distribution of proliferating cells in the regenerating zone. Each row represents one aorta. Dotted line indicates geometric center of wound. Every positive cell was placed in the exact location in relation to the center of the wound. Negative values, position upstream of wound; positive values, downstream. (G) Fraction of EdU+ cells in the regenerating front upstream and downstream of blood flow. Each dot represents one individual animal (average +/−SD). (H) Plot of the estimate of endothelial cells generated prior to wound closure as determined by EdU (green area under curve) and number observed to be proceeding through the cell cycle following wound closure (blue area under the curve). Dotted lines represent upper and lower SD. Each dot is average of EdU+ cells/animal. (I) Hyperdensity following wound closure is shown by Erg positivity (white). Shown is 5 days post-injury (dpi) and resolution of this hyperdensity at 2 months post-injury (mpi). Number (n) of nuclei in that area is shown on the bottom right. Scale bar=20µm
Figure 3.
Figure 3.. Cellular Origins of Regenerated Endothelium
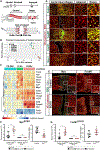
(A) Genetic system used to label endothelial cells immediately prior to regeneration. (B) Illustration indicating the possible outcomes of the experiment. (C) Detection of tdTomato positive and negative cells based on Erg co-staining (white). Penetration of Cre (as per tdTomato) can be variable, and thus, endothelial-dependent regenerated area should be “normalized” to percentage of Cre penetration in the non- regenerated area of the same animal. Scale bar=20 µm. (D) Aortae of mice sacrificed at 1 day and 30 days (right) post-injury (dpi). Top right shows mouse with >99% labeling efficiency; bottom right shows 94% efficiency. Scale bar=800 µm. (E) Quantification of tdTomato positive cells within the uninjured area and the regenerated area per individual mouse using the method demonstrated in Video S2 Figure S3. n=9 mice evaluated. (F) Mean and 95% confidence interval boundaries on the contribution by non-endothelial cells, based on paired t-test quantifications. n=9 mice. (G) Diagram depicting the parabiosis of GFP+ and GFP- mice to create blood chimerism. (H) Illustration indicating the possible outcomes of the experiment. (I) Flow cytometry of blood from GFP+ (left) and GFP- (right) members of parabiosed mice to assess chimerism by GFP expression. Data is representative of all pairs used. (J) Images from GFP+ (left) and GFP- (right) members of parabiosed mice assessing regeneration of endothelium detected by Erg staining (top) and CD45+ staining to identify inflammatory cells (bottom). Non-endothelial GFP+ cells in the aortic media are indicated (white arrows) and those were also always CD45+. Scale bar=800 µm. (K) Images of GFP+ and GFP- members of parabiosed mice after regeneration (white arrows). Green outlines track GFP+ cell locations for co-localization with other stains. Some instances require examination in 3D to resolve (insets, white arrows). Scaled bar=10 µm. (L) Quantitation of Erg and CD45 staining for all GFP+ cells in the regenerated lining of all mice examined. Two parabiosed pairs were quantified and the number of cells evaluated for each animal is indicated. See also Video S2.
Figure 4.
Figure 4.. Clonal Tracing Detects Cells with Distinct Proliferative Potential in the Endothelial Lining
(A) Multicolor fluorescence (“Rainbow”) genetic labeling system used to label single endothelial cells. Mutually exclusive lox variants allow one of three fluorescent proteins to be expressed following tamoxifen-induced recombination. (B) Graphical representation of possible outcomes. (C) Images demonstrating clonal density by a highly diluted tamoxifen-induced labeling. The area of injury is visible as dimmed GFP fluorescence (white) (top panel). Representative clones in the uninjured (bottom left in “a”) and regenerated (bottom right in “b”) area of endothelial lining are shown at high magnification. Co-staining with Erg (white nuclei) allows for accurate clone size determination. Scale bar= 800µm (upper) and 20µm (lower). (D) Computational extraction of labeled cell locations using the method demonstrated in Video S3. (E) Spatial clustering algorithm dbscan with a distance threshold parameter of 150 microns was used to identify clones. (F) Quantification of labeling frequency, calculated as (Cerulean/mOrange/mCherry)+/ERG+ nuclei in uninjured areas. Error bars indicate 95% c.i. n=4mice. (G) Clone size distribution and curve fits. Scatter plot depicts cumulative frequency (Y- axis) of clones which are composed of n cells or less, normalized to the average n of the aorta. Clones labeled by the three different fluorescent proteins were pooled and each clone given equal weight. The dashed line displays the best fit of a negative exponential distribution, expected to arise from neutral competition between proliferating cells. The solid line shows the summation of two fitted curves, in effect modeling the presence of two populations with differing proliferative activities. n=8 aortae. (H) Breakdown of the solid line in g, showing the two negative exponential curves which compose it. Shaded areas indicate the area under each curve, corresponding to the proportion of cells derived from each population. See also Figure S2, S3 and Video S3.
Figure 5.
Figure 5.. Molecular Signature of Endothelial Regeneration
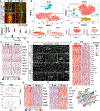
(A) Experimental timeline. Aortae were harvested 3 and 48 hours following arterial injury. Also illustrated are the experimental samples: control, regeneration at 3h and regeneration at 48h. Note that the control (thoracic region) was isolated from the same animal as the regeneration injury at 48h. Uninjured thoracic and abdominal aorta segments (“tissue”) were also collected for comparison, the sample is referred to as “tissue” because there is no flush, meaning the entire tissue was used in the RNA extraction. RNA “flush” collection method which shows enrichment of endothelial RNA is illustrated at the bottom where lysis buffer is injected through the lumen enriching for endothelial transcripts. Cells hypothesized to actively drive lining regeneration are highlighted in red. (B) Principal component analysis of collected transcriptomes. Note segregation of the four experimental groups. Tissue (purple), endothelial-enriched control (cyan), endothelial- enriched 3h post-injury (green) and endothelial-enriched 48h post-injury (red). (C) Transcriptional signature of regenerating aortic lining. Transcription factors with a statistically significant (FDR = .01) change in transcript level greater than 4-fold are shown. Each column represents one aorta/individual animal: Control 48h, n=9; Regenerated 3h, n=5; Regenerated 48h, n=9. (D) Images of injured aortae stained en face for select proteins to validate the information obtained by RNAseq analysis (C). Left column shows low magnification of aortae at 48hrs post-injury, in some cases the regeneration had just completed, VE-Cadherin and Erg (both in red). Middle column: expression pattern in an area adjacent to the injury (adjacent). Right column: expression in the regenerated area. Scale bar=20µm. (E) Mice with endothelial-specific inactivation of Myc and FoxM1 were subjected to injury. Wound closure rate and proliferation kinetics were compared to control litermates (Cre negative or not injected with tamoxifen). VE-Cadherin (red), Erg (green) and EdU (white). High magnification (bottom right) corresponds to the white box in the image. Scale bar=100µm. (F) Quantification of wound area and proliferation kinetics of the experiment shown in (E) for Myc effects. Wound closure evaluated at 48hrs and 96hrs hpi. Each dot represents one animal. Controls (black) and MycECKO (red) were injected two weeks prior to the injury. 48hrs hpi n=13 for controls (Cre+ tam injected n=3; Myclox/lox Cre- tam injected=6; and MycECKO non-injected=6) and n=7 for MycECKO. Graph shows mean +/− SD. Statistics= Mann-Whitney test *p=0.0063. For 96hpi MycECKO non-injected n=5 and MycECKO tam- injected n=3, ns = not significant. Graph (right) shows proliferative responses as per % of Erg positive EdU positive cells over total EdU positive cells (same mice as the ones described above for 48hpi). Mann Whitney test p=0.0004. (G) Quantification of wound area and proliferation kinetics for FoxM1 effects. Wound closure is evaluated at 48hrs and 96hrs hpi. Each dot represents one animal. Controls (black) and FoxM1ECKO (red) were injected two weeks prior to the injury. N=9 for controls (Cre+ tam injected n=3; FoxM1lox/lox Cre- tam injected=2; and FoxM1ECKO non-injected=4) and n=9 for FoxM1ECKO. Graph shows mean +/− SD. Statistics= Mann-Whitney **p=0.0078. For 96hpi FoxM1ECKO non-injected n=5 and FoxM1ECKO tam-injected n=3, ns = not significant. Graph (right) shows proliferative responses as per % of Erg positive EdU positive cells over total EdU positive cells (same mice as the ones described above for 48hpi). Mann Whitney test p=0.077. See also Figure S4, S5 and Table S1.
Figure 6.
Figure 6.. Cellular and Molecular Characterization of Endothelial Regeneration in Young and Aged Mice.
(A) Comparison of endothelial regeneration in young (8 weeks) and aged mice (18 months), VE-Cadherin(red), fibrin(green). Wound at 3hrs (upper) and 96hrs post-injury (lower). Bottom graph demonstrates the kinetics of wound closure in young (green dots) and aged mice (red dots). N=7 mice/time point. Mean +/−SD. Unpaired t-tests with Holm- Sidak correction for multiple comparisons (0h p=0.7509; 48h, 96h &120h ****p<0.0001). Bar=100µm. (B) Disney plots of single cell RNAseq of the uninjured aortic endothelium of mice at 8 weeks and 18months of age. The endothelial cell cluster was revealed by expression of Pecam1 and Cdh5 as shown in the lower graphs. (C) Transcription factors increased at 3hrs post injury in Figure 5 were evaluated against the uninjured aorta using the single cell data set. Atf3 was significantly increased in the young and nearly absent from the aged cohort, as shown in the heat map. (D) Shown is the subpopulation of Atf3 positive endothelial cells in 5,000 endothelial cells from young (8wk) and old(18mo) mice. (E) Immunofluorescence of Atf3 in unwounded and wounded aortae from young and aged mice. Bottom panel shows nuclear localization of Atf3 (green). Number of Atf3 positive cells near the wound is significantly reduced in old mice. Unwounded bars= 20µm. Wounded up and downstream bars=15µm, zoom bars=4 µm. (F) Single cell transcriptome of cells that expressed Atf3 was compared to cells that do not expressed Atf3 from the same 8 week aorta. Note the genetic signature associated with Atf3 expression reflects a large number of genes associated with response to stress/injury. (F) Comparison of the top upregulated and downregulated genes when the single cell transcriptomes of young versus aged mice are compared. Note the similarly between the unsupervised highly expressed genes in the young versus those genes associated with Atf3 expression in panel (E). (G) Unsupervised heat map of the genes upregulated in young endothelium when compared to old endothelium. Note that all those cells are also found in the subset of cells from the young aorta panel that do not express Atf3 in (F). (H) Unsupervised heat map of the genes downregulated in young endothelium when compared to old endothelium. (I) String analysis reveals previously acknowledged relationships between ATF3 and several of the genes identified in (F) and (G). See also Figure S6, S7 and Video S4.
Figure 7.
Figure 7.. Proliferation Kinetics and Atf3 Activity in Endothelial Cells
(A) Proliferation kinetics of aortic endothelial cells isolated from young (8wks) mice. Endothelial cells labeled with tdTomato were plated onto unlabeled mouse endothelial monolayers and recorded using IncuCyte™. The large majority of individual cells did not divide, as exemplified by Clone 1; while a small cohort was able to divide multiple times, as exemplified by Clone 2. Scale bar=50µm. This type of evaluation was expanded to include additional endothelial cells isolated from multiple young and old mice and quantified in (B). (B) Endothelial cell divisions from young (8wks) and old (18mo) mice were quantified over five days. The large majority of endothelial cells from the aorta of 8week mice do not divide (black), a few divided once (gray), less than 10% divide twice and approximately 12% divide at least three times. This contrasts the proliferative capacity of endothelial cells from older mice (18months). N=5 different aortas. Number clones evaluated: 353 (young) and 389 (old). (C) Diagram of the lentiviral Atf3-eGFP reporter construct with nuclear localization signal (3XNSL). Aortic endothelial cells infected with the Atf3 reporter construct (green) and tdTomato were followed over time (indicated on the upper left corner). Cells were continuously monitored for 5 days in the IncuCyte. Dividing cells turned on reporter (green). Scale bar=75µm. (D) Quantification of Atf3 reporter positive cells in young and old endothelium (from experiment shown in C). Each dot corresponds to one independent experiment in which 100 cells evaluated. A total of n=8 experiments were performed in each category. Data are presented as mean +/−SD Mann Whitney test p=0.0002. (E) Low magnification view of eGFP reporter after cells from in young and old aortae were infected with the lentiviral vector. Arrows denote positive cells. Scale bar=300µm. (F) Quantification of cells that show Atf3 reporter expression in young and old endothelium. Approximately 16% of cells were positive in young but only 2% of cells were positive in old endothelium. N=7 independent experiments. Data are presented as mean +/− SD. Mann-Whitney test p=0.0006. (G) Endothelial regeneration in the absence of Atf3. Proliferation kinetics were evaluated using EdU at 48hrs post-injury. Representative images of aortae injury are shown stained with VE-Cadherin (red), Erg (green) and EdU (white). Bottom panel, EdU Images at higher magnification. Scale bar=100µm. (H) Quantification of the proliferation kinetics in control and Atf3 knock out mice. N=8. Data are presented as mean +/−SD. Mann-Whitney test, p=0.0002. (I) Quantification of wound closure 96hpi in control and Aft3 knock out mice. Control n=5, Atf3KO n=4. Mann-Whitney test, p=0.007. See also Video S5.

Comment in

References

    1. Amati B, Alevizopoulos K, and Vlach J (1998). Myc and the cell cycle. Front Biosci 3, d250–68. - PubMed
    1. Asahara T, Murohara T, Sullivan A, Silver M, van der Zee R, Li T, Witzenbichler B, Schatteman G, and Isner JM (1997). Isolation of putative progenitor endothelial cells for angiogenesis. Science 275, 964–967. - PubMed
    1. Aung HH, Lame MW, Gohil K, An CI, Wilson DW, and Rutledge JC (2013). Induction of ATF3 gene network by triglyceride-rich lipoprotein lipolysis products increases vascular apoptosis and inflammation. Arterioscler Thromb Vasc Biol 33, 2088–2096. - PMC - PubMed
    1. Bozec A, Bakiri L, Jimenez M, Schinke T, Amling M, and Wagner EF (2010). Fra-2/AP-1 controls bone formation by regulating osteoblast differentiation and collagen production. J Cell Biol 190, 1093–1106. - PMC - PubMed
    1. Caplan BA, and Schwartz CJ (1973). Increased endothelial cell turnover in areas of in vivo Evans Blue uptake in the pig aorta. Atherosclerosis 17, 401–417. - PubMed

Substances