. 2018 Dec:183:7-24.
doi: 10.1016/j.neuroimage.2018.07.065. Epub 2018 Jul 31.

A robust multi-scale approach to quantitative susceptibility mapping

Affiliations

A robust multi-scale approach to quantitative susceptibility mapping

Julio Acosta-Cabronero et al. Neuroimage. 2018 Dec.

Abstract

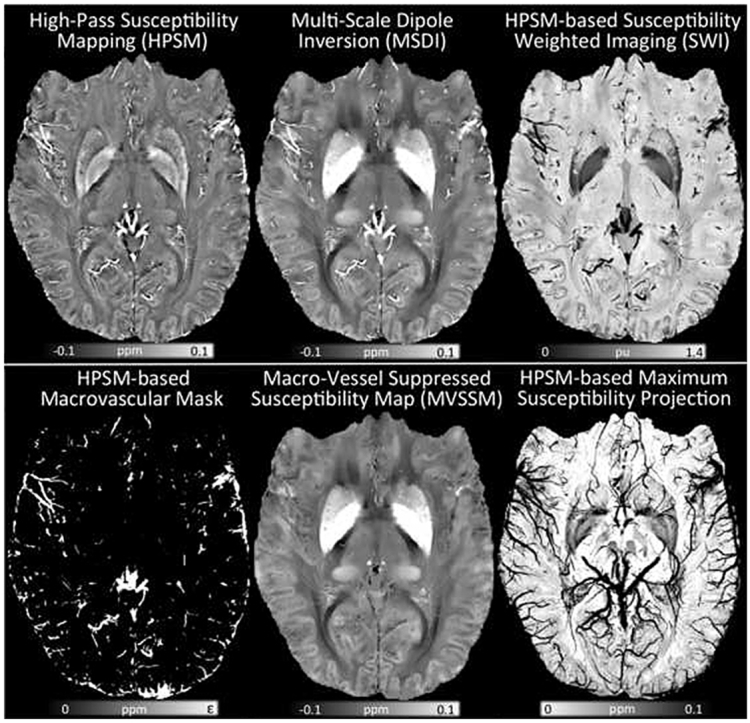
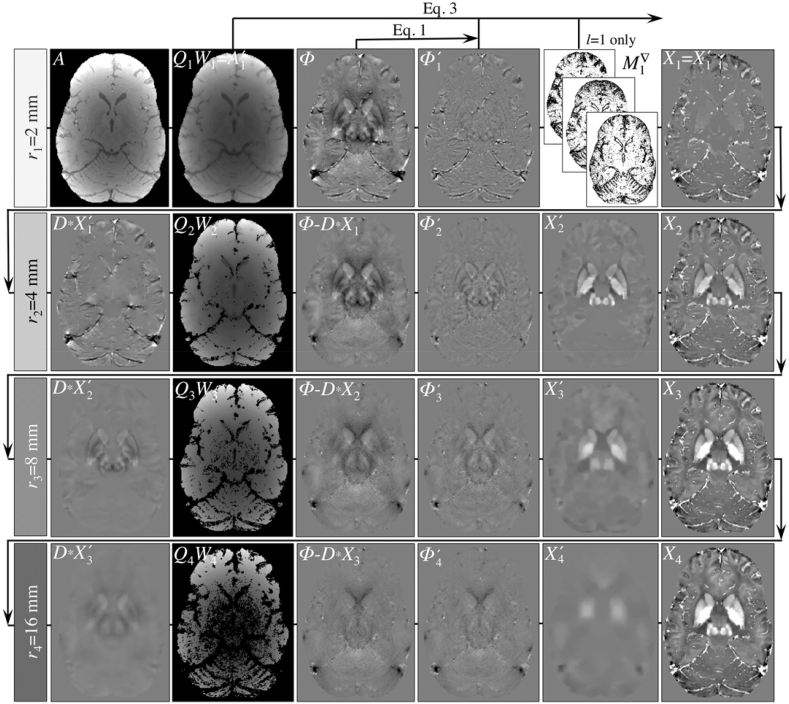
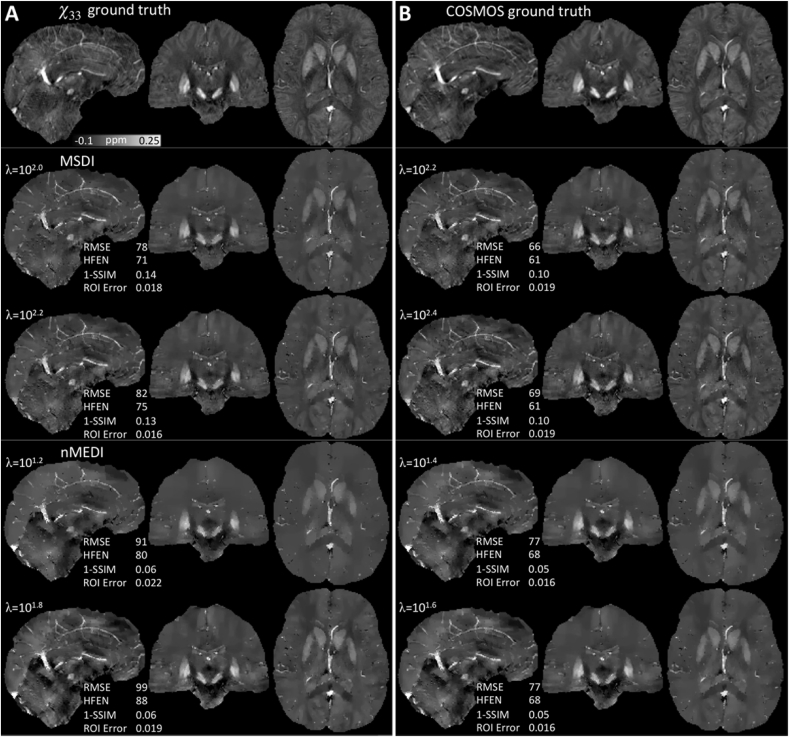
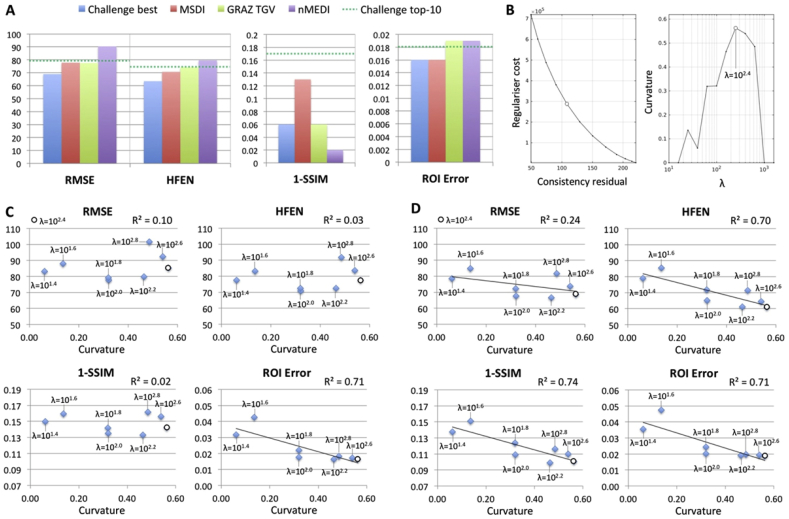
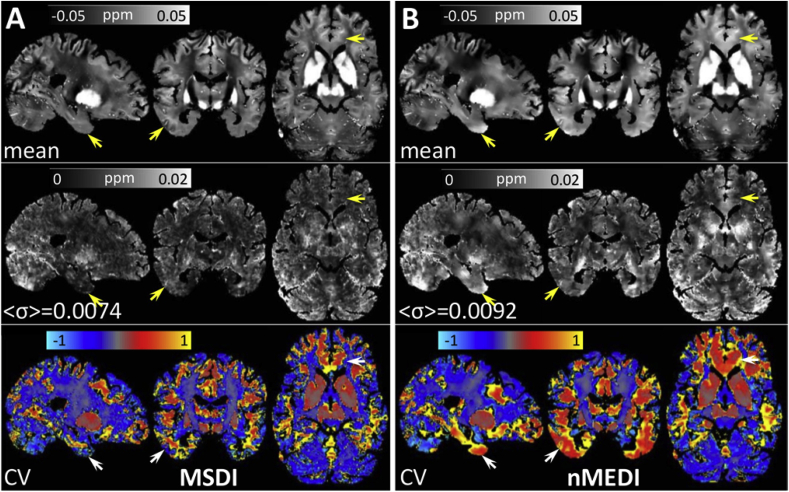
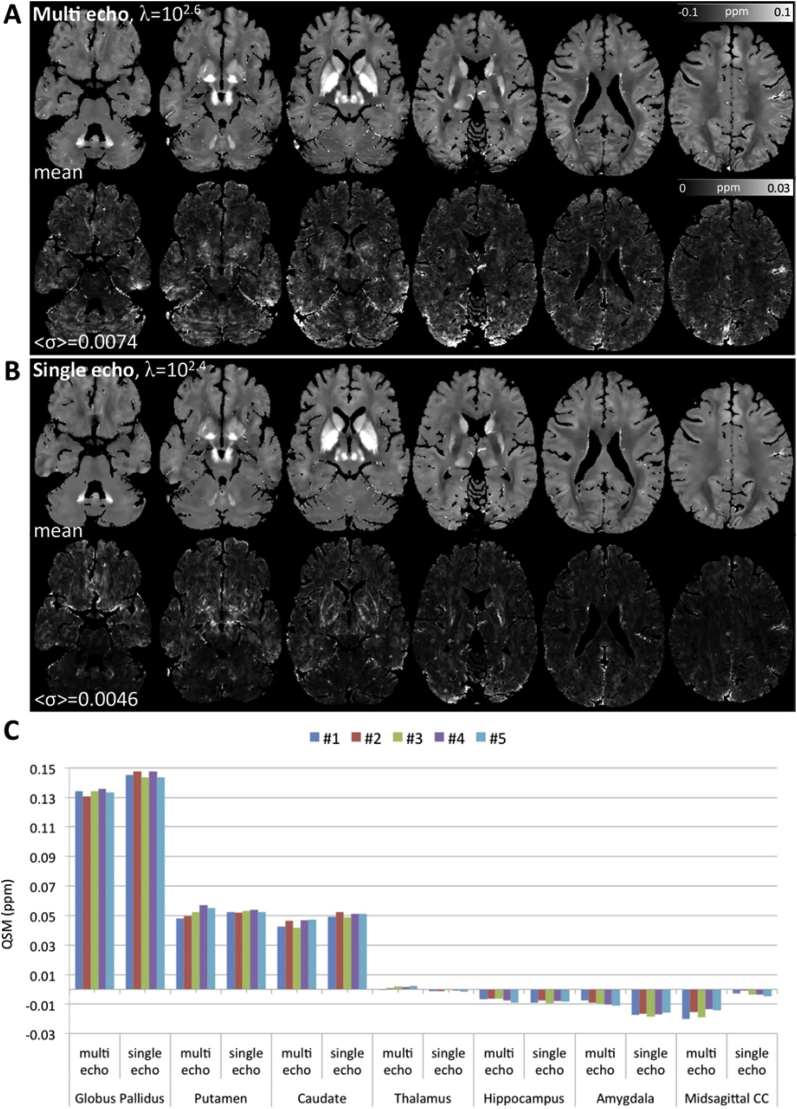
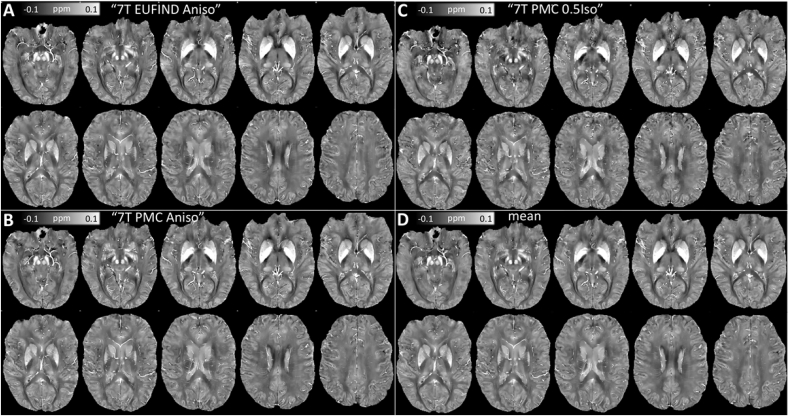
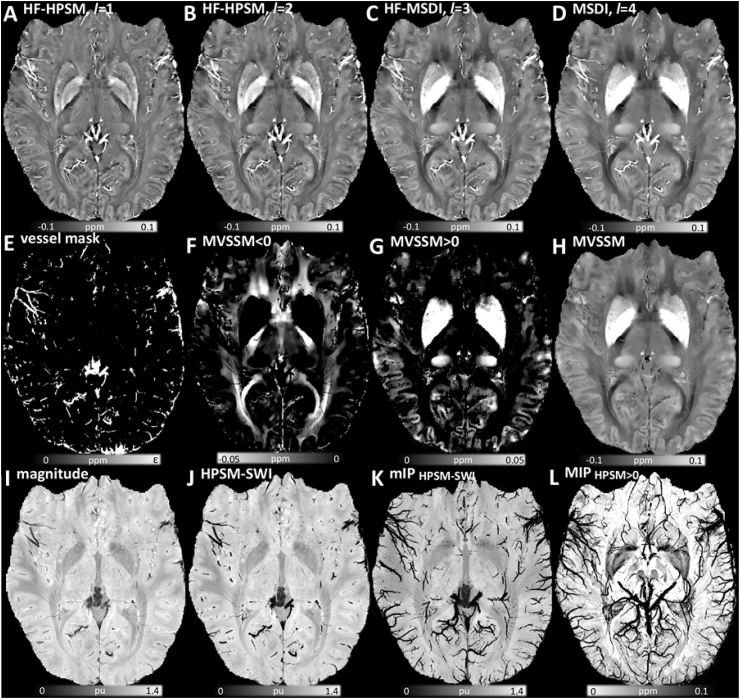
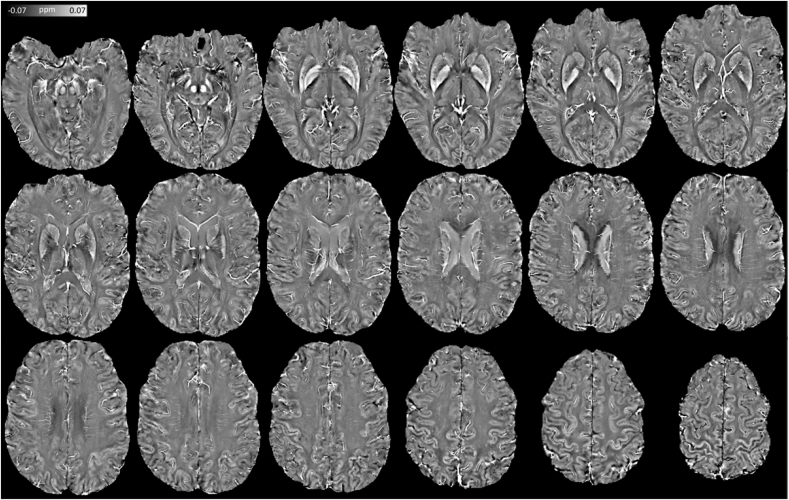
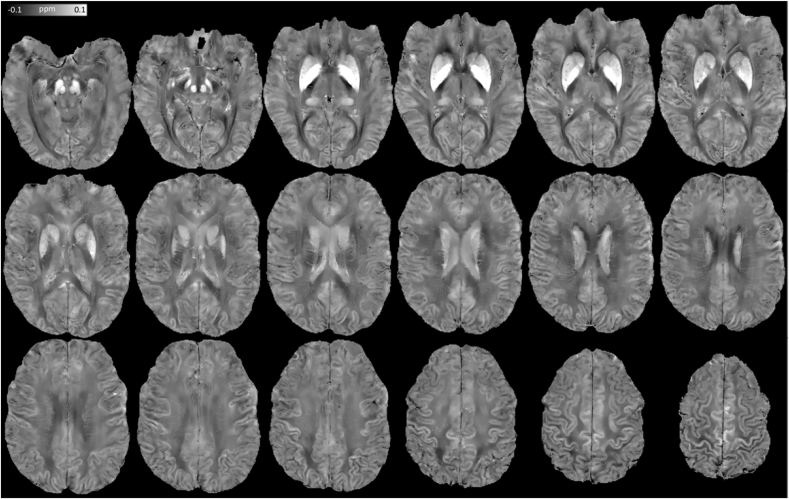
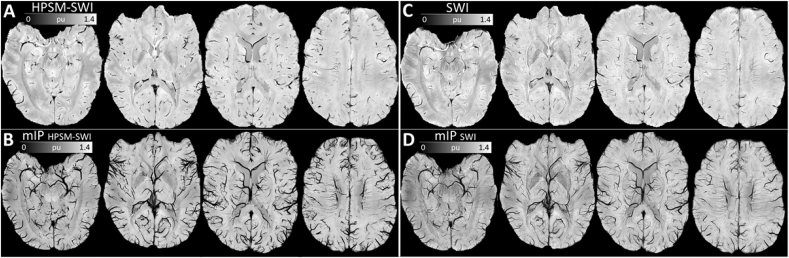
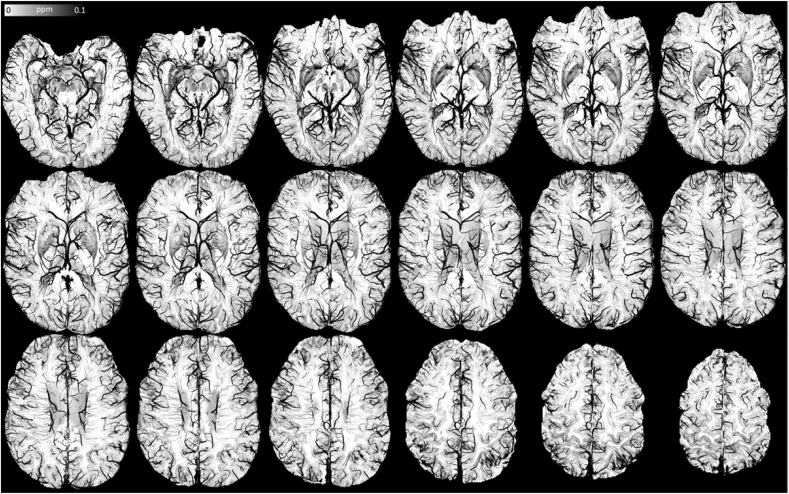
Quantitative Susceptibility Mapping (QSM), best known as a surrogate for tissue iron content, is becoming a highly relevant MRI contrast for monitoring cellular and vascular status in aging, addiction, traumatic brain injury and, in general, a wide range of neurological disorders. In this study we present a new Bayesian QSM algorithm, named Multi-Scale Dipole Inversion (MSDI), which builds on the nonlinear Morphology-Enabled Dipole Inversion (nMEDI) framework, incorporating three additional features: (i) improved implementation of Laplace's equation to reduce the influence of background fields through variable harmonic filtering and subsequent deconvolution, (ii) improved error control through dynamic phase-reliability compensation across spatial scales, and (iii) scalewise use of the morphological prior. More generally, this new pre-conditioned QSM formalism aims to reduce the impact of dipole-incompatible fields and measurement errors such as flow effects, poor signal-to-noise ratio or other data inconsistencies that can lead to streaking and shadowing artefacts. In terms of performance, MSDI is the first algorithm to rank in the top-10 for all metrics evaluated in the 2016 QSM Reconstruction Challenge. It also demonstrated lower variance than nMEDI and more stable behaviour in scan-rescan reproducibility experiments for different MRI acquisitions at 3 and 7 Tesla. In the present work, we also explored new forms of susceptibility MRI contrast making explicit use of the differential information across spatial scales. Specifically, we show MSDI-derived examples of: (i) enhanced anatomical detail with susceptibility inversions from short-range dipole fields (hereby referred to as High-Pass Susceptibility Mapping or HPSM), (ii) high specificity to venous-blood susceptibilities for highly regularised HPSM (making a case for MSDI-based Venography or VenoMSDI), (iii) improved tissue specificity (and possibly statistical conditioning) for Macroscopic-Vessel Suppressed Susceptibility Mapping (MVSSM), and (iv) high spatial specificity and definition for HPSM-based Susceptibility-Weighted Imaging (HPSM-SWI) and related intensity projections.

Keywords: Iron mapping; Laplacian pyramid; Magnetic susceptibility; Quantitative MRI; Variational regularisation; Venography.


Figures

Image 1
Graphical abstract
Fig. 1
Fig. 1
Schematic illustration of the proposed multi-scale dipole inversion (MSDI) method. Each row illustrates the application of Eqs. (1), (2), (3), (4)) across spatial scales. The routine is initialised with SMV filtering with a small kernel radius of 2 mm. The first-scale deconvolution operation uses magnitude priors to ensure accurate depiction of the vasculature and other focal susceptibility gradients if they are co-localised with rapid magnitude variations. Gradually increasing the background-filtering kernel radius in subsequent scales (without using the magnitude prior) gradually recovers sparse susceptibility distributions from increasingly larger-scale fields. In MSDI, to control for the impact of data inconsistencies, a weighting matrix, Wl, is applied to compensate for phase-noise non-uniformities in a scale-dependent manner. In addition, the masking rule imposed by Ql increasingly lowers the threshold for exclusion of noisy phase-neighbourhoods from the data fidelity term.
Fig. 2
Fig. 2
Challenge results. Optimal MSDI (middle row) and nMEDI solutions (bottom row) minimising different performance metrics with respect to (A) χ33 and (B) COSMOS ground truths (both shown on the top row). The QSM range was clipped to [-0.1, 0.25] ppm for consistency with the Challenge report (Langkammer et al., 2018).
Fig. 3
Fig. 3
Challenge results. (A) MSDI's relative performance using the χ33 ground truth. Lower values indicate better performance. “Challenge best” denotes the best method for each metric (i.e. metric-specific best). Top-10 algorithms in the Challenge scored 79.1% (RMSE), 74.2% (HFEN), 0.17 (1-SSIM) and 0.018 (ROI Error) or below. GRAZ TGV denotes performance for a Total Generalised Variation (TGV) single-step method (Langkammer et al., 2015) that entered the QSM Workshop Challenge. (B) MSDI's L-curve analysis results (“optimal λ”, i.e. point of maximum curvature, denoted by an open circle). Algorithm performance as a function of maximum L-curvature using (C) χ33 and (D) COSMOS ground-truth references.
Fig. 4
Fig. 4
(A) MSDI and (B) nMEDI summary statistics for a reproducibility experiment in which the same “3T Multi-Echo” sequence was used to scan the same 38 y. o. healthy male subject on five consecutive days. (Top row) Representative sagittal, coronal and axial slices for mean QSM over five time-points. (Middle row) Standard deviation (σ) over the same five time points, with <σ> inset representing the average σ across the whole brain. (Bottom row) Coefficient of QSM variation across repetitions (CV = σ/mean). Arrows indicate regions of greater unexplained variation for nMEDI than for MSDI. Though for simplicity arrows are shown unilaterally, regions of high variance are typically bilateral. The opposite behaviour (greater variation for MSDI) was not observed.
Fig. 5
Fig. 5
(A) “3T Multi-Echo” and (B) “3T Single-Echo” MSDI reproducibility test results for data from the same subject scanned on five consecutive days with both acquisitions. In each panel, top and bottom rows represent axial cuts for the QSM mean and standard deviation (σ) across time-points respectively. (C) Regional study for the same data; each colour bar represents the median QSM for a given scan-type and time-point. Abbreviation: corpus callosum (CC).
Fig. 6
Fig. 6
Representative axial slices for MSDI reconstructions of: (A) “ 7T EUFIND Aniso”, (B) “7T PMC Aniso”, and (C) “7T PMC 0.5Iso” data in a common space. (D) Mean macroscopic susceptibility across scan types.
Fig. 7
Fig. 7
Sample illustration of MSDI-related contrasts from “7T PMC Aniso” data. High fidelity (HF) HPSM: (A) rmax = 2 mm, λ = 103.3. (B) HF-HPSM, rmax = 4 mm, λ = 103.1. (C) HF-MSDI, rmax = 8 mm, λ = 102.9. (D) Full-scale MSDI, rmax = 16 mm, λ = 102.7. (E) Positive-only mask from highly regularised HPSM, rmax = 2 mm, λ = 101.6 (i.e. binary mask of the macro-vasculature). (F) Negative-only distribution for MVSSM. (G) Positive-only MVSSM distribution. (H) Full-range MVSSM. (I) RF-bias corrected magnitude image normalised to the whole-brain mean. (J) Highly regularised HPSM based SWI, rmax = 2 mm, λ = 101.6. (K) Minimum-intensity projection map (mIP over 7.5 mm) for HPSM-SWI. (L) Maximum-intensity projection (MIP over 15 mm) for optimally regularised HPSM, rmax = 2 mm, λ = 102.7 (note reversed colour scale for consistency with conventional mIPSWI contrast). Abbreviations: MSDI (Multi-Scale Dipole Inversion), rl (kernel radius defining Sl and its complement in Eqs. (1), (2), (3))), λ (regularisation parameter in Eq. (3)), HPSM (High-Pass Susceptibility Mapping), MVSSM (Macro-Vessel Suppressed Susceptibility Mapping), HPSM-SWI (HPSM-based Susceptibility Weighted Imaging).
Fig. 8
Fig. 8
Extended view of high fidelity (λ = 103.3), high-pass (rmax = 2 mm) susceptibility mapping (HF-HPSM) using “7T PMC Aniso” data.
Fig. 9
Fig. 9
Extended view of optimally regularised (λ = 102.7), full-scale (r1-4 = 2, 4, 8, 16 mm), macro-vessel suppressed susceptibility mapping (MVSSM) from “7T PMC Aniso” data.
Fig. 10
Fig. 10
Representative axial slices of (A) highly regularised HPSM-based SWI (HPSM-SWI, rmax = 2 mm, λ = 101.6), and (B) minimum-intensity projections (mIP) over 7.5 mm. Same view for (C) conventional SWI (using a 300 × 300 2D Hanning kernel – the smallest window size for which wrapping errors were not introduced in the weighting mask), and (D) mIP-SWI over 7.5 mm. All maps were inferred from the same dataset (“7T PMC Aniso”), and were normalised by the global mean magnitude across the whole brain prior to post-hoc susceptibility weighting.
Fig. 11
Fig. 11
Extended view of the maximum-intensity projection over 15 mm from optimally regularised HPSM (rmax = 2 mm, λ = 102.7) using “7T PMC Aniso” data. Note reversed colour scale, i.e. high susceptibility values are hypointense, for consistency with mIP-SWI.

References

    1. Abdul-Rahman H.S., Gdeisat M.A., Burton D.R., Lalor M.J., Lilley F., Moore C.J. Fast and robust three-dimensional best path phase unwrapping algorithm. Appl. Optic. 2007;46:6623–6635. - PubMed
    1. Acosta-Cabronero J., Betts M.J., Cardenas-Blanco A., Yang S., Nestor P.J. In Vivo MRI mapping of brain iron deposition across the adult lifespan. J. Neurosci. 2016;36:364–374. - PMC - PubMed
    1. Acosta-Cabronero J., Cardenas-Blanco A., Betts M.J., Butryn M., Valdes-Herrera J.P., Galazky I., Nestor P.J. The whole-brain pattern of magnetic susceptibility perturbations in Parkinson's disease. Brain. 2017;140:118–131. - PubMed
    1. Acosta-Cabronero J., Machts J., Schreiber S., Abdulla S., Kollewe K., Petri S., Spotorno N., Kaufmann J., Heinze H.J., Dengler R., Vielhaber S., Nestor P.J. Quantitative susceptibility MRI to detect brain iron in amyotrophic lateral sclerosis. Radiology. 2018 https://doi.org/10.1148/radiol.2018180112 - DOI - PMC - PubMed
    1. Acosta-Cabronero J., Williams G.B., Cardenas-Blanco A., Arnold R.J., Lupson V., Nestor P.J. In vivo quantitative susceptibility mapping (QSM) in Alzheimer's disease. PLoS One. 2013;8 e81093. - PMC - PubMed

Publication types