

ER-to-lysosome-associated degradation of proteasome-resistant ATZ polymers occurs via receptor-mediated vesicular transport
- PMID: 30076131
- PMCID: PMC6120659
- DOI: 10.15252/embj.201899259
ER-to-lysosome-associated degradation of proteasome-resistant ATZ polymers occurs via receptor-mediated vesicular transport
Abstract
Maintenance of cellular proteostasis relies on efficient clearance of defective gene products. For misfolded secretory proteins, this involves dislocation from the endoplasmic reticulum (ER) into the cytosol followed by proteasomal degradation. However, polypeptide aggregation prevents cytosolic dislocation and instead activates ill-defined lysosomal catabolic pathways. Here, we describe an ER-to-lysosome-associated degradation pathway (ERLAD) for proteasome-resistant polymers of alpha1-antitrypsin Z (ATZ). ERLAD involves the ER-chaperone calnexin (CNX) and the engagement of the LC3 lipidation machinery by the ER-resident ER-phagy receptor FAM134B, echoing the initiation of starvation-induced, receptor-mediated ER-phagy. However, in striking contrast to ER-phagy, ATZ polymer delivery from the ER lumen to LAMP1/RAB7-positive endolysosomes for clearance does not require ER capture within autophagosomes. Rather, it relies on vesicular transport where single-membrane, ER-derived, ATZ-containing vesicles release their luminal content within endolysosomes upon membrane:membrane fusion events mediated by the ER-resident SNARE STX17 and the endolysosomal SNARE VAMP8. These results may help explain the lack of benefits of pharmacologic macroautophagy enhancement that has been reported for some luminal aggregopathies.
Keywords: ER‐phagy; ER‐to‐lysosome‐associated degradation; LC3 lipidation; endolysosomes; proteasome‐resistant aggregates.
© 2018 The Authors.
Figures
- A
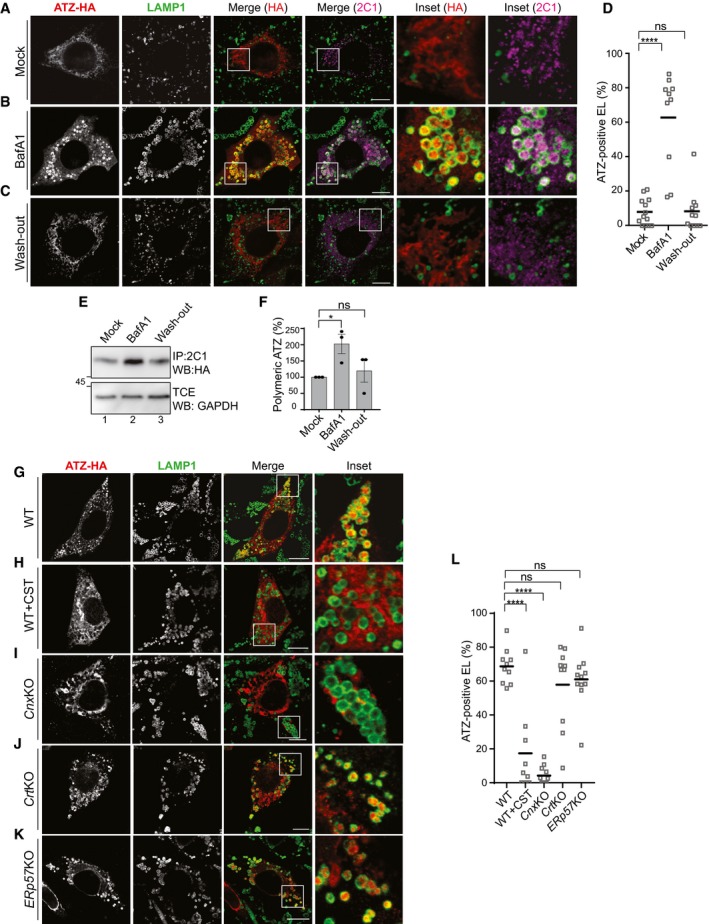
Intracellular localization of total (HA) and polymeric ATZ (2C1) in WT MEF mock‐treated, confocal laser scanning microscopy (CLSM).
- B
Same as (A) for MEF exposed to 50 nM BafA1 for 12 h.
- C
Same as (B), 4 h after BafA1 wash‐out.
- D
Quantification of ATZ‐positive, LAMP1‐positive endolysosomes (EL) (n = 13, 10, 11 cells, respectively). One‐way ANOVA and Dunnett's multiple comparisons test, ns P > 0.05, ****P < 0.0001.
- E
ATZ polymers immunoisolated from lysates of WT MEF mock‐treated (lane 1), incubated for 12 h with BafA1 (lane 2) and 4 h after BafA1 wash‐out (lane 3). Immunoprecipitation (IP) of ATZ polymers with polymer‐specific 2C1 antibody, transfer on PVDF membrane, revealed with anti‐HA antibody on Western blot (WB).
- F
Quantification of (E), n = 3, mean ± SEM. Unpaired two‐tailed t‐test, ns P > 0.05, *P < 0.05.
- G–K
Same as (B) in WT MEF, in cells exposed to 20 mM CST and in Cnx‐, Crt‐, and ERp57‐KO MEF.
- L
Quantification of ATZ‐positive EL (n = 10, 9, 11, 10, 11 cells, respectively). One‐way ANOVA and Dunnett's multiple comparisons test, ns P > 0.05, ****P < 0.0001.
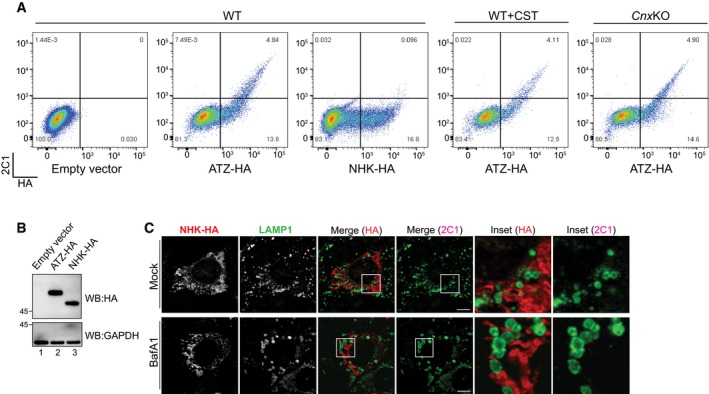
Flow cytofluorimetric analyses to assess HA (x‐axis) and 2C1 (y‐axis) immunoreactivity in MEF mock‐transfected (first panel), expressing ATZ‐HA (second panel) or NHK‐HA (third panel). HA/2C1 double staining is revealed only in ATZ‐HA‐expressing cells. Same as panel 2 in CST‐treated and in CnxKO MEFs (fourth and fifth panels, respectively).
Control of ATZ‐HA (lane 2) and NHK‐HA (lane 3) expression by WB with anti‐HA antibodies (upper panel). Loading control (lower panel).
CLSM analyses showing distribution of the ERAD substrate NHK in WT MEF (upper panels). On BafA1 treatment (lower panels), NHK does not accumulate in LAMP1‐positive endolysosomes. Scale bars: 10 μm.
- A
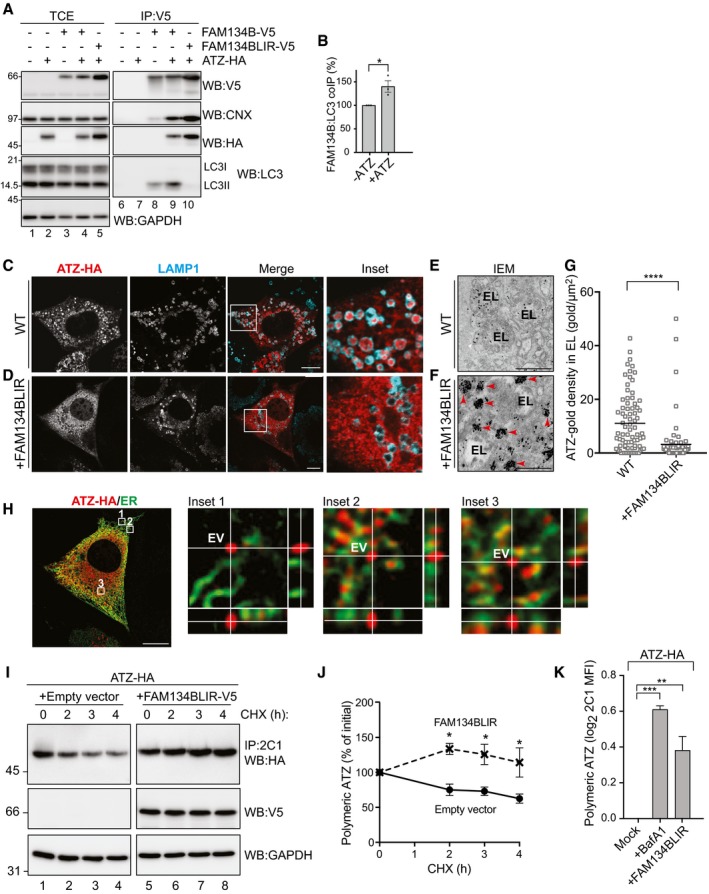
HEK293 cells transfected with empty vector (lanes 1, 6), ATZ‐HA (2, 7), FAM134B‐V5 (3 and 8), FAM134B‐V5 and ATZ‐HA (4, 9), or FAM134BLIR‐V5 and ATZ‐HA (5, 10), incubated for 6 h with 100 nM BafA1 and then treated with the cross‐linker DSP before lysis as described in Materials and Methods. Lanes 1–5, WB of the total cell extract (TCE); lanes 6–10, WB of anti‐V5 immunoprecipitates to isolate complexes containing ectopically expressed FAM134B or FAM134BLIR. The membranes were probed with anti‐V5 (upper panels), anti‐CNX, anti‐HA, and anti‐LC3 antibodies.
- B
Quantification of LC3 co‐precipitating with FAM134B‐V5 (A, lanes 8 and 9). Mean ± SEM, n = 3, unpaired two‐tailed t‐test, *P < 0.05.
- C
Same as Fig 1B, WT MEF. Scale bar: 10 μm.
- D
Ectopic expression of FAM134BLIR in WT MEF inhibits ATZ delivery to endolysosomes. Scale bar: 10 μm.
- E, F
Distribution of gold‐labeled ATZ‐HA by IEM in BafA1‐treated WT MEF and WT MEF overexpressing FAM134BLIR, respectively. EV, ER‐derived vesicles, red arrowheads; EL, endolysosome.
- G
Quantification of ATZ‐gold density of (E, F) (n = 75 and 79 EL, respectively). Unpaired two‐tailed t‐test, ****P < 0.0001.
- H
Max projection of the same cell as in (D) after deconvolution. Insets show orthogonal section of select regions. Scale bar: 10 μm.
- I
Decay of ATZ polymers (CHX chase, upper panel) immunoisolated with the polymer‐specific 2C1 antibody (visualized with anti‐HA in WB) in HEK293 cells mock‐transfected (lanes 1–4) or expressing FAM134BLIR‐V5 (lanes 5–8). Middle panel, expression of FAM134BLIR‐V5 assessed by WB; lower panel, loading control.
- J
Quantification of (I) (Mean ± SEM, n = 3, unpaired two‐tailed t‐test, *P < 0.05).
- K
Flow cytometry analysis of ATZ‐HA polymer levels in MEFs mock‐treated, exposed to BafA1, and co‐expressing FAM134LIR. MFI: mean fluorescence intensity (Mean ± SEM, n = 5, unpaired two‐tailed t‐test, ns P > 0.05, **P < 0.01, ***P < 0.001).
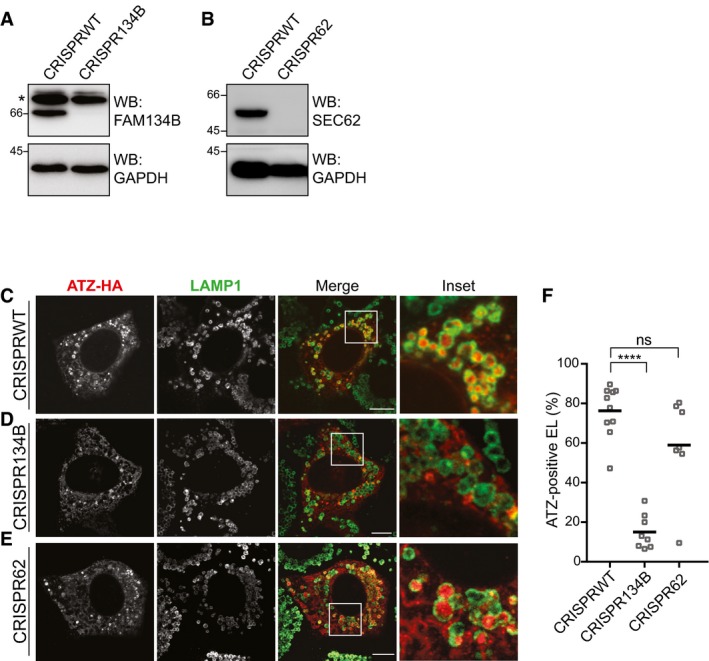
- A
WB analysis showing KO efficiency for CRISPR134B MEF. Asterisks, cross‐reacting bands.
- B
Same as (A) for CRISPR62 MEF.
- C–E
Same as Fig 1B in CRISPR WT MEF, CRISPR134B MEF, CRISPR62 MEF, respectively. Scale bars: 10 μm.
- F
Quantification of (C–E) (n = 10, 8, 7 cells, respectively). One‐way ANOVA and Dunnett's multiple comparisons test, ns P > 0.05, ****P < 0.0001.
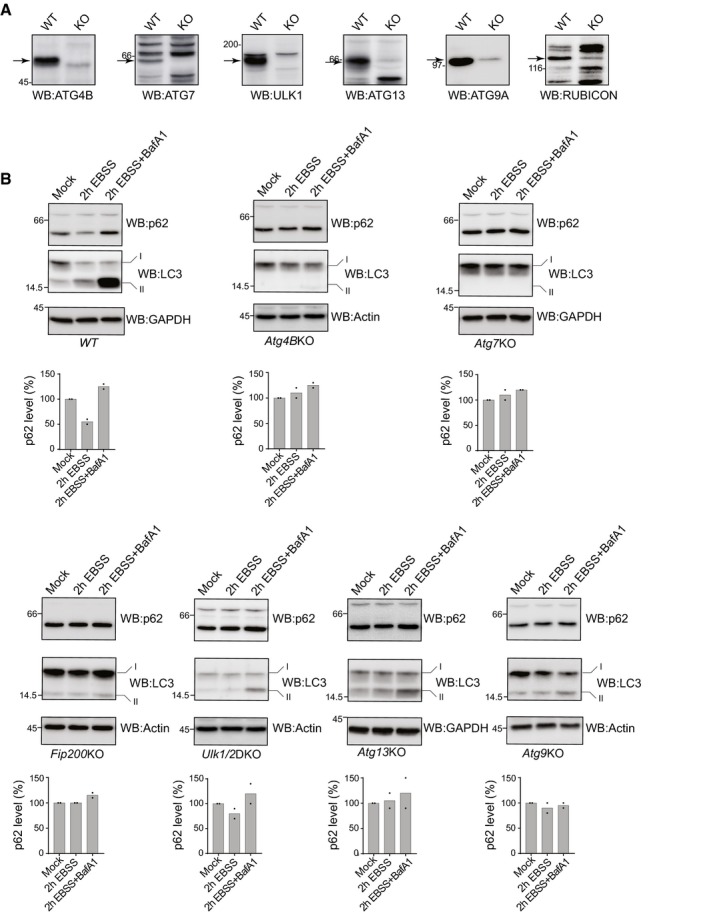
KO efficiencies were controlled for ATG4B, ATG7, ULK1, ATG13, ATG9A, and RUBICON (arrows).
Macroautophagy activity on nutrient deprivation is assessed by monitoring variation of the levels of the macroautophagy substrate p62 by WB in WT, Atg4BKO, Atg7KO, Fip200KO Ulk1/2DKO, Atg13KO, Atg9KO MEFs (the values for two independent experiments are given). For each cell line, also LC3 levels are shown. All the controls performed in this figure confirm the results published by the groups sharing these cell lines (cited in the text and in the Acknowledgements section).
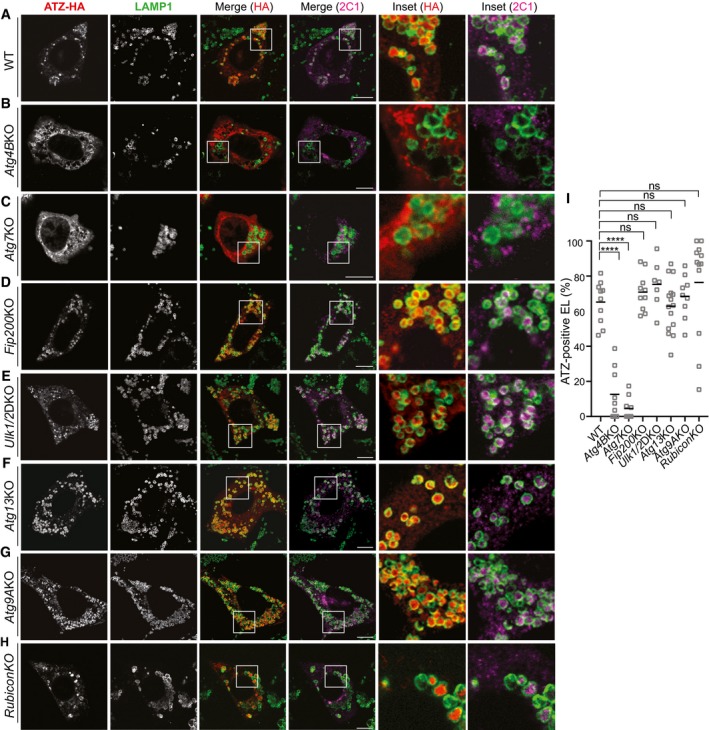
- A–H
Intracellular localization of LAMP1‐positive EL, total (HA), and polymeric (2C1) ATZ in WT MEF exposed to BafA1 for 12 h (A); in Atg4BKO MEF (B); in Atg7KO MEF (C); in Fip200KO MEF (D); in Ulk1/2 double‐KO MEF (E); in Atg13KO MEF (F); in Atg9KO MEF (G); in RubiconKO MEF (H). Scale bars: 10 μm.
- I
Quantifications of (A–H) (n = 10, 9, 9, 10, 7, 15, 9, 12 cells). One‐way ANOVA and Dunnett's multiple comparisons test, ns P > 0.05, ****P < 0.0001.
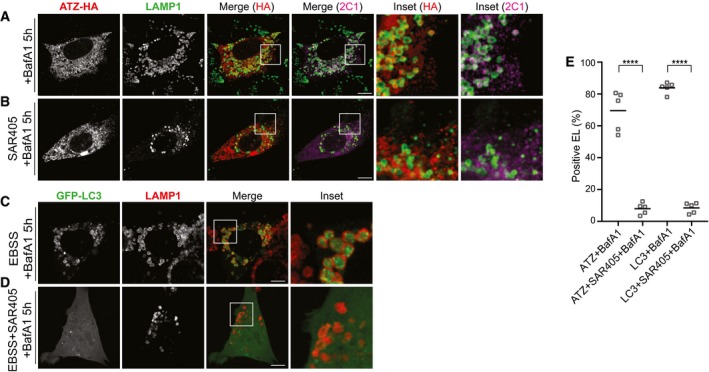
- A, B
Intracellular localization of total (HA) and polymeric ATZ (2C1) in WT MEF exposed to 100 nM BafA1 for 5 h and in cells exposed to 5 μM Sar405 and 100 nM BafA1 for 5 h, respectively.
- C, D
As control for Sar405 treatment, WT MEF transfected with GFP‐LC3 were treated as in (A and B), respectively, on nutrient deprivation.
- E
Quantification of ATZ‐ or GFP‐LC3‐positive endolysosomes as shown in (A–D) (n = 5). Unpaired two‐tailed t‐test, ****P < 0.0001.
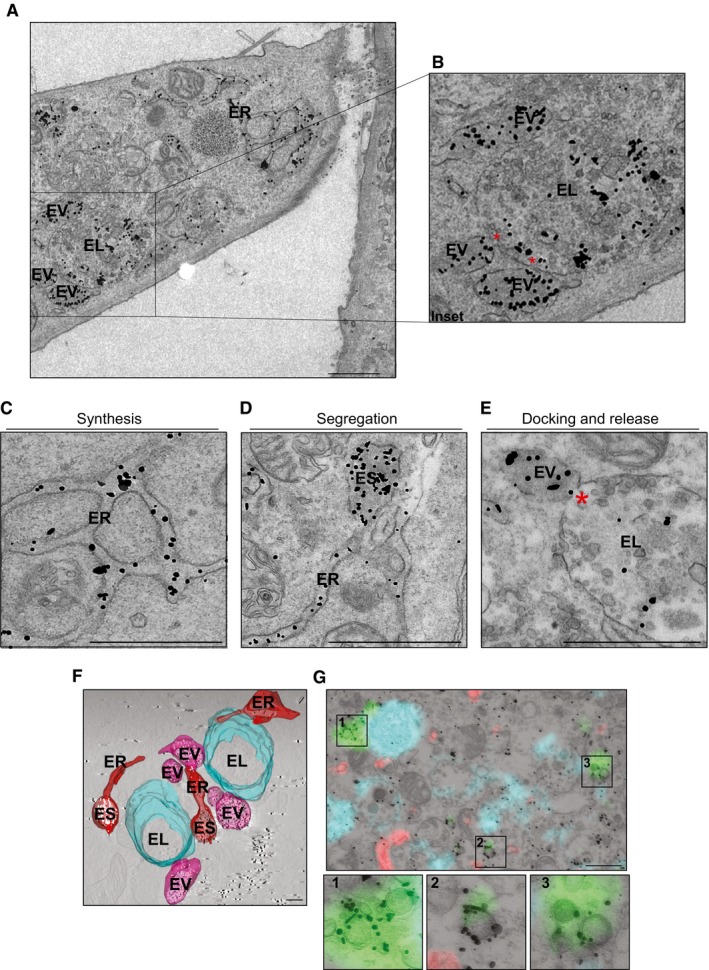
- A
Distribution of gold‐labeled ATZ‐HA by IEM in WT MEF exposed to BafA1 (the cell on the right is not transfected, as specificity control for gold labeling). ER, endoplasmic reticulum; EV, ER‐derived vesicle; EL, endolysosomes. Scale bar: 1 μm.
- B
Inset of A. Red asterisks show site of EV:EL membranes fusion.
- C–E
Distribution of gold‐labeled ATZ‐HA by IEM in WT MEF. ES, ER subdomains. Red asterisk shows site of EV:EL membranes fusion. Scale bar: 1 μm.
- F
3D visualization by means of electron tomography of organelles containing gold‐labeled ATZ‐HA (visualized as white dots, see Movie EV1). ES, ER subdomains. Scale bar: 500 nm.
- G
CLEM showing ATZ (red), LAMP1‐positive EL (cyan), and GFP‐derived fluorescence (green) in correspondence to heavily labeled vesicles, which were identified as autophagosomes for their double membrane (insets 1–3). GFP‐LC3 was also stained by immunogold. Scale bar: 1 μm.
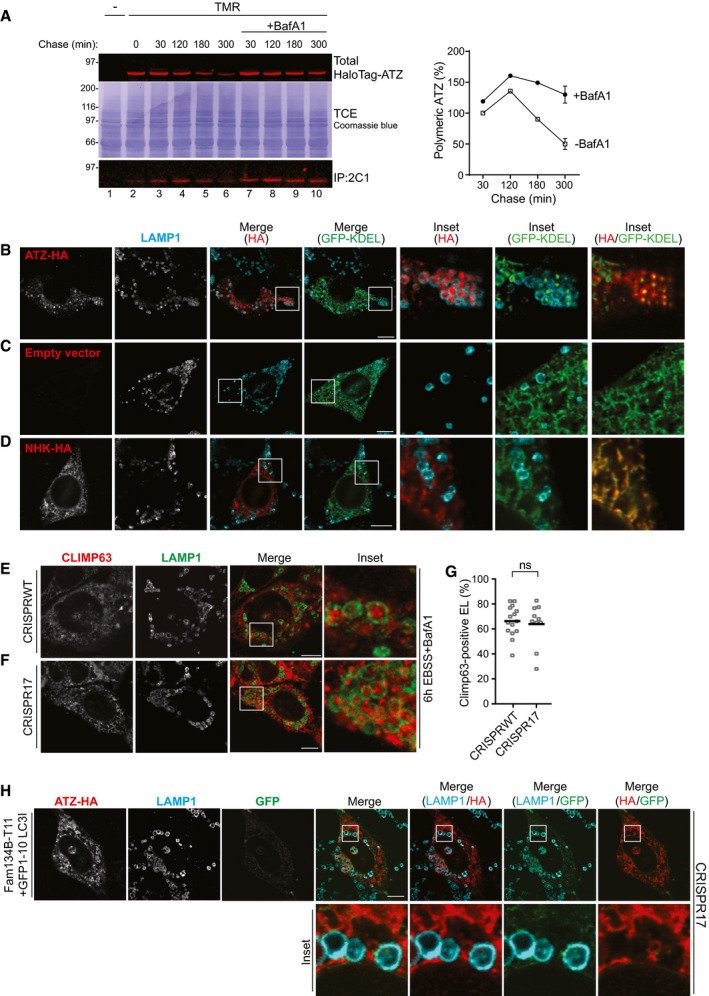
- A
Kinetics of total (upper panel) and of polymeric (lower panel, IP:2C1) TMR ligand‐labeled HaloTag‐ATZ clearance in mock‐ (lanes 2–6) and in BafA1‐treated HEK293 cells (lanes 7–10). Quantification, n = 3 for 30’, 180’, 300’, 300’+BafA1. Mean ± SEM.
- B–D
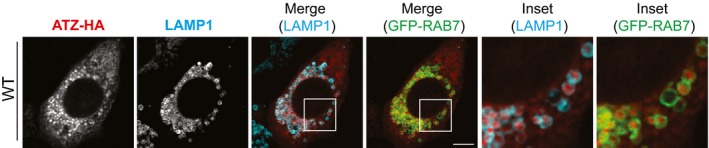
CLSM analyses of BafA1‐treated WT cells showing co‐localization of ATZ‐HA (red) and sfGFP‐KDEL (green) in LAMP1‐positive (cyan) endolysosomes (Inset HA/GFP‐KDEL) (B); same in cells expressing only sfGFP‐KDEL (C) and in cells co‐expressing NHK‐HA and sfGFP‐KDEL (D). Scale bars: 10 μm. A time course is shown in Fig 6A and B.
- E, F
Delivery of the endogenous ER‐phagy marker CLIMP63 within LAMP1‐positive endolysosomes in WT and in CRISPR17 MEF, respectively, exposed to BafA1 on nutrient deprivation. Scale bars: 10 μm.
- G
Quantification of (E, F) (n = 15, 10 cells). Unpaired two‐tailed t‐test, ns P > 0.05, ****P < 0.0001).
- H
GFP reconstitution in ATZ‐HA‐transfected CRISPR17 MEF expressing FAM134B‐T11 and non‐lipidable GFP1–10‐LC3I. Scale bar: 10 μm.
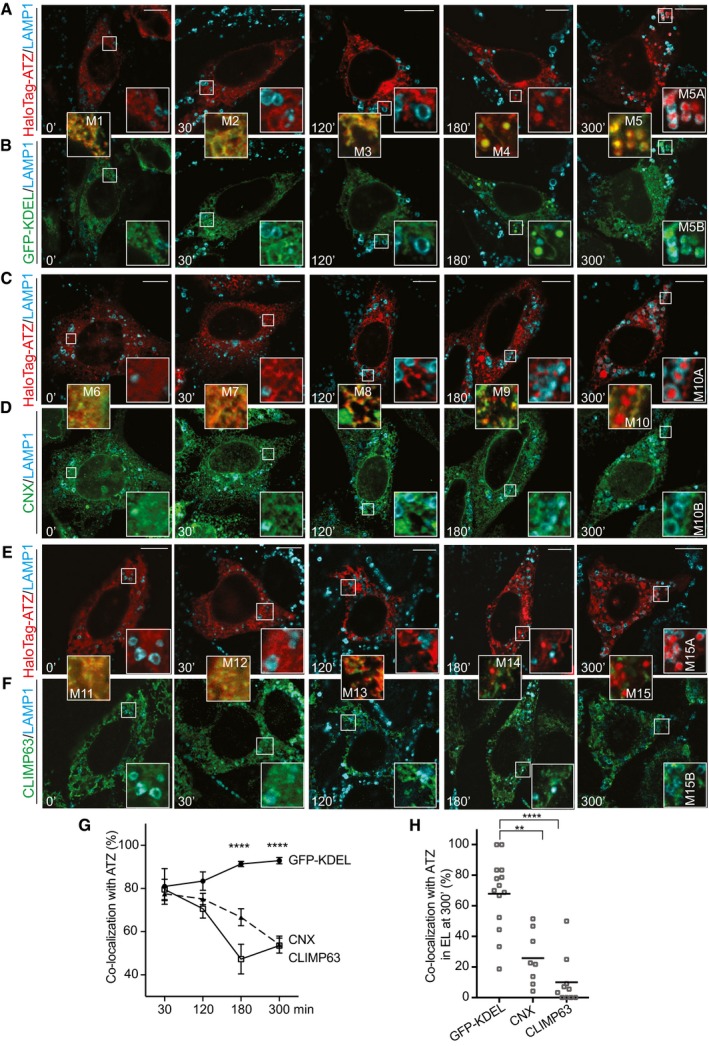
- A, B
Triple staining of cells with LAMP1 (cyan), HaloTag‐ATZ (red), and the luminal ER marker sfGFP‐KDEL (green).
- C, D
Same as (A, B), with CNX as ER membranes marker.
- E, F
Same as (A, B), with CLIMP63 as ER membranes marker.
- G
Quantification of ER markers and HaloTag‐ATZ co‐localization in time (sfGFP‐KDEL n = 10, 10, 12, 13, CNX n = 8, 10, 9, 8, CLIMP63 n = 8, 10, 6, 10 cells for corresponding time points). Mean ± SEM, unpaired two‐tailed t‐test, ****P < 0.0001.
- H
Quantification of double‐positive endolysosomes at 300’ (ATZ:sfGFP‐KDEL n = 14, ATZ:CNX n = 8, ATZ:CLIMP63 n = 10 cells. One‐way ANOVA and Dunnett's multiple comparisons test, **P < 0.01, ****P < 0.0001).
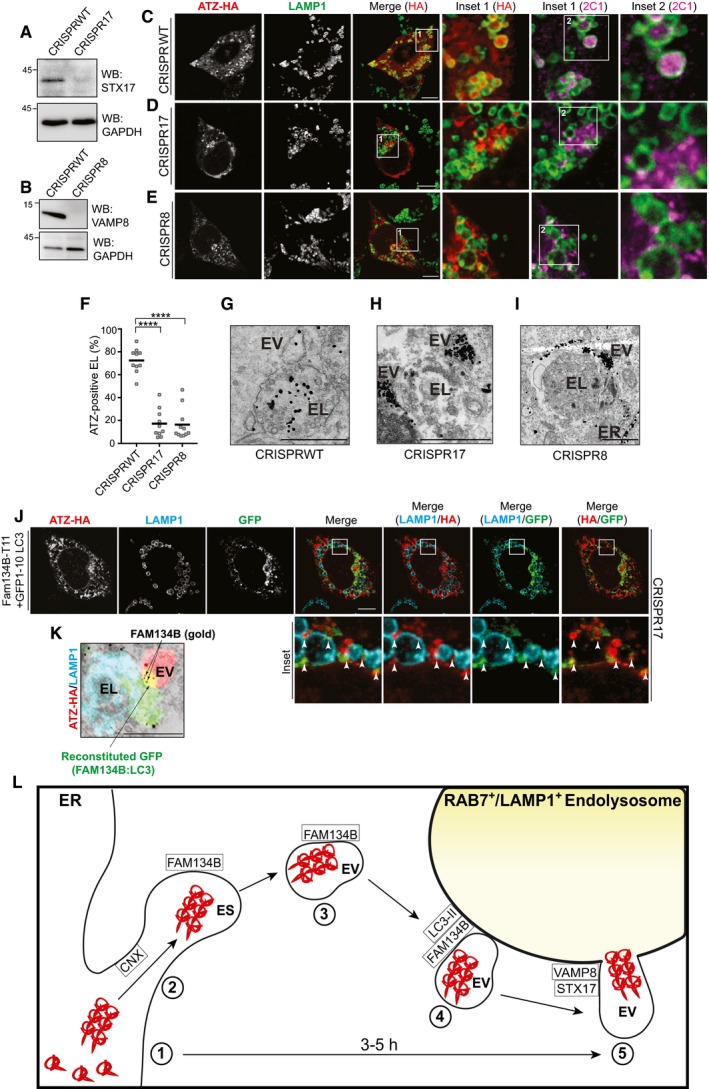
- A
KO efficiency in CRISPR17 MEF.
- B
Same as (A) for CRISPR8.
- C–E
CLSM analysis of ATZ delivery to LAMP1‐positive endolysosomes in BafA1‐treated CRISPRWT MEF (C); in CRISPR17 MEF(D); in CRISPR8 MEF (E). Scale bars: 10 μm.
- F
Quantification of (C–E) (n = 10, 10, 11 cells, respectively). One‐way ANOVA and Dunnett's multiple comparisons test, ****P < 0.0001.
- G–I
Distribution of gold‐labeled ATZ‐HA by IEM in CRISPRWT MEF exposed to BafA1 (G); in CRISPR17 (H); in CRISPR8. (I). ER, endoplasmic reticulum; EV, ER‐derived vesicles; EL, endolysosomes. Scale bars: 1 μm.
- J
GFP reconstitution in ATZ‐HA‐transfected CRISPR17 MEF expressing FAM134B‐T11 and GFP1–10‐LC3. Scale bar: 10 μm.
- K
Same as (J) by CLEM. ATZ‐HA staining in red, LAMP1‐positive endolysosomes in cyan. FAM134B:LC‐induced GFP reconstitution in green. FAM134B in gold is shown. Scale bar: 1 μm.
- L
ERLAD schematics. 1. Synthesis and CNX‐independent polymers formation; 2. CNX‐regulated polymers segregation in ER subdomains (ES); 3. FAM134B‐dependent (LIR‐independent) formation of ER‐derived vesicles (EV); 4. FAM134B:LC3II‐mediated EV docking to RAB7/LAMP1‐positive endolysosomes (EL); 5. STX17/VAMP8‐controlled fusion of EV:EL membranes and polymers release in the EL lumen for clearance.
References
-
- Bento CF, Renna M, Ghislat G, Puri C, Ashkenazi A, Vicinanza M, Menzies FM, Rubinsztein DC (2016) Mammalian autophagy: how does it work? Annu Rev Biochem 85: 685–713 - PubMed
-
- Cabantous S, Terwilliger TC, Waldo GS (2005) Protein tagging and detection with engineered self‐assembling fragments of green fluorescent protein. Nat Biotechnol 23: 102–107 - PubMed
Publication types
MeSH terms
Substances
Grants and funding
LinkOut - more resources
Full Text Sources
Other Literature Sources
Research Materials
Miscellaneous
