. 2019 Jan;104(1):82-92.
doi: 10.3324/haematol.2018.191213. Epub 2018 Aug 3.

Transcriptional activation of the miR-17-92 cluster is involved in the growth-promoting effects of MYB in human Ph-positive leukemia cells

Affiliations

Transcriptional activation of the miR-17-92 cluster is involved in the growth-promoting effects of MYB in human Ph-positive leukemia cells

Manuela Spagnuolo et al. Haematologica. 2019 Jan.

Abstract

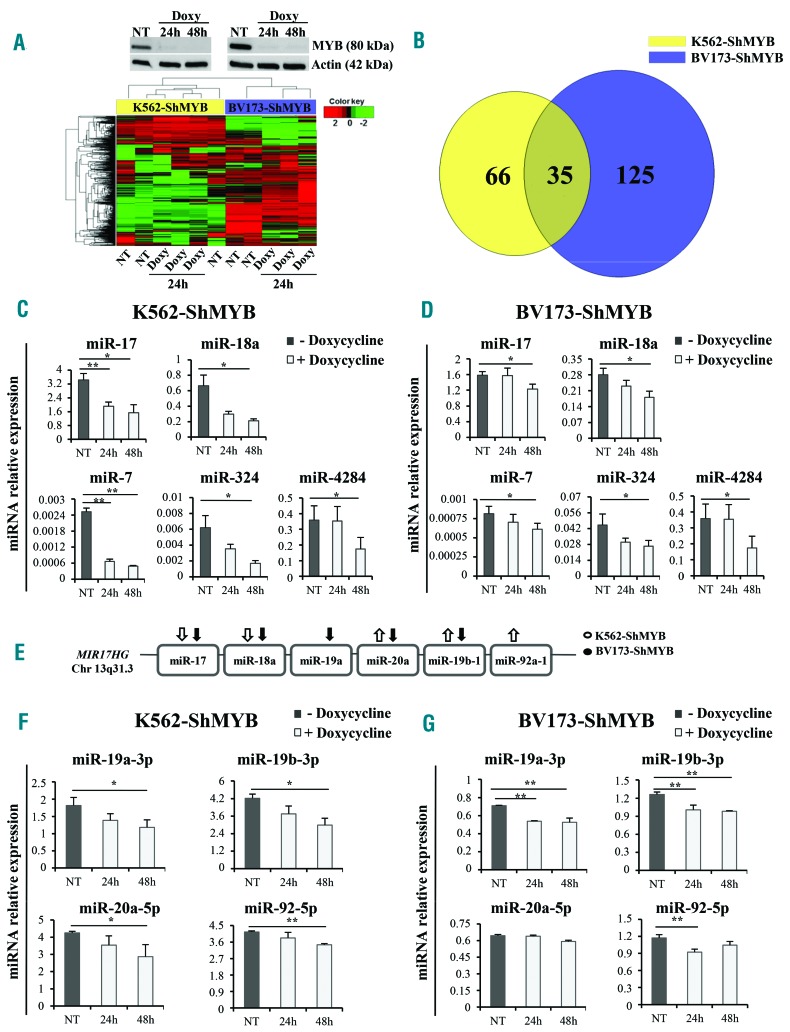
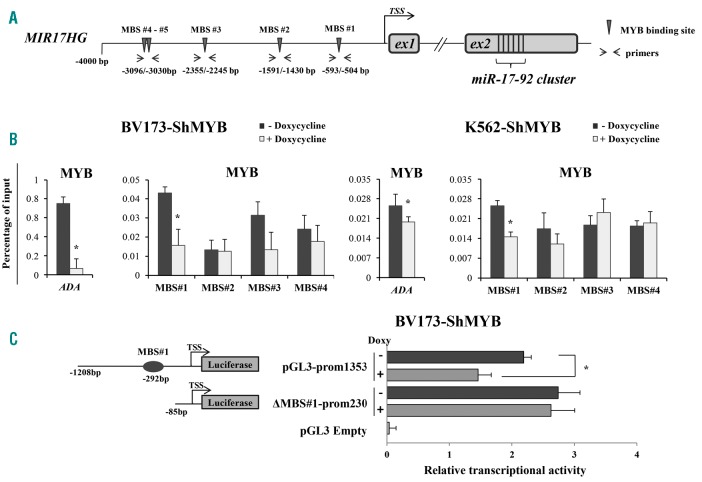
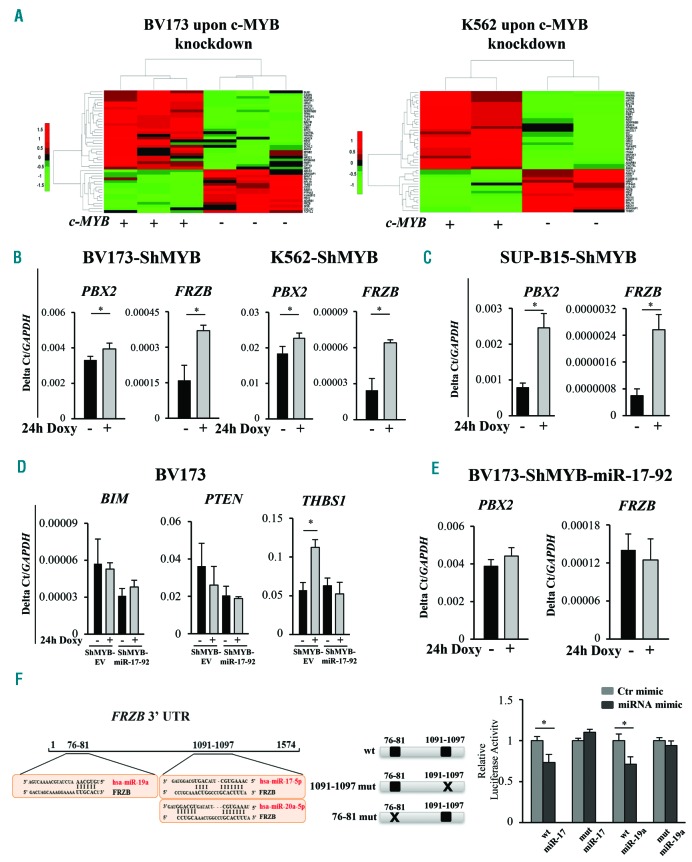
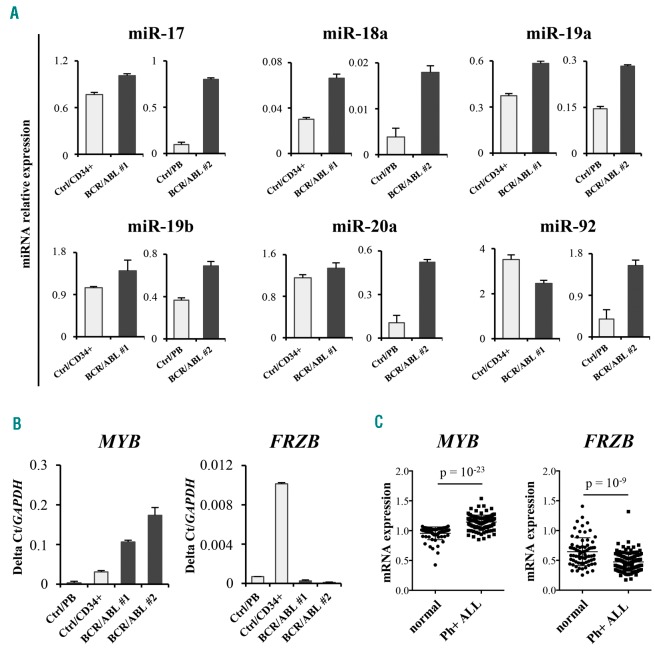
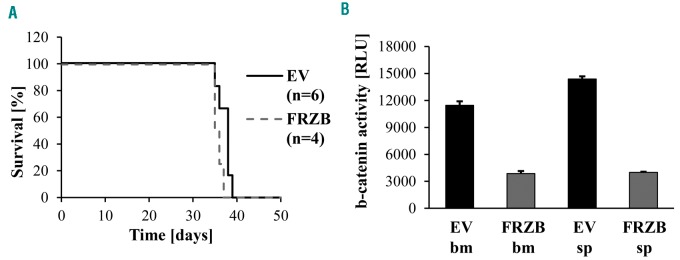
MicroRNAs, non-coding regulators of gene expression, are likely to function as important downstream effectors of many transcription factors including MYB. Optimal levels of MYB are required for transformation/maintenance of BCR-ABL-expressing cells. We investigated whether MYB silencing modulates microRNA expression in Philadelphia-positive (Ph+) leukemia cells and if MYB-regulated microRNAs are important for the "MYB addiction" of these cells. Thirty-five microRNAs were modulated by MYB silencing in lymphoid and erythromyeloid chronic myeloid leukemia-blast crisis BV173 and K562 cells; 15 of these were concordantly modulated in both lines. We focused on the miR-17-92 cluster because of its oncogenic role in tumors and found that: i) it is a direct MYB target; ii) it partially rescued the impaired proliferation and enhanced apoptosis of MYB-silenced BV173 cells. Moreover, we identified FRZB, a Wnt/β-catenin pathway inhibitor, as a novel target of the miR-17-92 cluster. High expression of MYB in blast cells from 2 Ph+leukemia patients correlated positively with the miR-17-92 cluster and inversely with FRZB. This expression pattern was also observed in a microarray dataset of 122 Ph+acute lymphoblastic leukemias. In vivo experiments in NOD scid gamma mice injected with BV173 cells confirmed that FRZB functions as a Wnt/β-catenin inhibitor even as they failed to demonstrate that this pathway is important for BV173-dependent leukemogenesis. These studies illustrate the global effects of MYB expression on the microRNAs profile of Ph+cells and supports the concept that the "MYB addiction" of these cells is, in part, caused by modulation of microRNA-regulated pathways affecting cell proliferation and survival.


Figures

Figure 1.
Figure 1.
miRNA expression profile of MYB-silenced Philadelphia-positive (Ph+) leukemia cells and expression levels of miR-17-92 cluster members. (A) (Upper panels) Western blots of a representative experiment showing specific knockdown of MYB in Doxycycline (Doxy)-treated cells; (lower panel) heat map of differentially expressed miRNAs in Doxy-treated [24 hours (h)] K562-ShMYB and BV173-ShMYB cells. MiRNA expression levels are shown as color variations. Higher and lower values are represented by red and green points, respectively. Pairwise distances between rows and between columns were computed by Euclide distance metric. (B) Venn diagram of differentially expressed miRNAs: 35 miRNAs are commonly modulated in the indicated cell lines. (C and D) qRT-PCR of 5 selected miRNAs from the 15 miRNAs modulated in the same direction in untreated (Not Treated; NT) or Doxy-treated (24-48 h) K562- and BV173-ShMYB cells. Samples were normalized for RNU44 expression. Relative expression was calculated using the comparative Ct method. Data are the average of three independent experiments; error bars indicate SEM. P-values (*P≤0.05; **P≤0.01) were determined using Student t-test. (E) Schematic representation of members of miR-17-92 cluster included in the MIR17HG gene on Chr13q31.3. Arrows represent the direction of miRNA modulation based on the microarray experiment in K562-ShMYB (white) and BV173-ShMYB (black). (F and G) qRT-PCR of the indicated members of miR-17-92 cluster in NT or Doxy-treated (24-48 h) K562-ShMYB and BV173-ShMYB cells. Samples were normalized for RNU44 expression. QRT-PCR was performed in triplicate, including no-template controls. Relative expression was calculated using the comparative Ct method. Data are the average of three independent experiments; error bars indicate Standard Error of Mean. P-values were determined using Student t-test.*P≤0.05; **P≤0.01.
Figure 2.
Figure 2.
MYB binding to the promoter of the miR-17-92 cluster. (A) Schematic representation of 4000 bp regulatory regions upstream of the MIR17HG promoter. A transcription start site (TSS) is indicated. Arrows indicate the promoter region amplified by the specific primer pair used for qPCR amplification of immunoprecipitated chromatin. (B) ChIP analysis of the MIR17HG promoter using the indicated MYB antibody in untreated (Not Treated; NT) or Doxycycline (Doxy)-treated BV173-ShMYB and K562-ShMYB cells. Results of qPCR are analyzed with the comparative Ct method. Values of each immunoprecipitated sample are expressed as percentage relative to their respective input and by subtracting the values obtained in the negative controls (no antibody). Error bars represent Standard Error of Mean (SEM) (n=3); P-values (*P≤0.05) were determined using Student t-test. (C) (Left panel) Schematic representation of the reporter plasmids containing the MYB binding site (MBS) #1 (pGL3–prom1353) or its deletion mutant without the MBS#1 (ΔMBS#1-prom230). (Right panel) Dual luciferase assay performed in untreated or Doxy-treated BV173-ShMYB cells transfected with the pGL3–prom1353 or the ΔMBS#1-prom230 plasmid. Promoter activity of each plasmid was determined 48 hours (h) after transfection. Luciferase activity values were normalized for transfection efficiency according to the activity of a co-transfected Renilla luciferase plasmid. Data are the average of three independent experiments performed in duplicate; error bars indicate Standard Error of Mean (*P≤0.05).
Figure 3.
Figure 3.
Biological effects of over-expressed miR-17-92 cluster in MYB silenced Philadelphia-positive (Ph+) BV173 cells. (A) (Upper panel) Western blots of a representative experiment showing specific knockdown of MYB in Doxycycline (Doxy)-treated [24, 48 and 72 hours (h)] BV173-ShMYB cells; (lower panel) qRT-PCR of the indicated members of the miR-17-92 cluster in BV173-ShMYB-Empty Vector (EV) and the miR-17-92 over-expressing cells. Results are expressed as fold changes [mean±Standard Error of Mean (SEM) from three independent experiments] in miRNA expression in BV173-ShMYB-miR-17-92 cells as compared with values in BV173-ShMYB-EV cells. (B) MTT and ATPlite assays; data are the average of three independent experiments, and percentage of cell survival (left panel) and cell viability (right panel) were assessed at the indicated times of Doxy treatment. (C) Percentage of S-phase cells over control for untreated or Doxy-treated (48 h) BV173-ShMYB-EV and derivative miR-17-92 over-expressing lines (**P≤0.01). (D) (Left panel) Percentage of Annexin V for untreated or Doxy-treated (96 h) BV173-ShMYB-EV and derivative miR-17-92 over-expressing lines (*P≤0.05). (Middle panel) Western blot of a representative experiment of MYB, uncleaved PARP, BCL-2 and actin protein levels in BV173-ShMYB-EV and BV173-ShMYB-miR-17-92 over-expressing cells, 72 h after MYB silencing. (Right panel) Densitometric analysis by imageJ software. Actin was used as loading control within the same sample and expressed as fold changes compared to control.
Figure 4.
Figure 4.
Transcriptional analysis and evaluation of mRNA expression levels of miR-17-92 cluster target genes. (A) Unsupervised hierarchical clustering of common deregulated genes from gene expression analysis of parental and MYB-silenced BV173 and K562 cells. (B and C) qRT-PCR of PBX2 and FRZB expression levels upon MYB knockdown [24 hours (h)] of the indicated Philadelphia-positive (Ph+) ShMYB cell lines. Results are mean of three experiments. Error bars indicate Standard Error of Mean (SEM). (D) Analysis of mRNA expression levels, using SYBR Green-based qRT-PCR, of BIM, PTEN and THBS1 in untreated and Doxy-treated BV173-ShMYB-Empty Vector (EV) and ShMYB-miR-17-92 cells. Results are mean of three experiments. Error bars indicate SEM. (E) Quantification by SYBR Green-based qRT-PCR of PBX2 and FRZB mRNA in untreated and Doxy-treated BV173-ShMYB-miR-17-92 cells. Values are reported as 2-ΔCt. GAPDH gene expression was used as endogenous control. Error bars indicate SEM (n=3). (F) (Left panel) Schematic representation of 3’UTRs of FRZB gene with putative binding sites for miR-17-92 cluster. (Right panel) Schematic representation of reporter plasmids containing the wild-type (wt) or mutant (76-81 mut, 1091-1097 mut of miR-17-92-binding sequences) FRZB 3’UTR. Dual Luciferase assay in recipient cells co-transfected with luciferase reporter vectors containing the wt-3’UTR FRZB or the indicated FRZB mutant and either the hsa-miR-17, the hsa-miR-19a mimics or a control (Ctr)-mimic RNA. Firefly luciferase activity of each sample was normalized by Renilla luciferase activity. Results are expressed as fold activation relative to the basal activity of the control mimic (ctr-mimic). (*P≤0.05). The normalized luciferase activity, set as mean of at least three independent experiments performed in duplicate, is shown. Error bars represent the mean±SEM (n=3).
Figure 5.
Figure 5.
Expression of the miR-17-92 cluster and its target FRZB correlates with MYB levels in Philadelphia-positive (Ph+) acute lymphoblastic leukemia (ALL) cells. (A) MiR-17-92 expression levels evaluated by stem-loop qRT-PCR in primary leukemia cells (Patient 1: p210BCR/ABL chronic myeloid leukemia (CML)-myeloid blast crisis) compared to normal CD34+ cells from a healthy subject [Control (Ctrl) CD34+] and Patient 2 (p190BCR/ABL ALL) compared to normal peripheral blood mononuclear (PBMC) cells (Ctrl/PB). Samples were normalized for RNU44 small-nucleolar RNA expression using the comparative Ct method. Data are the average of three experiments; error bars indicate Standard Deviation (SD). (B) mRNA quantification of MYB and FRZB, by SYBR Green-based qRT-PCR, in Patient 1 (p210BCR/ABL CML-myeloid blast crisis) and Patient 2 (p190BCR-ABL ALL) compared to normal CD34+ cells and PBMC cells from healthy donors (Ctrl/CD34+ and Ctrl/PB), respectively. Values are reported as 2-ΔCt normalizing to GAPDH gene expression. (C) mRNA expression by microarray of MYB or FRZB in normal B cells or Ph+ ALL cells. (Values represent the sum of all probes signals for each gene and are derived from dataset GSE13159).
Figure 6.
Figure 6.
Effect of FRZB expression on leukemogenesis and β-catenin activity of Philadelphia-positive (Ph+) BV173 cells. (A) Survival of mice injected with 2×10⁶ BV173-ShMYB 7TFP pUltra-Empty Vector (EV) or BV173-ShMYB 7TFP pUltra-hot-FRZB cells (FRZB). (B) Luciferase reporter assay for β-catenin activity in GFP+ cells isolated from the bone marrow (bm) or spleen (sp) of a NOD scid gamma (NSG) mouse injected with (EV)- or FRZB-BV173 cells and sacrificed when terminally ill.

References

    1. Kang ZJ, Liu YF, Xu LZ, et al. The Philadelphia chromosome in leukemogenesis. Chin J Cancer. 2016;35:48. - PMC - PubMed
    1. Li S, Ilaria RL, Jr, Million RP, Daley GQ, Van Etten RA. The P190, P210, and P230 forms of the BCR/ABL oncogene induce a similar chronic myeloid leukemia-like syndrome in mice but have different lymphoid leukemogenic activity. J Exp Med. 1999; 189(9):1399–1412. - PMC - PubMed
    1. Perrotti D, Cesi V, Trotta R, et al. BCR-ABL suppresses C/EBPalpha expression through inhibitory action of hnRNP E2. Nat Genet. 2002;30(1):48–58. - PubMed
    1. Soliera AR, Mariani SA, Audia A, et al. Gfi-1 inhibits proliferation and colony formation of p210BCR/ABL-expressing cells via transcriptional repression of STAT 5 and Mcl-1. Leukemia. 2012;26(7):1555–1563 - PMC - PubMed
    1. Soliera AR, Lidonnici MR, Ferrari-Amorotti G, et al. Transcriptional repression of c-Myb and GATA-2 is involved in the biologic effects of C/EBPalpha in p210BCR/ABL-expressing cells. Blood. 2008;112(5):1942–1950. - PMC - PubMed

Publication types

MeSH terms