. 2018 Aug 3;3(26):eaao4747.
doi: 10.1126/sciimmunol.aao4747.

Neutrophil cytoplasts induce TH17 differentiation and skew inflammation toward neutrophilia in severe asthma

Affiliations

Neutrophil cytoplasts induce TH17 differentiation and skew inflammation toward neutrophilia in severe asthma

Nandini Krishnamoorthy et al. Sci Immunol. .

Abstract

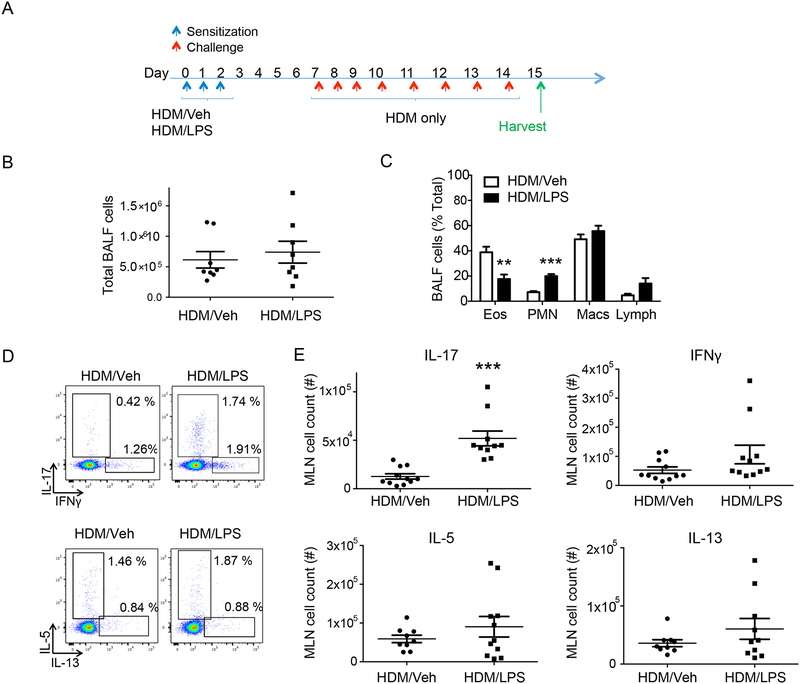
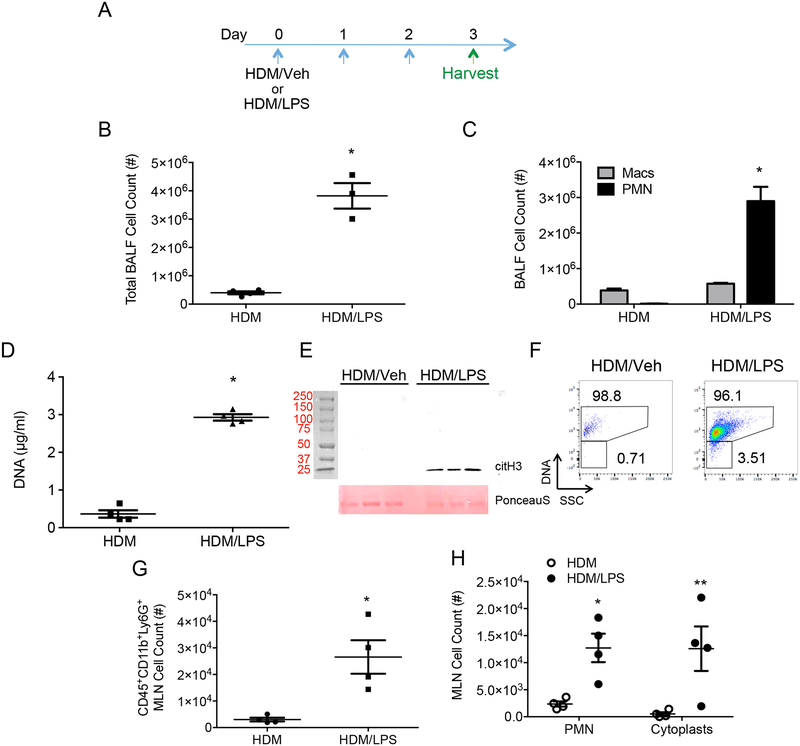
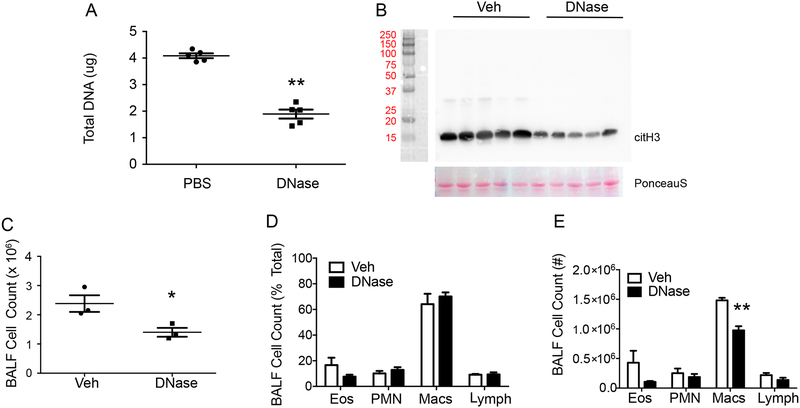
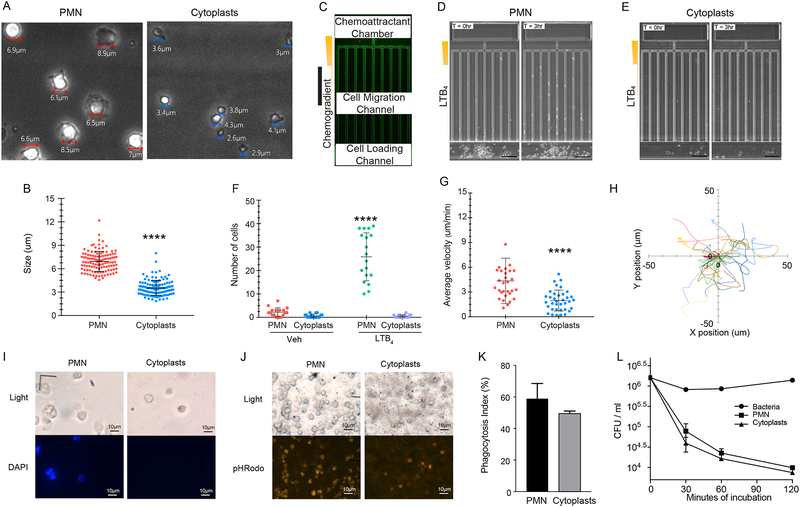
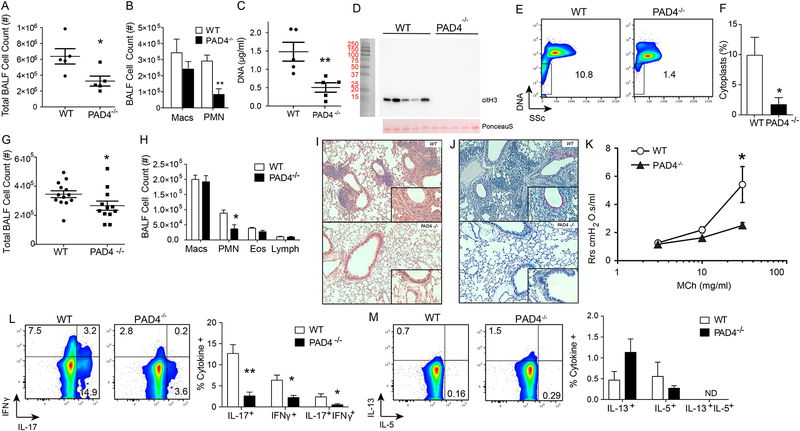
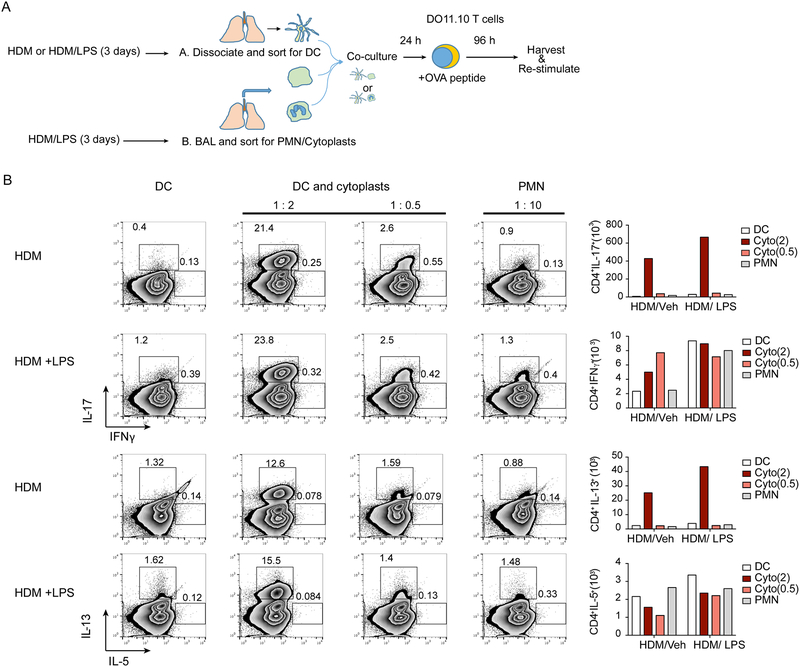
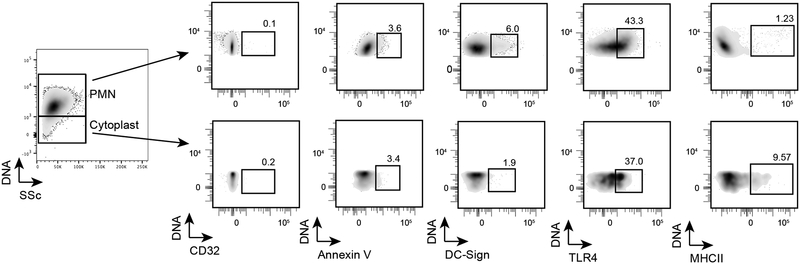
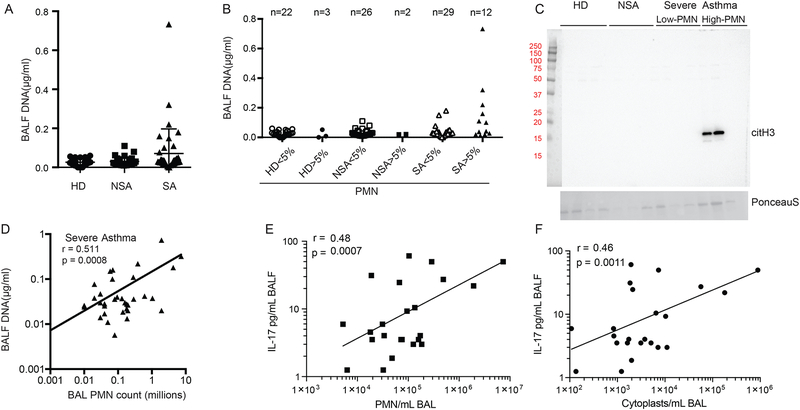
Severe asthma is a debilitating and treatment refractory disease. As many as half of these patients have complex neutrophil-predominant lung inflammation that is distinct from milder asthma with type 2 eosinophilic inflammation. New insights into severe asthma pathogenesis are needed. Concomitant exposure of mice to an aeroallergen and endotoxin during sensitization resulted in complex neutrophilic immune responses to allergen alone during later airway challenge. Unlike allergen alone, sensitization with allergen and endotoxin led to NETosis. In addition to neutrophil extracellular traps (NETs), enucleated neutrophil cytoplasts were evident in the lungs. Surprisingly, allergen-driven airway neutrophilia was decreased in peptidyl arginine deiminase 4-deficient mice with defective NETosis but not by deoxyribonuclease treatment, implicating the cytoplasts for the non-type 2 immune responses to allergen. Neutrophil cytoplasts were also present in mediastinal lymph nodes, and the cytoplasts activated lung dendritic cells in vitro to trigger antigen-specific interleukin-17 (IL-17) production from naïve CD4+ T cells. Bronchoalveolar lavage fluid from patients with severe asthma and high neutrophil counts had detectable NETs and cytoplasts that were positively correlated with IL-17 levels. Together, these translational findings have identified neutrophil cytoplast formation in asthmatic lung inflammation and linked the cytoplasts to T helper 17-mediated neutrophilic inflammation in severe asthma.


Conflict of interest statement

COMPETING INTERESTS:

The authors declare that they have no competing interests.

Figures

Figure 1:
Figure 1:. Neutrophilic inflammation in a murine model of HDM and LPS
(A) Schematic diagram showing the allergen sensitization and challenge protocol. After sensitization with HDM/Veh or HDM/LPS (protocol day 0–2) followed by HDM challenge (i.n., protocol day 7–14), the inflammatory response was assessed 24 hours later on protocol day 15 (n= 8 mice). (B) BALF total cell count (C) and leukocyte differential (% total leukocytes) were determined. (D,E) Mediastinal lymph nodes (MLN) were collected on protocol day 7 and dissociated cells were restimulated with PMA and ionomycin. (D) Representative flow cytometry plot and (E) MLN total cell count of CD4+ T cells expressing IL-17, IFN-γ, IL-5 and IL-13 (n = 10 mice). **P<0.01, ***P<0.001 by Student’s t test
Figure 2:
Figure 2:. LPS promotes NETosis during allergen sensitization
(A) BAL fluid (BALF) and mediastinal lymph nodes (MLN) were harvested on protocol day 3 after allergen sensitization with HDM/Veh or HDM/LPS. (B) BALF total cell count and (C) leukocyte differential count on protocol day 3 from HDM/Veh or HDM/LPS sensitized mice. Data are representative of two independent experiments with n>3. (D) PicoGreen assay showing NET- associated DNA present in BALF (n = 4 mice). (E) A western blot showing hyper-citrullinated histone H3 in BALFs (top panel) and Ponceau S stain as loading control (bottom panel) (F) A representative flow cytometry plot showing the presence of DNA positive neutrophils (PMN) and DNA negative cytoplasts in BALFs from HDM/Veh (left) and HDM/LPS (right) mice (n = 8). (G) MLN total cell count for CD45+CD11b+Ly6g+ cells and (H) DNA positive PMN and DNA negative cytoplast count (n = 4 mice). *p <0.05, **p < 0.01, ***p < 0.001 by two-tailed unpaired Student’s t test where indicated or Mann Whitney U test.
Figure 3:
Figure 3:. DNase instillation altered levels of NETs, but not neutrophilia
Mice were subjected to DNase (i.n., 6 hours post-sensitization with HDM/LPS) or PBS control and tissues were harvested at the end of the sensitization period (day 3). (A) Picogreen assays showing the amount of DNA in BALFs (n = 5 mice). (B) Western blot showing hyper- citrullinated histone H3 (top panel) and Ponceau S stain as loading control (bottom panel) (n = 5 mice). (C-E) To assess inflammatory responses, BAL was performed at the end of the allergen (HDM) challenge on protocol day 15. (C) BALF total cell count and (D, E) leukocyte differential (% total leukocytes and cell count) were enumerated (n = 3 mice). *P<0.05, **P<0.01 by Student’s t-test.
Figure 4:
Figure 4:. Enucleated cytoplasts formed after NETosis are intact and retain functional responses
Neutrophils (PMN) and neutrophil cytoplasts were flow sorted from HDM/LPS treated mouse lungs (protocol day 3). (A,B) The morphology and size of the sorted PMN and cytoplasts were determined by phase contrast microscopy. ****p < 0.0001 by two-tailed Student’s t-test. (C-E) Chemotaxis to LTB4 was assessed using a microfluidics device with sorted cells (see Methods) (C) Fluorescent microscopic image showing one chemotaxis unit in the microfluidic device. (D) PMN or (E) cytoplasts were loaded into the microfluidics chamber with an LTB4 (100nm) gradient and time lapse, phase-contrast microscopic imaging was performed for 6 hours (Representative images). (F) Measurements of the number of cells that entered the migration microchannels per unit at various conditions. ****p < 0.0001 using a one-way ANOVA. (G) Measurements of chemotaxis velocity of PMN in the migration channels and chemokinesis velocity of cytoplasts in the cell loading channel ****p < 0.0001 using a one-way ANOVA. (H) Individual trajectories of cytoplast chemokinesis in the cell-loading channel. (I-K) Phagocytosis by PMN and cytoplasts was determined using pHRodo-coupled E. coli particles. (I) The absence of nuclei in cytoplasts confirmed by DAPI staining. (J) Phagocytosis of pHrodo-E.coli particles leading to fluorescent color change in PMN and cytoplasts. (K) Phagocytosis index (%Total) was determined. This experiment was performed 3 times. Values represent the mean and error bars SEM. (L) The killing capacity of sorted neutrophils and cytoplasts towards Streptococcus pneumoniae (serotype 1) was determined at different time points indicated. This experiment was performed 2 times. Values represent the mean between duplicate controls and error bars SEM used in a representative experiment.
Figure 5:
Figure 5:. Deficiency in PAD4 results in decreased cytoplasts, neutrophils and IL-17
WT and PAD4−/− mice were sensitized with HDM/LPS and BALFs were collected on day 3. (A) BALF total cell count and (B) leukocyte differential were enumerated (n = 5 mice). (C) Netosis was monitored by BALF DNA levels on day 3 (n = 5 mice), and (D) Western blot for hyper- citrullinated histone H3 (top panel). Ponceau S stain was used as a loading control (bottom panel). (E) Representative flow cytometry plot showing DNA positive PMN and DNA negative cytoplasts in BALFs collected on protocol day 3 after HDM/LPS sensitization from WT and PAD4−/− mice. (F) Percent cytoplasts were enumerated by flow cytometry criteria. (G-K) In addition to the post-sensitization period, the resulting antigen-driven lung inflammation in WT and PAD4−/− mice was determined on protocol day 15 after HDM/LPS sensitization followed by HDM challenge. (G) BALF total cell count and (H) BALF differential count were measured. Lung histology between WT and PAD4−/− mice was evaluated by (I) H&E staining. (J) PAS staining. (K) AHR was measured in anesthetized mice that were mechanically ventilated in the presence of ascending doses of inhaled methacholine. (L) IL-17, and IFN-γ and (M) IL-13, and IL-5. Values represent the mean and error bars SEM (For M and N, error bars represent SD). *p < 0.05, **p < 0.01 using a Student’s t-test.
Figure 6:
Figure 6:. Lung cytoplasts interact with dendritic cells to induce antigen-specific Tlymphocytes.
(a) Schematic diagram showing the antigen-specific T cell activation protocol. Briefly, dendritic cells (DC) were harvested from the lungs of HDM/Veh or HDM/LPS sensitized mice and were incubated overnight with cytoplasts or neutrophils (PMN) at the indicated cell ratios (top of plots) of DC:cytoplasts (1:2 and 1:0.5) and DC:PMN (1:10). The HDM/Veh and HDM/LPS DCs were then co-cultured with naïve CD4+ T cells from DO11.10 mice in the presence of ovalbumin peptide and T cells were re-stimulated and stained for intracellular cytokines (see Methods). (b) Representative flow cytometry plots showing T cells expressing the indicated cytokines. Numbers outside the box represent % of CD4+ T cells. Bar graphs (right) show the absolute cell count for number of cells expressing the indicated cytokine. Data are representative of two experiments.
Figure 7:
Figure 7:. Select cytoplast surface proteins are distinct from intact neutrophils.
BALF from HDM/LPS sensitized mice were stained with different antibodies to detect the expression of these markers on neutrophils and cytoplasts. The expression of the markers is shown in the flow cytometry plots along with the percentage of positivity for each cell population. This experiment was performed twice.
Figure 8:
Figure 8:. Lung NETosis in severe asthma correlates with BALF IL-17.
(A) Picogreen assays of BALF DNA in biospecimens from healthy donors (HD) and subjects with non-severe asthma (NSA) and severe asthma (SA). (B) BALF DNA levels were further stratified into low neutrophil (PMN) (< 5 %) and high PMN (> 5 %). (C) Representative western blot showing hyper-citrullinated histone H3 in BALFs from HD, NSA and SA with low or high PMN count (top panel) and Ponceau S stain as loading control (bottom panel). (D) Correlation between BALF DNA and PMN count in SA. (E) Correlation between BALF IL-17 levels and number of PMN (F) Correlation between BALF IL-17 levels and number of BALF cytoplasts. Pearson correlation r values and significance are noted for each correlation and regression lines are shown.

Comment in

References

    1. Fanta CH, Asthma. N Engl J Med 360, 1002–1014 (2009). - PubMed
    1. Holgate ST, Innate and adaptive immune responses in asthma. Nat Med 18, 673–683 (2012). - PubMed
    1. Levy BD, Noel PJ, Freemer MM, Cloutier MM, Georas SN, Jarjour NN, Ober C, Woodruff PG, Barnes KC, Bender BG, Camargo CA Jr., Chupp GL, Denlinger LC, Fahy JV, Fitzpatrick AM, Fuhlbrigge A, Gaston BM, Hartert TV, Kolls JK, Lynch SV, Moore WC, Morgan WJ, Nadeau KC, Ownby DR, Solway J, Szefler SJ, Wenzel SE, Wright RJ, Smith RA, Erzurum SC, Future Research Directions in Asthma. An NHLBI Working Group Report. Am J Respir Crit Care Med 192, 1366–1372 (2015). - PMC - PubMed
    1. Wenzel SE, Asthma phenotypes: the evolution from clinical to molecular approaches. Nat Med 18, 716–725 (2012). - PubMed
    1. Alcorn JF, Crowe CR, Kolls JK, TH17 cells in asthma and COPD. Annu Rev Physiol 72, 495–516 (2010). - PubMed

Publication types