. 2018 Aug 3;9(1):3066.
doi: 10.1038/s41467-018-05473-1.

Locomotor recovery following contusive spinal cord injury does not require oligodendrocyte remyelination

Affiliations

Locomotor recovery following contusive spinal cord injury does not require oligodendrocyte remyelination

Greg J Duncan et al. Nat Commun. .

Abstract

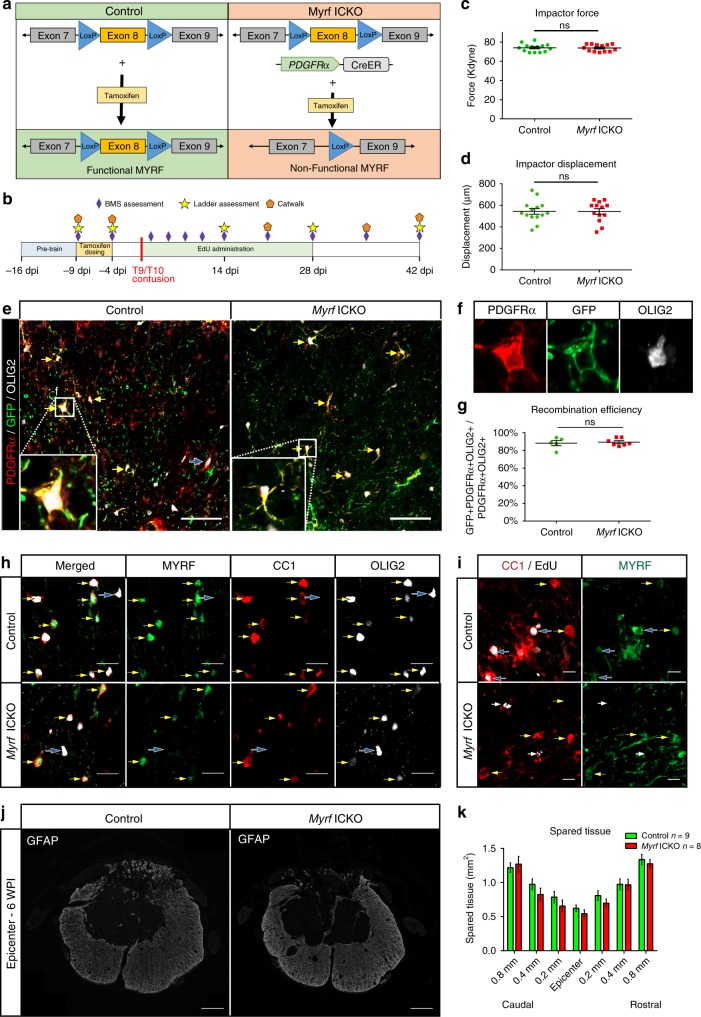
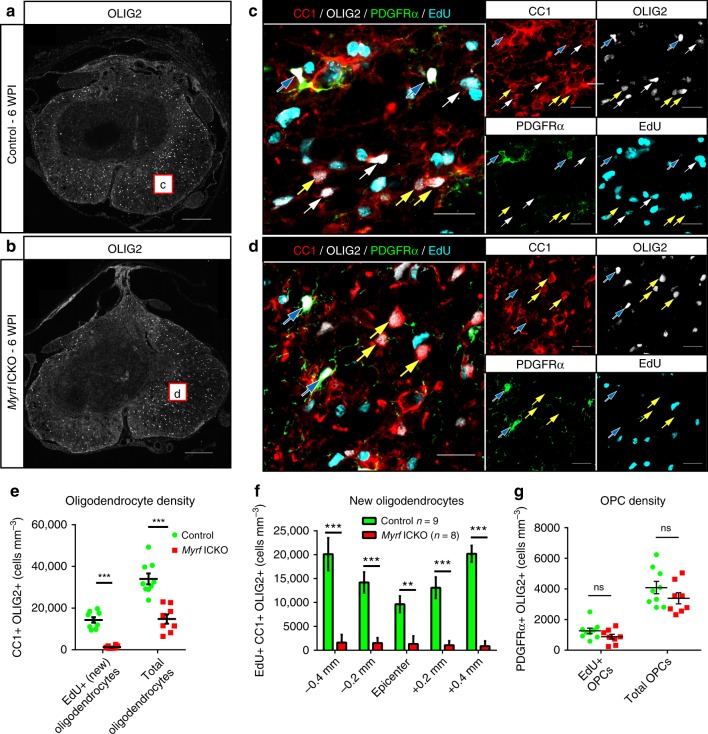
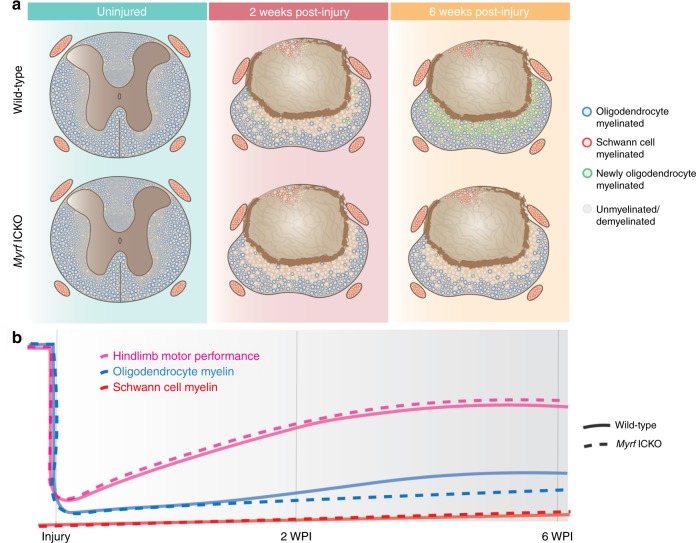
Remyelination occurs after spinal cord injury (SCI) but its functional relevance is unclear. We assessed the necessity of myelin regulatory factor (Myrf) in remyelination after contusive SCI by deleting the gene from platelet-derived growth factor receptor alpha positive (PDGFRα-positive) oligodendrocyte progenitor cells (OPCs) in mice prior to SCI. While OPC proliferation and density are not altered by Myrf inducible knockout after SCI, the accumulation of new oligodendrocytes is largely prevented. This greatly inhibits myelin regeneration, resulting in a 44% reduction in myelinated axons at the lesion epicenter. However, spontaneous locomotor recovery after SCI is not altered by remyelination failure. In controls with functional MYRF, locomotor recovery precedes the onset of most oligodendrocyte myelin regeneration. Collectively, these data demonstrate that MYRF expression in PDGFRα-positive cell derived oligodendrocytes is indispensable for myelin regeneration following contusive SCI but that oligodendrocyte remyelination is not required for spontaneous recovery of stepping.


Conflict of interest statement

The authors declare no competing interests.

Figures

Fig. 1
Fig. 1
Myrf ICKO mice have effective recombination in OPCs following moderate thoracic SCI. a Illustration of transgenes used in this experiment. Myrf ICKO mice were generated by crossing mice with exon 8 of Myrf floxed with mice with the PDGFRα-CreERT2 transgene to produce Myrffl/fl PDGFRα-CreERT2 mice. Control mice lacked the PDGFRα-CreERT2 transgene. b Illustration of experimental timeline. c Impact force (kilodynes) imparted on the spinal cord during SCI indicates no difference between groups (df = 25, t = 0.103, P = 0.912, Student’s t test). d Displacement (µm) of the impactor tip upon contact with the spinal cord during thoracic contusion shows no statistical difference between groups (df = 25, t = 0.037, P = 0.971, Student’s t test). e Overview images from the ventrolateral white matter adjacent to the lesion epicenter in control and Myrf ICKO mice crossed with a tamoxifen inducible reporter that tethers GFP to the membrane (mT/mG). The majority of PDGFRα + OLIG2 + cells are recombined (GFP expression, yellow arrows), but occasional nonrecombined PDGFRα + cells are observed (PDGFRα + GFP−, blue arrows). f Inlays of single optical sections demonstrating colabeling of PDGFRα with GFP in OLIG2 + cells. g Quantification of the recombination efficiency in OPCs at six WPI. There is no difference in recombination between control and Myrf ICKO mice (df = 10, t = 0.368, P = 0.627, Student’s t test). h Single optical confocal section micrographs demonstrating colabeling of MYRF in CC1 + OLIG2 + oligodendrocytes (yellow arrows). OLIG2 + cells lacking CC1 do not have MYRF expression in either group (blue arrows). i Single optical section from control or Myrf ICKO mice demonstrating colabeling of MYRF in CC1 + EdU + oligodendrocytes (blue arrows) in control mice, but not in CC1 + EdU + oligodendrocytes in Myrf ICKO mice (white arrows). j Spinal cord cross-section of the lesion epicenter stained for GFAP at six weeks post injury  (WPI) in Myrf ICKO and control mice. k Quantification of GFAP + spared tissue at different distances from lesion epicenter. There is no significant difference between Myrf ICKO and control mice at any given distance from lesion epicenter (multiple Student’s t test with Holm-Šídák correction, epicenter t = 1.095, P = 0.291) ns non-significant. Scalebars = 50 µm (e), 10 µm (h), 5 µm (i), 100 µm (j) . Error bars are mean ± SEM
Fig. 2
Fig. 2
Myrf ICKO mice generate few new oligodendrocytes in response to SCI. Overview of OLIG2 staining at injury epicenter in a control and b Myrf ICKO mice at six WPI. Boxes are approximate areas where c and d were imaged. c, d Example high magnification representative images of the ventrolateral white matter stained with PDGFRα, OLIG2, CC1, and EdU in control and Myrf ICKO mice. Single channel images are displayed separately on the right. Yellow arrows indicate oligodendrocytes lacking EdU (OLIG2+ CC1+ EdU-negative), which are likely spared oligodendrocytes, while white arrows indicate new oligodendrocytes (OLIG2+ CC1+ EdU+) and blue arrows indicate OPCs (OLIG2+ PDGFRα+ EdU±). There are very few new oligodendrocytes following SCI in Myrf ICKO. e Quantification demonstrates control mice have a higher density of new oligodendrocytes (CC1+ OLIG2+ EdU+) (df = 15, t = 9.224, P < 0.001, Student’s t test) and total oligodendrocytes (CC1+ OLIG2+) (df = 15, t = 5.570, P < 0.001, Student’s t test) compared to Myrf ICKO animals. f Distribution of newly generated cells at different distances from lesion epicenter (OLIG2+ CC1+ EdU+). At all distances, control mice have more new oligodendrocytes relative to Myrf ICKO mice (multiple Student’s t test with Holm-Šídák correction, epicenter t = 4.100, P = 0.001, all others distances P < 0.001). g Quantification of the density of OPCs that have proliferated (PDGFRα+ OLIG2+ EdU+) and total density of OPCs (PDGFRα+ Olig2+) indicate there is no statistical difference between Myrf ICKO and controls (total OPC density: df = 15, t = 1.535, P = 0.146; proliferative OPC density: df = 15, t= 1.267, P = 0.225, Student’s t tests). **P ≤ 0.01 ***P ≤ 0.001. Scale bars = 100 µm (a, b), 20 µm (c, d). Error bars are mean ± SEM
Fig. 3
Fig. 3
Myrf ICKO blocks nearly all oligodendrocyte remyelination in recombined cells after SCI. a Illustration of transgenic mice used. Myrf ICKO and control mice were crossed with a mouse line that has a Rosa26mGFP (mT/mG) membrane-tethered GFP reporter that is Cre inducible. b Overview of injury epicenter at six WPI showing MBP, GFP, and NF200/SMI312 labeling. Representative areas from boxes are shown at higher magnification in c, d. c Single optical confocal sections stained with GFP for recombined cells, MBP to label myelin and NF-200/SMI312 to label axons in control mice. e Photomicrograph of individual oligodendrocyte processes wrapping around NF-200/SMI312 + axons and colabeling with MBP in control mice (yellow arrows). d In Myrf ICKO mice, there are few MBP+ GFP+ sheaths in the ventrolateral white matter. f Myrf ICKO mice have processes that wrap NF-200/SMI312+ but these processes typically do not express MBP (blue arrow). g Quantification of the density of newly generated myelin sheaths (mGFP+ MBP+ around NF200/SMI312+ axons) in spared tissue at two and six WPI. Control mice and Myrf ICKO animals do not differ at two WPI in their newly generated myelin sheath densities, but at six WPI control mice have a higher density of newly generated myelin sheaths compared to Myrf ICKO mice (F(1, 18) = 37.77 two-way repeated measures ANOVA, P < 0.001; two WPI Myrf ICKO vs. Control: P = 0.812 six WPI Myrf ICKO vs. Control: P < 0.001 Tukey’s post hoc test). h Quantification of the percentage of MBP+ sheaths around axons that are GFP+ (new myelin) at six WPI at the lesion epicenter. There are more new myelin sheaths in control mice relative to Myrf ICKO (df = 10, t = 10.69, P < 0.001, Student’s t test). i Quantification of GFP+ processes, which completely wrap axons but fail to express detectable MBP and likely represent ensheathment by oligodendrocyte lineage cells reveals no statistical differences at six WPI (df = 10, t = 1.665, P = 0.127, Student’s t test). j, k The ventrolateral white matter at two WPI showing few GFP+ MBP+ myelin sheaths in both control animals and Myrf ICKO mice. ***P ≤ 0.001, ns non-significant. Scale bar = 100 µm (b) and 10 µm (c, d, j, k). Error bars are mean ± SEM
Fig. 4
Fig. 4
Myrf ICKO does not alter Schwann cell myelination following SCI. a Overview images of spinal cord cross sections from control mT/mG and Myrf ICKO mT/mG mice stained with GFP, the Schwann cell myelin marker P0 and NF-200/SMI312 to label axons. In both Myrf ICKO and controls, P0+ staining is mostly confined to the dorsal column. be Single optical confocal micrographs in either the dorsal or ventral white matter of control and Myrf ICKO mice with the mT/mG reporter. In the dorsal column of control and Myrf ICKO mice there are P0+ sheaths around NF200/SMI312+ axons, some of which colabel with GFP. There are typically very few P0+ sheaths in either the ventral white matter of control or Myrf ICKO mice. f Quantification of the total density of P0 myelin sheaths (P0+) demonstrates there is no difference between groups at two WPI (df = 8, t = 0.128, P = 0.901, Student’s t test) or at six WPI (df = 10, t = 0.154, P = 0.880, Student’s t test). g Quantification of the density of newly generated P0 myelin sheaths (P0+ mGFP+) demonstrates there is no difference between groups at two WPI (df = 8, t = 0.218, P = 0.883, Student’s t test) or at six WPI (df = 10, t = 0.001, P = 0.999. Student’s t test). h The percentage of P0+ myelin sheaths, which are derived from PDGFRα+ cells relative to the total P0+ myelin sheaths do not differ between knockouts and controls at two WPI (df = 8, t = 0.621, P = 0.552. Student’s t test) or at six WPI (df = 10, t = 0.364, P = 0.724, Student’s t test). ns =non-significant. Scale bar = 100 µm (a), 10 µm (be). Error bars are mean ± SEM
Fig. 5
Fig. 5
Chronic demyelination of spared axons in Myrf ICKO six weeks following SCI. a Whole cross sections of control and Myrf ICKO spinal cords at lesion epicenter stained with Toluidine blue at six WPI. The majority of myelin is found in the ventrolateral white matter. b High magnification images of box inset from a in Myrf ICKO and control animals. c Quantification of myelinated axons in the spared white matter. Myrf ICKO animals have significantly fewer myelinated axons when compared to control animals (df = 8, t = 2.475, P = 0.038, Student’s t test). d Example transmission electron micrographs of the injured mouse lesion epicenters. Blue shading depicts thinly myelinated axons, pink shading depicts axons devoid of myelin, and green shading depicts axons with thick myelin sheaths. Many thinly myelinated axons are found in control mice whereas Myrf ICKO mice are almost completely devoid of thinly myelinated large caliber axons, and instead have demyelinated axons greater than 1 µm in size at six WPI. e Frequency distribution of g-ratios of myelinated axons indicate a shift towards higher g-ratios (more thinly myelinated axons) in the controls relative to Myrf ICKO (P < 0.001, Kolmogorov–Smirnov test). f Scatter plot comparing g-ratio to axon diameter of axons quantified in the spared white matter of injured animals demonstrating a difference between controls and Myrf ICKO (F = 25, DFn= 1, DFd = 1340, P < 0.0001, linear regression). Dashed box highlights axons that lack myelin. g Quantification showing more unmyelinated axons larger than 1 µm in the spared white matter of Myrf ICKO compared to controls at six WPI (df = 6, t = 4.858, P = 0.003, Student’s t-test). *P ≤ 0.05, **P ≤ 0.01 Scale bars = 100 µm (a), 5 µm (b), 1 µm (f). Error bars are mean ± SEM
Fig. 6
Fig. 6
Myrf deletion from PDGFRα+ cells does not impair motor recovery following moderate thoracic contusive SCI. a Time course of locomotor function evaluated by open field BMS. While Myrf ICKO and controls did not differ after SCI (F(3, 39) = 286.0, P < 0.001; injured Myrf ICKO vs. control P = 0.518), both SCI groups were statistically different from uninjured controls at all time-points postinjury (P < 0.001). b On the BMS subscore, there is no difference between Myrf ICKO and controls (F(3, 39) = 388.0, P < 0.001; injured Myrf ICKO vs. control P = 0.966). c There is no difference between Myrf ICKO and controls in the percentage of errors (error/error + success) on the horizontal ladder after SCI (F(3, 38) = 25.86, P < 0.001, injured Myrf ICKO vs injured control Tukey’s post hoc P=0.942). d An illustration of paw recordings from the Catwalk along with parameters in gi used to assess gait. LH left hindlimb; LF left forelimb; RF right forelimb; RH right hindlimb. e Example of the time course in which a paw is in contact with platform (colored boxes). f Example recordings of three full step cycles from the Catwalk prior to injury and tamoxifen dosing, at three WPI, and at six WPI. gl No differences in gait were observed between Myrf ICKO and controls either with or without an injury on g hindlimb stride length (F(3, 37) = 44.13, P < 0.001; injured Myrf ICKO vs. injured control P = 0.977). h Hindlimb base of support (F(3, 37) = 48.09, P < 0.001; injured Myrf ICKO vs. injured control P = 0.630). i Combined paw position (F(3, 37) = 52.74, P < 0.001; injured Myrf ICKO vs. injured control P = 0.983). j Hindlimb duty cycle (F(3, 37) = 0.933, P = 0.435; injured Myrf ICKO vs. injured control P = 0.738). k Percent of run with one or two paws on the platform (F(3, 37) = 17.47, P < 0.001; injured Myrf ICKO vs injured control P = 0.651). l Three or four paws on the platform (F(3, 37) 15.46. P < 0.001; injured Myrf ICKO vs. injured control P = 0.934). Groups were compared at all post injury time points. All statistical comparisons were made using a two-way repeated measures ANOVA, and a Tukey’s post hoc for individual group differences. Error bars are mean ± SEM
Fig. 7
Fig. 7
New oligodendrocyte and Schwann cell myelination after SCI and its relationship to locomotor recovery. a Schematic of the uninjured and injured mouse spinal cord two and six WPI following moderate dorsal thoracic contusion. In the uninjured spinal cord, axons are myelinated solely by oligodendrocytes and peripheral nerves are myelinated by Schwann cells. By two WPI, the lesion epicenter is ringed by a glial scar and mostly devoid of axons. Demyelinated axons are seen in a gradient increasing outwards from the medial spinal cord. By six WPI, extensive oligodendrocyte remyelination is observed throughout the ventrolateral white matter in control mice with functional MYRF, but Myrf ICKO mice fail to produce new oligodendrocyte myelin. Schwann cell myelination is generally confined to the dorsal column. The degree of Schwann cell myelination does not differ in the injured spinal cord between Myrf ICKO and control mice. b Diagram illustrating the relative amount and rate of open field hindlimb motor performance compared to the extent of oligodendrocyte and Schwann cell myelin after injury in the spinal cord. After thoracic SCI, there is a decline in both hindlimb motor performance and number of myelinated axons in the CNS. The majority of recovery of hindlimb locomotor function on open field testing occurs within the first two weeks in both Myrf ICKO and controls. In contrast, the vast majority oligodendrocyte remyelination does not occur until after two weeks postinjury. Therefore, the relative time course of oligodendrocyte remyelination is not associated with hindlimb motor recovery after SCI. In contrast, Schwann cell myelination occurs within the first two weeks after SCI and occurs at a relatively steady rate. The height of the lines is approximately proportional to the extent of loss and subsequent recovery after SCI

References

    1. Hilton BJ, Bradke F. Can injured adult CNS axons regenerate by recapitulating development? Development. 2017;144:3417–3429. doi: 10.1242/dev.148312. - DOI - PubMed
    1. Norenberg MD, Smith J, Marcillo A. The pathology of human spinal cord injury: defining the problems. J. Neurotrauma. 2004;21:429–440. doi: 10.1089/089771504323004575. - DOI - PubMed
    1. Fawcett JW, et al. Guidelines for the conduct of clinical trials for spinal cord injury as developed by the ICCP panel: spontaneous recovery after spinal cord injury and statistical power needed for therapeutic clinical trials. Spinal Cord. 2007;45:190–205. doi: 10.1038/sj.sc.3102007. - DOI - PubMed
    1. Steeves JD. Bench to bedside: challenges of clinical translation. Prog. Brain Res. 2015;218:227–239. doi: 10.1016/bs.pbr.2014.12.008. - DOI - PubMed
    1. Hilton BJ, et al. Re-establishment of cortical motor output maps and spontaneous functional recovery via spared dorsolaterally projecting corticospinal neurons after dorsal column spinal cord injury in adult mice. J. Neurosci. 2016;36:4080–4092. doi: 10.1523/JNEUROSCI.3386-15.2016. - DOI - PMC - PubMed

Publication types

MeSH terms

Substances