. 2018 Aug 3;8(1):11687.
doi: 10.1038/s41598-018-29954-x.

High-throughput optimisation of light-driven microalgae biotechnologies

Affiliations

High-throughput optimisation of light-driven microalgae biotechnologies

Shwetha Sivakaminathan et al. Sci Rep. .

Abstract

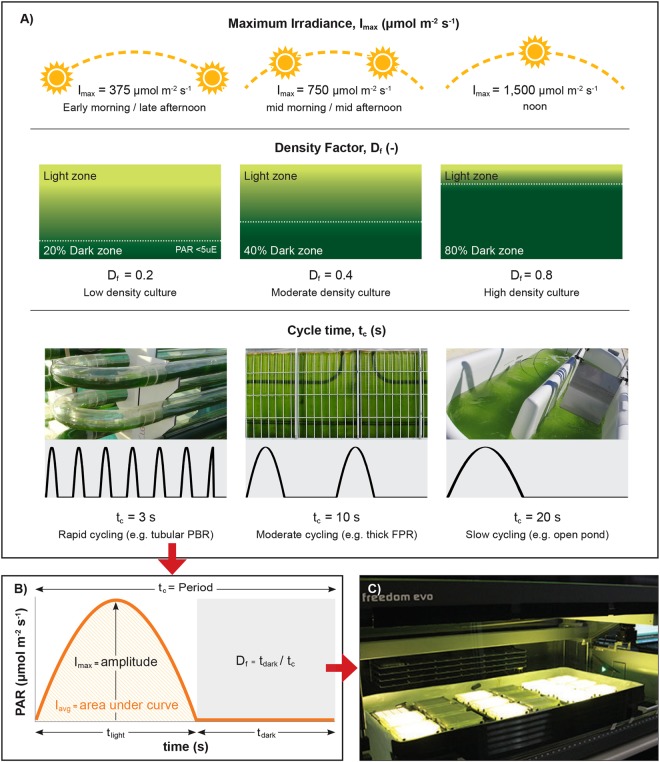
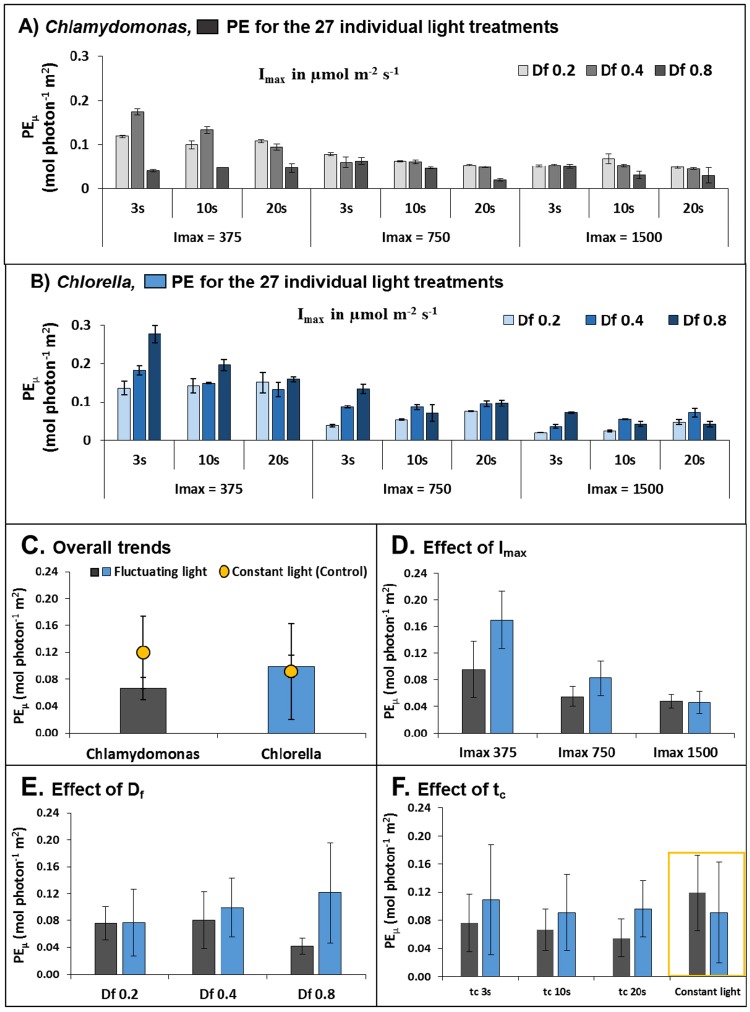
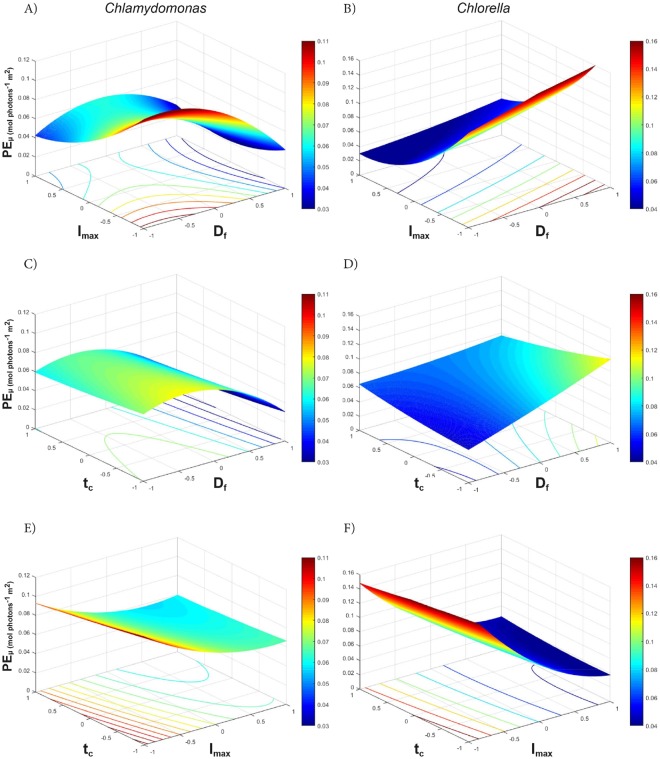
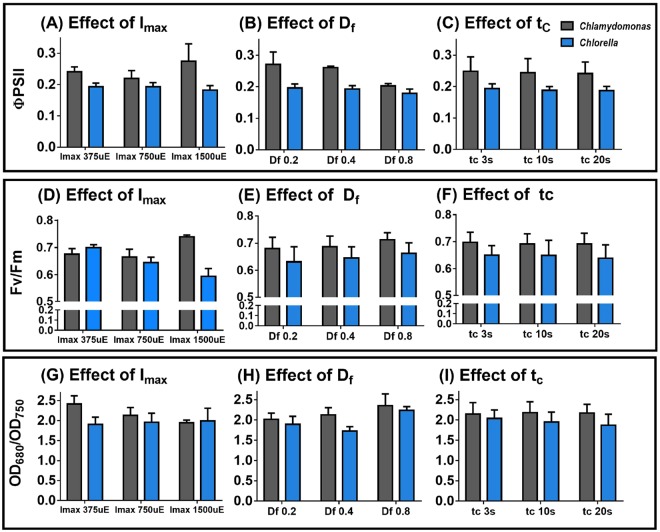
Microalgae biotechnologies are rapidly developing into new commercial settings. Several high value products already exist on the market, and systems development is focused on cost reduction to open up future economic opportunities for food, fuel and freshwater production. Light is a key environmental driver for photosynthesis and optimising light capture is therefore critical for low cost, high efficiency systems. Here a novel high-throughput screen that simulates fluctuating light regimes in mass cultures is presented. The data was used to model photosynthetic efficiency (PEµ, mol photon-1 m2) and chlorophyll fluorescence of two green algae, Chlamydomonas reinhardtii and Chlorella sp. Response surface methodology defined the effect of three key variables: density factor (Df, 'culture density'), cycle time (tc, 'mixing rate'), and maximum incident irradiance (Imax). Both species exhibited a large rise in PEµ with decreasing Imax and a minimal effect of tc (between 3-20 s). However, the optimal Df of 0.4 for Chlamydomonas and 0.8 for Chlorella suggested strong preferences for dilute and dense cultures respectively. Chlorella had a two-fold higher optimised PEµ than Chlamydomonas, despite its higher light sensitivity. These results demonstrate species-specific light preferences within the green algae clade. Our high-throughput screen enables rapid strain selection and process optimisation.


Conflict of interest statement

The authors declare no competing interests.

Figures

Figure 1
Figure 1
Experimental design for high-throughput light simulations of cells cycling in outdoor microalgae mass cultures. (A) Depicts the 3 factors that affect the light regime experienced by cells cycling in mass cultures: Imax, Df and tc, and the levels used for the full factorial experimental design which are based on ‘typical’ outdoor conditions. (B) Each combination of light factors was programmed by changing the light intensity of the LEDs over the cycle time, assuming cell cycling occurs in a sinusoidal trajectory. Here, Imax, is the amplitude of the sine, simulating the maximum irradiance that a cell would receive when at the ‘surface’ of a mass culture, Df, is the proportion of time that PAR is below 5 µmol m−2 s−1 in one period; this simulates the fraction of time that a cell spends in the dark, depending on the culture density, and tc is the period of one sine wave, that simulates the time required for a cell to cycle through the reactor. Iavg is the integration of light received, simulating the average irradiance or light dose received the by cell. Here tlight and tdark are the time cells receive PAR (>5 µmol m−2 s−1) and no PAR (<5 µmol m−2 s−1) respectively. (C) The programmed LEDs form part of an 18-plate microwell robotic system. Chlamydomonas and Chlorella were incubated in 96-well plates placed on LED arrays with one LED per microwell and one unique light regime per plate. All light regimes occurred over a photoperiod of 16 h day−1 and a dark period of 8 h day−1.
Figure 2
Figure 2
Trends in photosynthetic efficiency (PEµ) under different light regimes of Chlamydomonas (grey bars) and Chlorella (blue bars). (A and B) individual PEµ data of the 27 light treatments for Chlamydomonas and Chlorella, respectively (n = 3), (C) the overall trends in averaged PEµ values over all conditions of Df, Imax and tc tested (n = 27), (D) the averaged PEµ values of Df and tc combined to show effect of Imax (n = 9), (E) the averaged PEµ values of Imax and tc combined to show effect of Df (n = 9) and (F) the averaged PEµ values of Df and Imax combined to show effect of tc (n = 9). Error bars represent the standard deviation (SD) of individual treatments within biological triplicates (A,B) and between different treatments (C–F).
Figure 3
Figure 3
Response surface (3D) and contour (2D) plots of two-way interactions of factors affecting the PEµ (mol photon−1 m2) of Chlamydomonas (A,C,E) and Chlorella (B,D,F). The colour bar depicts high PEµ values in red and lower PEµ values in blue.
Figure 4
Figure 4
Trends in underlying photosynthetic mechanisms. Plots depict averaged effects of Imax, Df and tc on ΦPSII (A,B and C) (n = 2); Fv/Fm (D,E and F) and OD680/OD750 (G,H and I) respectively for Chlamydomonas (grey bars) and Chlorella (blue bars) (n = 3, Error bars represent standard deviation).

References

    1. Singh S, Kate BN, Banerjee UC. Bioactive Compounds from Cyanobacteria and Microalgae: An Overview. Critical Reviews in Biotechnology. 2005;25:73–95. doi: 10.1080/07388550500248498. - DOI - PubMed
    1. Borowitzka, M. High-value products from microalgae—Their development and commercialisation. Vol. 25 (2013).
    1. Carrera Pacheco SE, Hankamer B, Oey M. Optimising light conditions increases recombinant protein production in Chlamydomonas reinhardtii chloroplasts. Algal Research. 2018;32:329–340. doi: 10.1016/j.algal.2018.04.011. - DOI
    1. Koutra E, Economou CN, Tsafrakidou P, Kornaros M. Bio-Based Products from Microalgae Cultivated in Digestates. Trends in Biotechnology. 2018 - PubMed
    1. Chew KW, et al. Microalgae biorefinery: High value products perspectives. Bioresource Technology. 2017;229:53–62. doi: 10.1016/j.biortech.2017.01.006. - DOI - PubMed

Publication types

MeSH terms

Substances