. 2018 Aug 3;8(1):11653.
doi: 10.1038/s41598-018-29900-x.

A new quinoline-based chemical probe inhibits the autophagy-related cysteine protease ATG4B

Affiliations

A new quinoline-based chemical probe inhibits the autophagy-related cysteine protease ATG4B

D Bosc et al. Sci Rep. .

Abstract

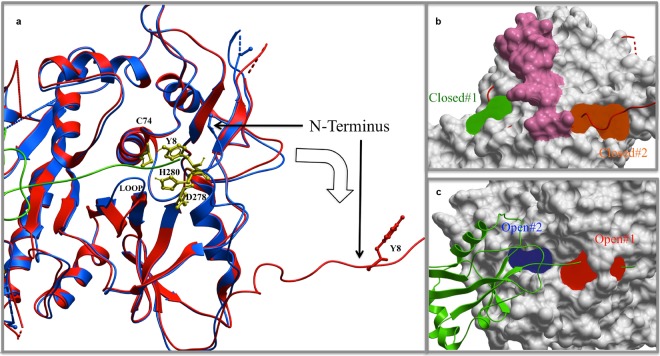
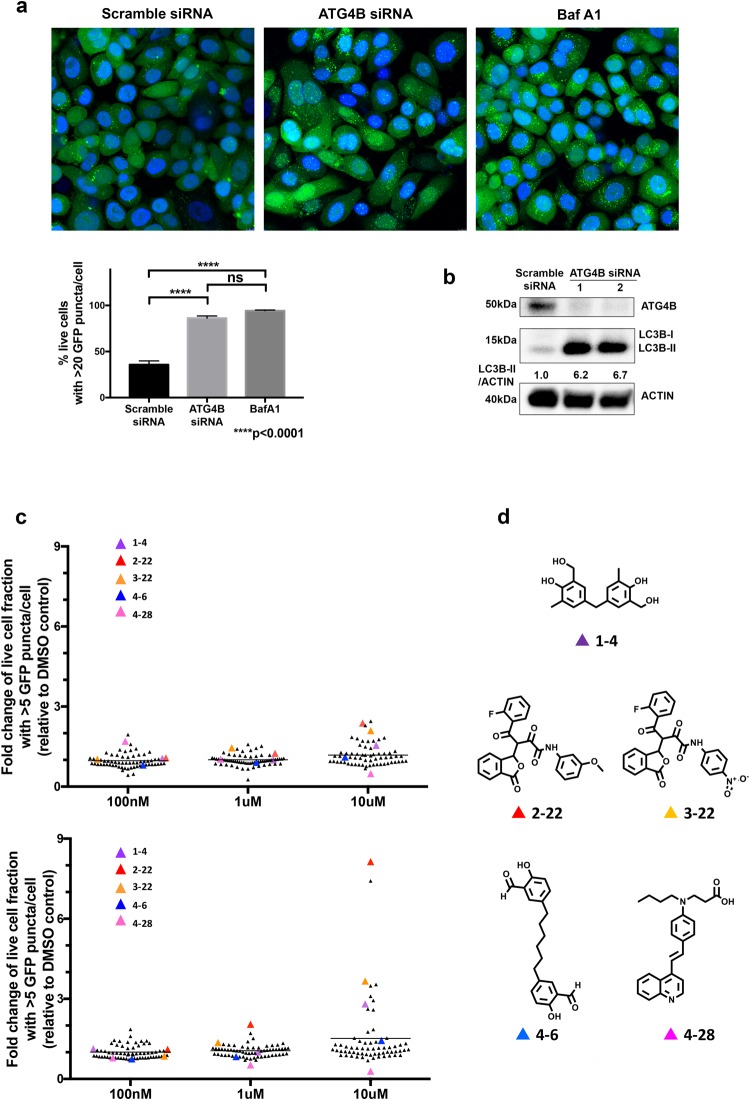
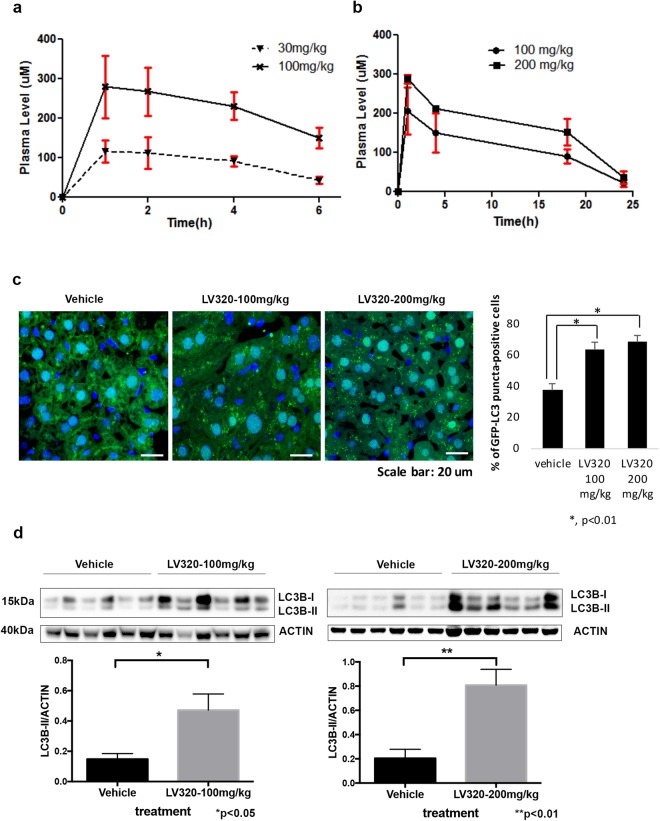
The cysteine protease ATG4B is a key component of the autophagy machinery, acting to proteolytically prime and recycle its substrate MAP1LC3B. The roles of ATG4B in cancer and other diseases appear to be context dependent but are still not well understood. To help further explore ATG4B functions and potential therapeutic applications, we employed a chemical biology approach to identify ATG4B inhibitors. Here, we describe the discovery of 4-28, a styrylquinoline identified by a combined computational modeling, in silico screening, high content cell-based screening and biochemical assay approach. A structure-activity relationship study led to the development of a more stable and potent compound LV-320. We demonstrated that LV-320 inhibits ATG4B enzymatic activity, blocks autophagic flux in cells, and is stable, non-toxic and active in vivo. These findings suggest that LV-320 will serve as a relevant chemical tool to study the various roles of ATG4B in cancer and other contexts.


Conflict of interest statement

The authors declare no competing interests.

Figures

Figure 1
Figure 1
Binding pocket prediction in ATG4B. (a) Ribbon model to show the conformational changes from a free, inactive form (blue) to an active, substrate-binding form (red) of ATG4B. Key catalytic residues and the N-terminal Tyr8 are displayed and labelled. LC3B is in the green ribbon model. Two significant conformational changes occurred at the regulatory loop and the N-terminus. (b) Two pockets (green and orange) identified on the inactive conformation (grey skin model). The active conformation is displayed in red ribbon. The skin formed by the N-terminal of the inactive conformation is colored pink. (c) Two pockets (red and blue) identified on the surface of the active conformation (grey skin model). The LC3 is shown in green ribbon.
Figure 2
Figure 2
Screening of candidate ATG4B inhibitors. (a) Representative images of SKBR3-hrGFP-LC3B cells treated with control scramble-siRNA, ATG4B-siRNA, or bafilomycin A1 with quantitation of GFP-LC3B puncta shown in the bar graph below. Five randomly selected fields for each condition were analyzed in 2 independent experiments; error bars, SEM. (b) Representative western blot (n = 3) shows elevated LC3B-II levels in SKBR3 cells treated with ATG4B-siRNA compared to the control scramble-siRNA. Full-length blots are presented in Fig. S1. (c) Effect of small molecule compounds on the fraction of live cells with greater than five GFP-LC3B puncta in SKBR3 hrGFP-LC3 cells. Compounds were tested at three concentrations (100 nM, 1 μM and 10 μM) and two time-points, 6 h (top graph) and 24 h (bottom graph). The average values (normalized to DMSO vehicle control) from 3 independent experiments are shown. Colored triangles indicate 5 compounds that showed a statistically significant difference (p < 0.05) compared to vehicle control at one or more concentrations and timepoints and also inhibited ATG4B enzyme activity in a dose dependent manner (Table S1). Of these 5 compounds, only 2–22 and 3–22 showed a statistically significant difference at the 6 h time-point, while all 5 compounds showed a significant difference at one or more concentrations at the 24 h time-point. (d) Structure of 5 inhibitors of ATG4B. Compounds are named by screening codes and relate to NCI codes as depicted in Table S1. Titration curves are presented in Table S1.
Figure 3
Figure 3
428 inhibits ATG4B and blocks autophagic flux in cells. (a) Predicted binding model of compound 4–28 bound to ATG4B pocket closed#2. (b) Reactivity of 4–28 under UV irradiation affording the cis-isomer and hypothetically the cyclized form (blue pathway) and under TCEP treatment (red pathway). (c) Dose response curve of 4–28 obtained by mass spectrometry assay using GFP-LC3-YFP assay. n = 3; error bars, SEM (d) Dose response curve of 4–28 with fluorimetric assay. n = 3; error bars represent SEM (e) LC3B-based autophagy flux assay for ATG4B-siRNA. MCF7 cells treated with control scramble-siRNA, ATG4B-siRNA1, or ATG4B-siRNA2, in the absence or presence of bafilomycin A1 (Baf A1). n = 3; error bars, SEM; *p < 0.05. Full-length blots are presented in Fig. S1. (f) LC3B-based autophagy flux assay for 4–28. MCF7 cells were treated with vehicle control or the indicated amounts of 4–28, in the absence or presence of bafilomycin A1 (Baf A1). n = 3; error bars, SEM; *p < 0.05. Full-length blots are presented in Fig. S1.
Figure 4
Figure 4
LV-320 arose from the SAR study and binds ATG4B. (a) Structure of LV-320. (b) IC50 of LV-320 in ATG4B cleavage assay using the fluorescent peptide pim-FG-PABA-AMC as substrate; n = 3; error bars, SEM (c) Binding of LV-320 with ATG4B determined by MST. (n = 3) (d) and (e). LV-320 depresses both the Vmax (d) and KM (e) in an ATG4B enzymatic assay with a fluorogenic peptide substrate, concordant with an uncompetitive mode of inhibition. Error bars, SEM. Experiments were performed with technical quadruplicates and representative biological duplication. (f) IC50 of LV-320 in ATG4A cleavage assay using pim-FG-PABA-AMC as substrate. n = 4; error bars, SEM.
Figure 5
Figure 5
LV-320 blocks starvation-induced autophagic flux in vitro. (a) LV-320 treatment of SKBR3, MCF7, JIMT1, and MDA-MB-231 cells results in accumulation of LC3B-II and p62 in a dose dependent manner. Corresponding mean LC3B-II/actin values were determined using densitometry analysis; error bars, SEM (n = 3). Full-length blots are presented in Fig. S1. (b) LV-320 treatment, similar to ATG4B knockdown, results in inhibition of autophagic flux in MDA-MB-231 cells. Autophagic flux assay using saturating (40 nM) concentrations of bafilomycin A1 (Baf A1) was applied for the assessment of LC3B-II accumulation. Top: The representative western blot shows higher accumulation of LC3B-II following ATG4B siRNA treatment compared to scramble siRNA control; LC3B-II accumulation resulting from ATG4B knockdown is comparable to that from treatment with bafilomycin A1. Bottom: western blot shows higher accumulation of LC3B-II in cells treated with LV-320 (120 µM for 48 hours) compared to DMSO control; addition of Baf A1 to LV-320 did not result in further accumulation of LC3B-II. Corresponding mean LC3B-II/actin values were determined using densitometry analysis; n = 3; error bars, SEM; *p < 0.05. Full-length blots are presented in Fig. S1. (c) LV-320 results in accumulation of LC3B-II and not pro-LC3B. Representative western blot shows parental JIMT-1 cells treated with scramble control siRNA (lane 1), ATG4B-siRNA (lane 2), vehicle control (lane 4), or LV-320 (75 µM; 24 h; lane 5). The control ATG4B-KO JIMT-1 cells showing the location of pro-LC3B are in lane 3. Samples were run on a 4–12% Bis-tris gradient gel. The banding pattern shown is representative of 3 independent experiments. Full-length blots are presented in Fig. S1. (d) Representative western blot shows treatment of MDA-MB-231 cells with LV-320 (120 µM for 24 h) resulted in reduced levels of GABARAP-II. Addition of bafilomycin A1 (Baf A1; 40 nM) or Wortmannin (1 µM) during the final 4 h of treatment had no effect. The GABARAP-II/actin values were determined using densitometry analysis; n = 3; error bars, SEM; *p < 0.05, Student’s t-test. Full-length blots are presented in Fig. S1.
Figure 6
Figure 6
LV-320 blocks starvation-induced autophagic flux in vitro and does not act like CQ. (a) LV-320 treatment, similar to ATG4B knockdown, inhibits autophagic flux. MDA-MB-231 cells stably expressing mRFP-EGFP-LC3B protein were treated with either ATG4B-siRNA or scramble-siRNA, as well as either DMSO or LV-320 (120 µM for 48 hours), with and without bafilomycin A1, under starved conditions. Decrease in red puncta (autolysosomes) relative to yellow puncta (autophagosomes) indicates decreased autophagic flux in response to treatment. Bar graphs show average ratio (mean ± SEM) of red to yellow puncta per cell, n = 3; P values are based on the one-way ANOVA with Dunnett post-test. Scale bar, 50 µm. (b) MDA-MB-231 cells were treated with DMSO (vehicle control), CQ (40 μm) or LV-320 (120 μM) for 24 hours before being stained with Lysotracker Red® (LTR) and DRAQ5. Mean levels of gray intensity were measured from the LTR channel per image, made relative to number of cells and normalized to the DMSO control. Bar graph shows mean LTR intensity per cell per treatment (mean ± SEM). At least 200 cells were analyzed per treatment in each of 2 independent experiments; P values are based on the Kruskal-Wallis test with Dunnetts post-test, *p < 0.05, ****p < 0.0001. Scale bar, 10 μm. (c) LV-320 does not inhibit lysosomal degradation. Fluorescence intensity of SKBR3 cells treated with DQ-Red BSA (10 µg/ml) in combination with either DMSO (vehicle control; dark blue), CQ (20 µM; red), LV-320 (75 µM; light blue) or LV-320 (100 µM; pink). Unstained control cells are shown in gray. Histogram is representative of 3 independent biological replicates, which are shown in the scatter plot; *p < 0.05, P values are based on one-way ANOVA with Dunnett post-test.
Figure 7
Figure 7
LV-320 is bioavailable and affects LC3B levels in vivo. (a) Plasma levels of LV-320 in BL/6 mice (n = 3, serial samples) after oral doses of 30 or 100 mg/kg; error bars, SD (b) Plasma levels of LV-320 in BL/6 mice (n = 3, serial samples) after oral doses of 100 or 200 mg/kg; error bars, SD (c) LV-320 treatment results in accumulation of GFP-LC3 puncta in mouse liver tissues. Representative images from each treatment condition are shown in the left panel. Scale bar, 20 µm. Quantitative data are shown in the right panel. The percentage of GFP-LC3 puncta positive cells from 5 fields were calculated for each sample; and 6 samples from each treatment condition were grouped; *P < 0.01 (Student’s two-tailed t-test). (d) LV-320 treatment results in accumulation of LC3B-II in a dose-dependent manner. Corresponding mean LC3B-II/actin values (per treatment group) were determined using densitometry analysis; error bars, SEM. *p < 0.05, **p < 0.01, Student’s t-test. Full-length blots are presented in Fig. S1.

References

    1. Choi AM, Ryter SW, Levine B. Autophagy in human health and disease. N Engl J Med. 2013;368:651–662. doi: 10.1056/NEJMra1205406. - DOI - PubMed
    1. Jiang P, Mizushima N. Autophagy and human diseases. Cell research. 2014;24:69–79. doi: 10.1038/cr.2013.161. - DOI - PMC - PubMed
    1. Rubinsztein DC, Codogno P, Levine B. Autophagy modulation as a potential therapeutic target for diverse diseases. Nat Rev Drug Discov. 2012;11:709–730. doi: 10.1038/nrd3802. - DOI - PMC - PubMed
    1. Dowdle WE, et al. Selective VPS34 inhibitor blocks autophagy and uncovers a role for NCOA4 in ferritin degradation and iron homeostasis in vivo. Nat Cell Biol. 2014;16:1069–1079. doi: 10.1038/ncb3053. - DOI - PubMed
    1. Egan DF, et al. Small Molecule Inhibition of the Autophagy Kinase ULK1 and Identification of ULK1 Substrates. Mol Cell. 2015;59:285–297. doi: 10.1016/j.molcel.2015.05.031. - DOI - PMC - PubMed

Publication types

MeSH terms