. 2018 Aug 3;9(1):3070.
doi: 10.1038/s41467-018-05368-1.

Genomic instability in mutant p53 cancer cells upon entotic engulfment

Affiliations

Genomic instability in mutant p53 cancer cells upon entotic engulfment

Hannah L Mackay et al. Nat Commun. .

Erratum in

Abstract

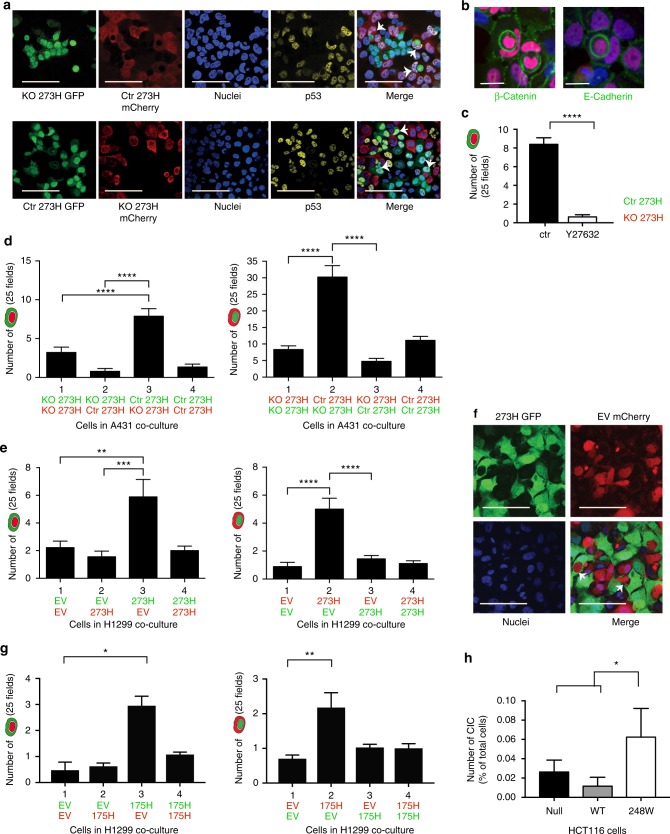
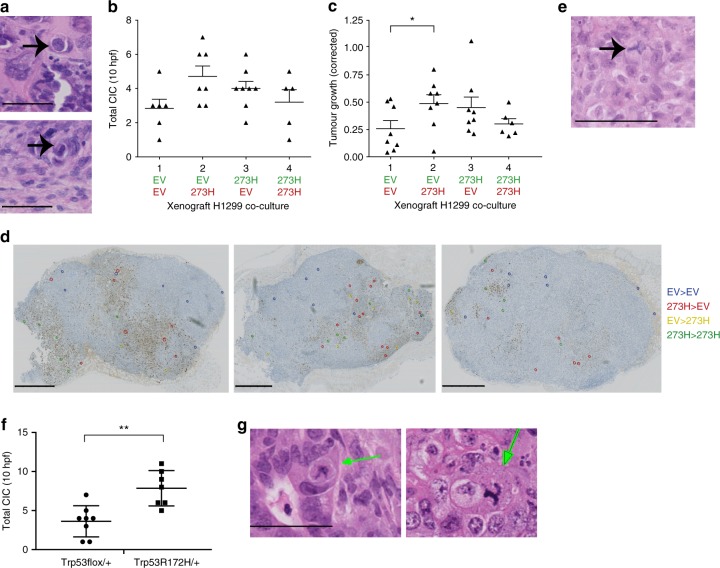
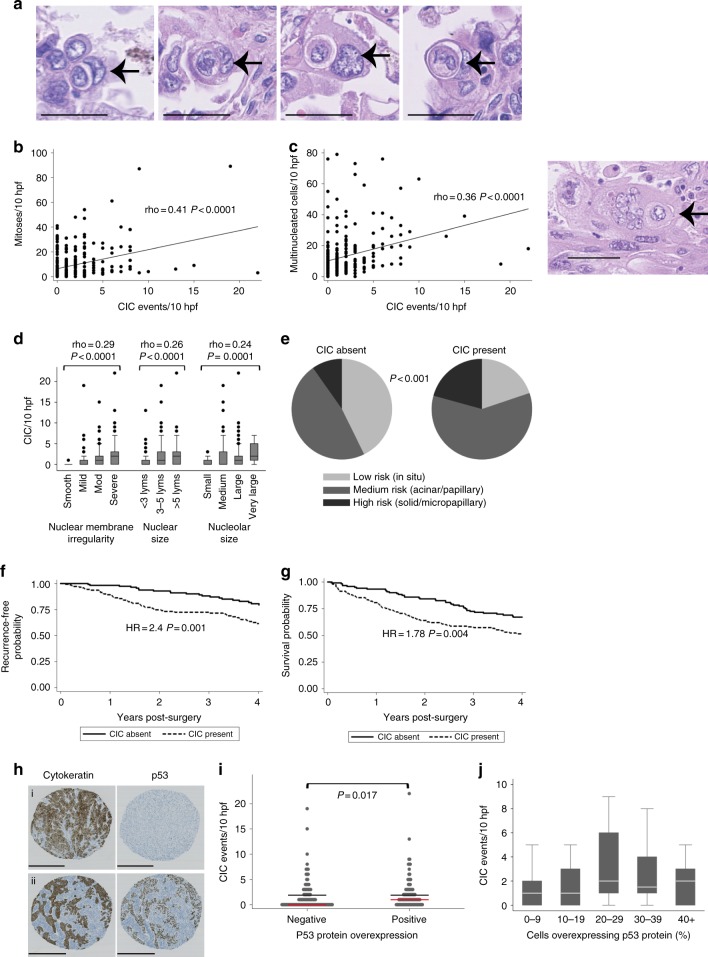
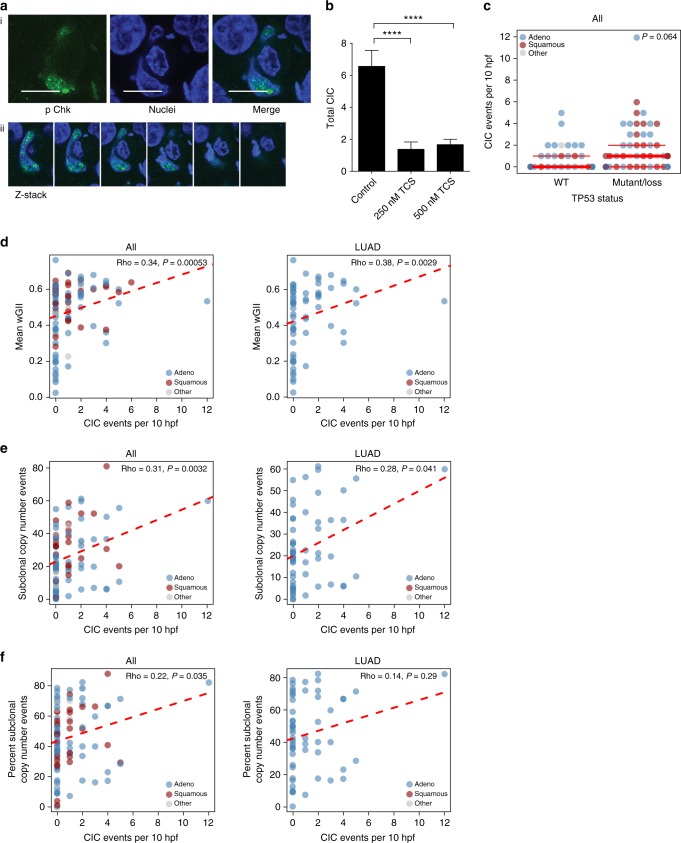
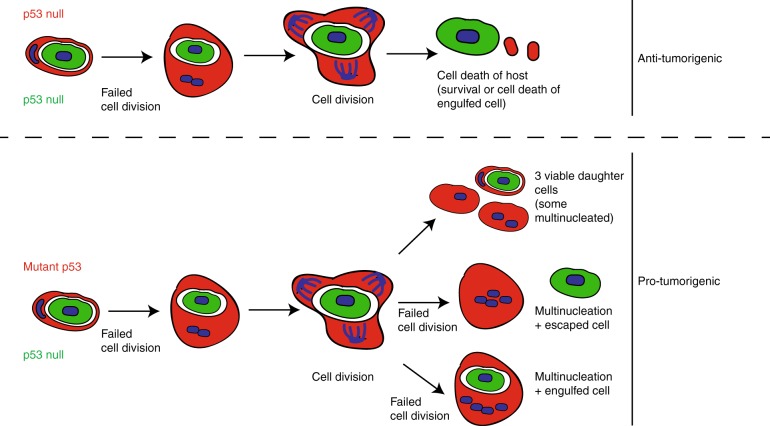
Cell-in-cell (CIC) structures are commonly seen in tumours. Their biological significance remains unclear, although they have been associated with more aggressive tumours. Here we report that mutant p53 promotes CIC via live cell engulfment. Engulfed cells physically interfere in cell divisions of host cells and for cells without p53 this leads to host cell death. In contrast, mutant p53 host cells survive, display aberrant divisions, multinucleation and tripolar mitoses. In xenograft studies, CIC-rich p53 mutant/null co-cultures show enhanced tumour growth. Furthermore, our results show that CIC is common within lung adenocarcinomas, is an independent predictor of poor outcome and disease recurrence, is associated with mutant p53 expression and correlated to measures of heterogeneity and genomic instability. These findings suggest that pro-tumorigenic entotic engulfment activity is associated with mutant p53 expression, and the two combined are a key factor in genomic instability.


Conflict of interest statement

The authors declare no competing interests.

Figures

Fig. 1
Fig. 1
CIC occurrences are predominantly seen in mutant p53 cells. a Confocal images of CIC formed in A431 with a CRISPR control plasmid (Ctr 273H) or CRISPR p53 knock out (KO 273H) cells (in addition to fluorescent constructs as indicated). Arrows indicate CIC, p53 (yellow), nuclei (Dapi). Scale bars = 100 μm. b Immune fluorescent staining of β-Catenin (left) or E-Cadherin (right) in green, p53 in red and Dapi in blue. Scale bars = 50 μm. c Number of CIC events in mutant p53 (green)/KO p53 (red) co-cultures in which engulfment was quantified with or without Y27632 (5 μM) after 48 h. Each bar represents +/−SEM of triplicate experiments ****p < 0.0001. d Quantification of CIC in A431 cells. Co-cultures were seeded in the following combinations; 1: KO 273H/mCherry with KO 273H/eGFP, 2: KO 273H/eGFP with Ctr 273H/mCherry, 3: Ctr 273H/eGFP with KO 273H/mCherry and 4: Ctr 273H/eGFP with Ctr 273H/mCherry. Total numbers of CIC occurrences are shown where the outer engulfing cell is green (left graph) or red (right graph). Each bar represents +/−SEM of triplicate experiments ****p < 0.0001. e Quantification of CIC in four different co-cultures of H1299 cells transfected with EV or 273H along with eGFP or mCherry; 1 EV/eGFP with EV/mCherry, 2 EV/eGFP with 273H/mCherry, 3 EV/mCherry with 273H/eGFP and 4 273H/eGFP with 273H/mCherry. Graphs show CIC with occurrences for each condition based on whether the outer engulfing cell was green or red as indicated by cartoons in the legend. Error bars represent SEM of triplicate experiments **p = 0.0011, ***p = 0.0002 ****p < 0.0001. f Confocal images of CIC (indicated with arrows) in green H1299 cells (transfected with R273H mutant p53 and eGFP) and red H1299 cells (transfected with EV and mCherry). Nuclei (DAPI) in blue. Scale bars = 50 μm. g Same as e, but with the 273H mutant p53 H1299 cell lines replaced with 175H mutant p53. Each bar represents +/−SEM of triplicate experiments *p = 0.048, **p = 0.008 h Percentage engulfment in HCT116 null, WT or mutant p53 R248W cells. Each bar represents +/−SEM of triplicate experiments *p = 0.016 (null vs R248W) or p = 0.012 (WT vs R248W)
Fig. 2
Fig. 2
Cell surface molecules regulated by mutant p53 are involved in CIC formation. a 3D images of a CIC structure in H1299 cells. The top right insert is showing the horizontal plane by confocal imaging. Scale bar = 5 μm. b Fluorescent image of live A431 cells that have been labeled with pHrodo. Scale bars = 50 μm. c Confocal image of A431 cells that have been stained with Calcein AM. Scale bars = 20 μm. d Quantification of CIC for H1299 co-cultures seeded on plastics coated with different matrices. Each bar represents +/−SEM of triplicate experiments **p = 0.0072. e Immunofluorescence image of a CIC structure formed between H1299 cells (green and red as indicated). Dapi is in blue and CD49e (integrin α5) is in yellow. Scale bar = 50 μm. f Number of CIC events in mutant p53 (green)/KO p53 (red) A431 co-cultures in which engulfment by red cells was quantified in the presence of mAb16. Each bar represents +/−SEM of triplicate experiments **p = 0.003. g Quantification of CIC in H1299 EV/H1299 175H co-cultures in the presence or absence of Y27632 or mAb16. Each bar represents +/−SEM of triplicate experiments *p = 0.01–0.04. h Quantification of total CIC structures per 20 hpf observed in A431 Ctr 273H/mCherry and KO 273H/GFP co-cultures treated with and without EGF for 24 h. Either red or green engulfing cells were quantified for KO 273H or ctr 273H respectively. Each bar represents +/−SEM of triplicate experiments Each bar represents +/−SEM of triplicate experiments *p = 0.03 or **p = 0.004. i Quantification of total CIC structures per 20 hpf observed in A431 Ctr 273H/mCherry and KO 273H/GFP co-cultured cells treated with and without Gefitinib (24 h). Either red or green engulfing cells were quantified for KO 273H or ctr 273H respectively Each bar represents +/−SEM of triplicate experiments **p = 0.0019. j Western blot showing pEGFR and EGFR following treatment of A431 control and p53 CRISPR KO cells, with and without Gefitinib and EGF. Actin was used as loading control
Fig. 3
Fig. 3
Mutant p53 status determines CIC outcomes. a Fluorescent time-lapse images illustrating the internal A431 cell outcomes. Arrows indicate the internal cell that is either escaping (top), dividing (middle) or dying (bottom). Scale bars = 50 μm. (also see Supplementary Movies 3–5) b Quantification of CIC outcomes for the internal cell, death or survival, based on the host cell p53 status. Each bar represents +/−SEM of three sets of 20 videos. c Fluorescent time-lapse images illustrating host cell outcomes in which arrows indicate activity of the host cell including normal division (top, please note that this is part of the same video as for 3ai), death (bottom) or aberrant division (right). Scale bars = 50 μm. Events indicated with arrows. (also see Supplementary Movies 3, 6 and 7) d Quantification of the host cell outcomes following engulfment. This includes normal cell division (left), death (middle) *p = 0.0111, **p = 0.0065 and aberrant division (right) *p = 0.0409, **p = 0.0295. Each bar represents +/−SEM of three sets of twenty videos. e, f Fluorescent and phase contrast time-lapse images of tripolar division events of a e CRISPR KO 273H host and f Ctr 253H mutant p53 host, both of which engulfed a CRISPR KO 273H internal cell. White arrows indicate daughter cells, blue arrow indicates where a daughter cell survives and subsequently divides. Scale bars = 50 μm. (please see Supplementary Fig. 2d on this figure with superimposed nuclei). These time lapses correspond to Supplementary Movies 8 and 9. g Non-fluorescent A431 mutant p53 cells were stained for tubulin and imaged in a Z-stack with confocal microscopy. Red arrows indicate an engulfed cell, white arrows indicate spindle formation. Scale bar = 20 μm. h Quantification of (left) tripolar mitoses as a percentage of total mitoses in Ctr 273H A431 or CRISPR KO A431 cells (error bar represents +/−SEM in ten sets of ten videos) and (right) tripolar mitoses of engulfing cells (error bar represents +/−SEM of seven sets of ten videos) as a percentage of total engulfing cells undergoing mitosis (n = 100). Error bars indicate SEM **p = 0.0089
Fig. 4
Fig. 4
Increased CIC activity in mutant p53 xenografts is pro-tumorigenic. a Example images of the CIC structures that were observed in H&E stained sections of mice xenograft tumours, following dissection and fixing. Scale bars = 50 μm. b Results of CIC quantification for xenograft tumours of four different H1299 co-cultures (as previously described in Fig. 1). Error bars indicate SD of three hpf of eight mice per group. c Dot plot representing corrected tumour growth (tumour size/number of days for the tumour to grow to its max size) for the same tumours and mice as in b. Error bars indicate SD of eight mice per group. *p < 0.05. d p53 stained xenograft sections from three different mice from group 2 (EV/mCherry with R273H/GFP co-cultures). As indicated with coloured rings, different combinations of CIC involving mutant (273H) and non-mutant (EV) cells were observed including 273H engulfing 273H (green), 273H engulfing EV (red), EV engulfing EV (blue), and EV engulfing 273H (yellow). Scale bars = 2.5 mm. e An example of a tripolar mitosis, which was often observed in H&E stained xenograft tumour sections. Scale bar = 100 μm. f Quantification of CIC structures in H&E stained slides from pancreatic tumours of Pdx1-Cre; LSL-KrasG12D/+; Trp53flox/+, and Pdx1-Cre; LSL-KrasG12D/+; LSL-Trp53R172H/+mice. g H&E stained sections from pancreatic tumours of Pdx1-Cre; LSL-KrasG12D/+; LSL-Trp53R172H/+ mice. Arrows indicate CIC and the scale bar = 50 μm
Fig. 5
Fig. 5
CIC structures in lung adenocarcinoma and correlation with p53 status. a H&E stained sections of lung adenocarcinoma containing examples of CIC structures, as indicated by arrows. Scale bars = 50 μm. b Correlation between CIC occurrence and mitoses n = 273 (Spearman’s ρ). c Correlation between CIC occurance and multinucleation n = 273 (Spearman’s ρ) (left). H&E stained sections showing multinucleation. Scale bars = 50 μm (right). d Correlations between tumour cell nuclear grade (membrane irregularity, nuclear size, and nucleolar size) and CIC. n = 273 (Spearman’s ρ). Error bars indicate SEM. e Pie charts illustrating the predominant histological growth patterns in cases where CIC is present or absent. High-risk invasive patterns are solid/micropapillary, medium risk patterns are acinar/papillary appearance, and predominantly in situ disease is relatively low-risk disease. f, g Kaplan–Meier plots comparing disease recurrence (f) and all-cause survival (g) in patients with tumours with and without CIC. Hazard ratios and p-values are obtained from univariate Cox models. h Example images of 1 mm cores of lung adenocarcinoma used to construct TMAs and perform p53 expression analysis. A p53 negative case (top panels) and p53 positive case (bottom panels) are shown. Scale bars = 500 μm. i Correlation between CIC and p53 mutation status (Wilcoxon rank-sum test p = 0.017) (n = 209). j CIC events plotted per % of cells expressing p53 to show heterogeneity in p53 protein overexpression (outliers omitted for clarity)
Fig. 6
Fig. 6
CIC correlates with replicative stress and measures of both genomic instability and sub clonal copy number loads in patients. a Z-stack images of non-fluorescent 273H mutant p53 A431 cells that were stained for pChk1 using immune fluorescence,and imaged with confocal microscopy. Scale bars = 20 μm. b Quantification of total CIC structures observed in A431 Ctr 273H/mCherry and KO 273H/GFP co-cultures with and without TCS2312 treatment for 24 h. Each bar represents +/−SEM of triplicate experiments ****p < 0.0001. c Association between p53 mutations and CIC using the first 100 patients used in the TRACERx study. df Associations between CIC and indicators of genomic instability in all the first 100 lung cancer patient tumours of the TRACERx study (ALL) and or lung adenocarcinoma tumours (LUAD) specifically (n = 61). d Association between CIC and weighted genome integrity index (wGII) for ALL (left) and LUAD (right). e Association between CIC and genomic alterations using sub clonal copy number loads in NSCLC for ALL (left) and LUAD (right). f Association between CIC and genomic alterations using percent sub clonal copy number loads in NSCLC for ALL (left) and LUAD (right). Statistical analysis was Spearman’s rank correlation, with rho and p values indicated on the graphs
Fig. 7
Fig. 7
Schematic model of the consequences of cell engulfment in mutant p53 and p53 null cells. In p53 null cells, engulfment followed by a failed cell division, multinucleation, and subsequent cell division most often leads to cell death. Mutant p53 cells that divide following engulfment, failed division, and multinucleation experience aberrant mitoses, leading to the generation of three daughter cells via tripolar mitoses and further multinucleation

References

    1. Overholtzer M, Brugge JS. The cell biology of cell-in-cell structures. Nat. Rev. Mol. Cell Biol. 2008;9:796–809. doi: 10.1038/nrm2504. - DOI - PubMed
    1. Eberth DCJ. Über den feineren Bau der Darmschleimhaut. (In German) Würzburg: Stahel’sche Buch- und Kunsthandlung; 1864.
    1. Overholtzer M, et al. A nonapoptotic cell death process, entosis, that occurs by cell-in-cell invasion. Cell. 2007;131:966–979. doi: 10.1016/j.cell.2007.10.040. - DOI - PubMed
    1. Sharma N, Dey P. Cell cannibalism and cancer. Diagn. Cytopathol. 2011;39:229–233. - PubMed
    1. Rastogi V, Sharma R, Misra SR, Yadav L, Sharma V. Emperipolesis—a review. J. Clin. Diagn. Res.: JCDR. 2014;8:Zm01-02. - PMC - PubMed

Publication types

MeSH terms

Substances