. 2018 Aug 3;8(1):11679.
doi: 10.1038/s41598-018-30118-0.

Fitting mathematical models of biochemical pathways to steady state perturbation response data without simulating perturbation experiments

Affiliations

Fitting mathematical models of biochemical pathways to steady state perturbation response data without simulating perturbation experiments

Tapesh Santra. Sci Rep. .

Abstract

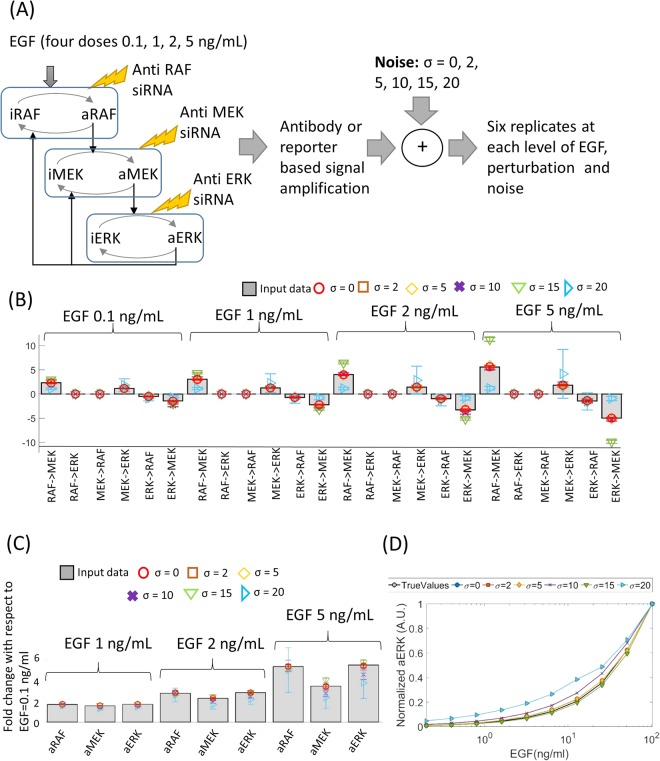
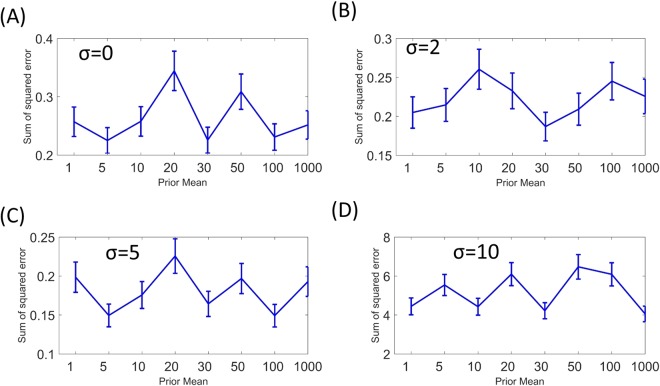
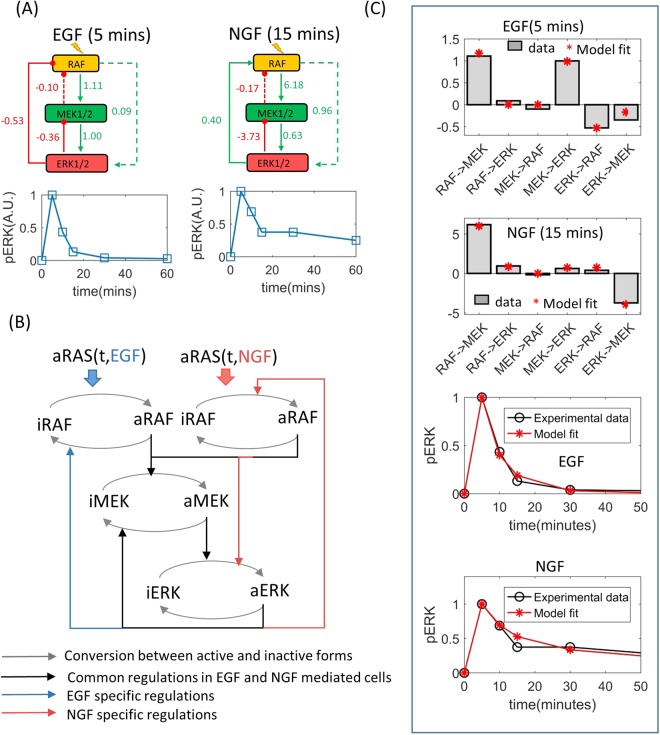
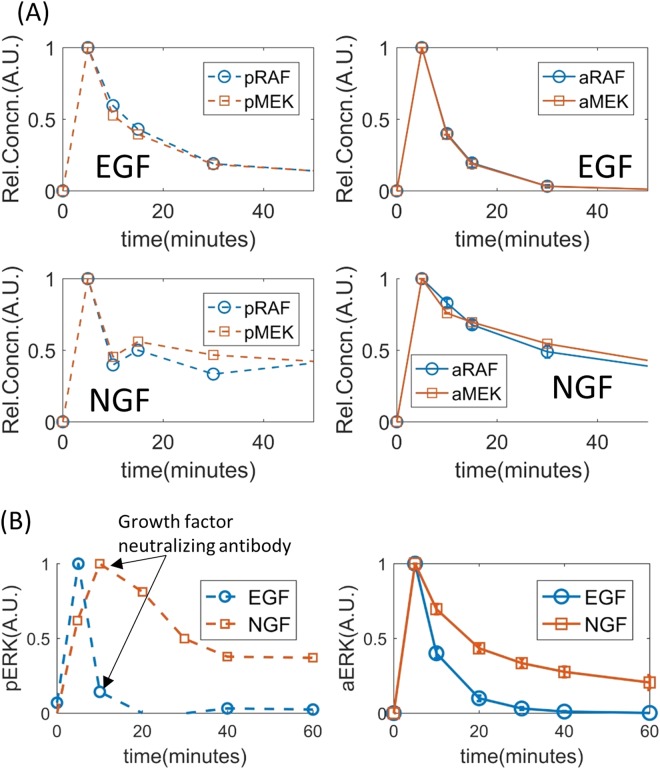
Fitting Ordinary Differential Equation (ODE) models of signal transduction networks (STNs) to experimental data is a challenging problem. Computational parameter fitting algorithms simulate a model many times with different sets of parameter values until the simulated STN behaviour match closely with experimental data. This process can be slow when the model is fitted to measurements of STN responses to numerous perturbations, since this requires simulating the model as many times as the number of perturbations for each set of parameter values. Here, I propose an approach that avoids simulating perturbation experiments when fitting ODE models to steady state perturbation response (SSPR) data. Instead of fitting the model directly to SSPR data, it finds model parameters which provides a close match between the scaled Jacobian matrices (SJM) of the model, which are numerically calculated using the model's rate equations and estimated from SSPR data using modular response analysis (MRA). The numerical estimation of SJM of an ODE model does not require simulating perturbation experiments, saving significant computation time. The effectiveness of this approach is demonstrated by fitting ODE models of the Mitogen Activated Protein Kinase (MAPK) pathway using simulated and real SSPR data.


Conflict of interest statement

The author declares no competing interests.

Figures

Figure 1
Figure 1
Parameter calibration using local response coefficients calculated from simulated data. (A) Schematic diagram of the MAPK model that was used to simulate perturbation response data, along with an outline of the data generation process. (B,C) Local response coefficients and steady state levels of aRAF, aMEK and aERK, simulated with the original (grey bars) and inferred parameters (coloured markers). Parameters were inferred from data contaminated with different levels (σ = 0, 2, 5, 10, 15, 20) of noise. The steady state levels of aRAF, aMEK and aERK at EGF levels 1,2,5 ng/mL are shown in terms of fold-change with respect to the same at EGF = 0.1 ng/mL. (D) aERK levels following stimulation by different doses of EGFs.
Figure 2
Figure 2
Effects of hyper-parameters on model fitting error. X-axis represents hyper-parameter values, Y-axis represent sum of square error between original and predicted LRCs and SSFCs. Error bars represent standanrd-deviations. Panels (A–D) show the effect of hyper-parameter choice on the ABPIPRD algorithm at different levels of measurement noise (σ = 0, 2, 5, 10 respectively).
Figure 3
Figure 3
Fitting an ODE model of the MAPK pathway to experimental data. (A) LRCs of the ERK pathway and time-dependent relative pERK concentrations in EGF and NGF stimulated PC12 cells. (B) Schematic diagram of the ODE model that was fitted to the data presented in (A). (C) LRCs and time dependent pERK concentrations calculated using the fitted models. LRCs calculated from experimental data and experimentally observed pERK kinetics are also shown in this panel for comparison. Model fits represent average of an ensemble of one thousand models fitted to 1000 sets of parameters sampled by the variable weight ABC-SMC algorithm. Error bars represent standard error. Error bars are not visible due to having negligible standard error.
Figure 4
Figure 4
Simulating temporal concentrations of pRAF and pMEK using the fitted models. (A) Time dependent relative concentrations of pRAF and pMEK in response to EGF (top two sub-panels) and NGF (bottom two subpanels). Experimental data are shown in the left sub-panels and the model simulations are shown in the right sub-panels. (B) Temporal response of pERK to the application of growth factor neutralizing antibody at 10 minutes. The left and right sub-panels show experimental data and model simulation respectively. Model simulations represent average of an ensemble of one thousand models fitted to different sets of parameters sampled by the variable weight ABC-SMC algorithm. Error bars represent standard error.
Figure 5
Figure 5
pERK concentrations at different doses of growth factors. (A) Simulated (shown in red) and experimentally measured (shown in black) relative pERK concentrations following five minutes of EGF and NGF treatments. A.U. means arbitrary units. The dashed lines represent 67% confidence interval. An ensemble of one thousand models fitted to different sets of parameters sampled by the VW-ABC-SMC algorithm were used to calculate mean response (solid red lines in panel A) and confidence intervals (dashed red lines in panel A). Bimodal distribution of steady-state (60 minutes after NGF stimulation) pERK levels following treatment by different doses of NGF. For each level of NGF, pERK levels were simulated using an ensemble of a thousand models. The empirical distributions (the blue lines in panel (B) of the simulated pERK levels are shown in blow. Individual Gaussian components that make up the empirical distributions are shown in red and green. The peak of the individual components are marked using dots of the respective colour.

References

    1. Aldridge BB, Burke JM, Lauffenburger DA, Sorger PK. Physicochemical modelling of cell signalling pathways. Nat Cell Biol. 2006;8:1195–1203. doi: 10.1038/ncb1497. - DOI - PubMed
    1. Halasz M, Kholodenko BN, Kolch W, Santra T. Integrating network reconstruction with mechanistic modeling to predict cancer therapies. Sci. Signal. 2016;9:ra114–ra114. doi: 10.1126/scisignal.aae0535. - DOI - PubMed
    1. Degasperi A, Fey D, Kholodenko BN. Performance of objective functions and optimisation procedures for parameter estimation in system biology models. npj Systems Biology and Applications. 2017;3:20. doi: 10.1038/s41540-017-0023-2. - DOI - PMC - PubMed
    1. Girolami M, Calderhead B, Girolami M, Calderhead B. Riemann manifold Langevin and Hamiltonian Monte Carlo methods. Journal of the Royal Statistical Society Series B-Statistical Methodology. 2011;73:123–214. doi: 10.1111/j.1467-9868.2010.00765.x. - DOI
    1. Jensch A, Thomaseth C, Radde NE. Sampling-based Bayesian approaches reveal the importance of quasi-bistable behavior in cellular decision processes on the example of the MAPK signaling pathway in PC-12 cell lines. BMC Systems Biology. 2017;11:11. doi: 10.1186/s12918-017-0392-6. - DOI - PMC - PubMed

Publication types

LinkOut - more resources