

STAT3 activation confers trastuzumab-emtansine (T-DM1) resistance in HER2-positive breast cancer
- PMID: 30076657
- PMCID: PMC6172075
- DOI: 10.1111/cas.13761
STAT3 activation confers trastuzumab-emtansine (T-DM1) resistance in HER2-positive breast cancer
Abstract
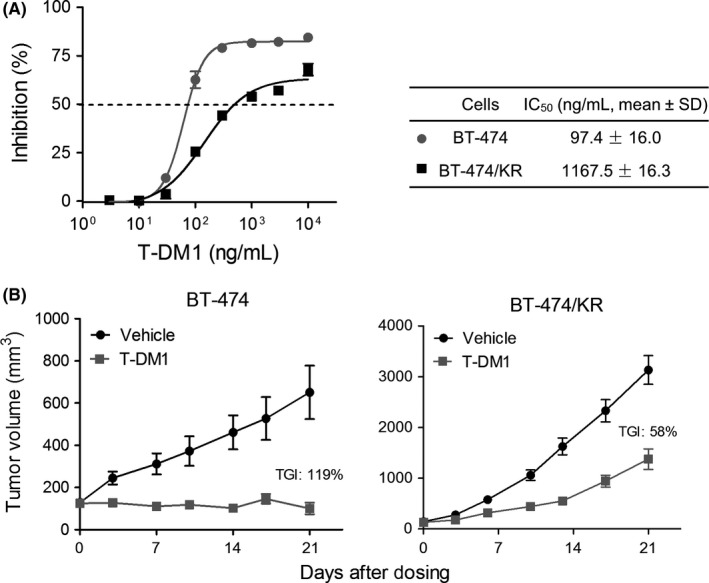
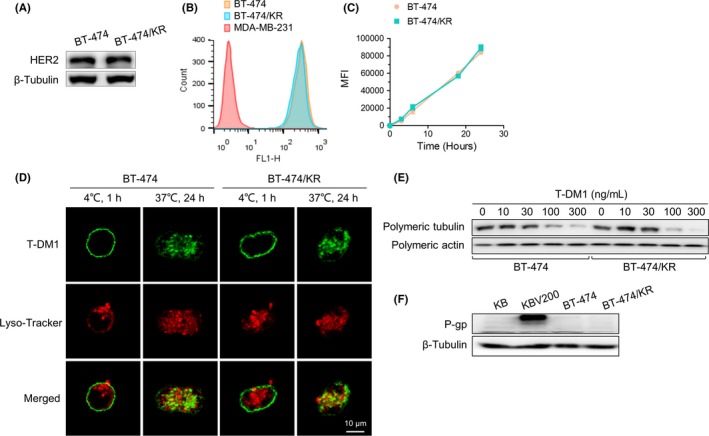
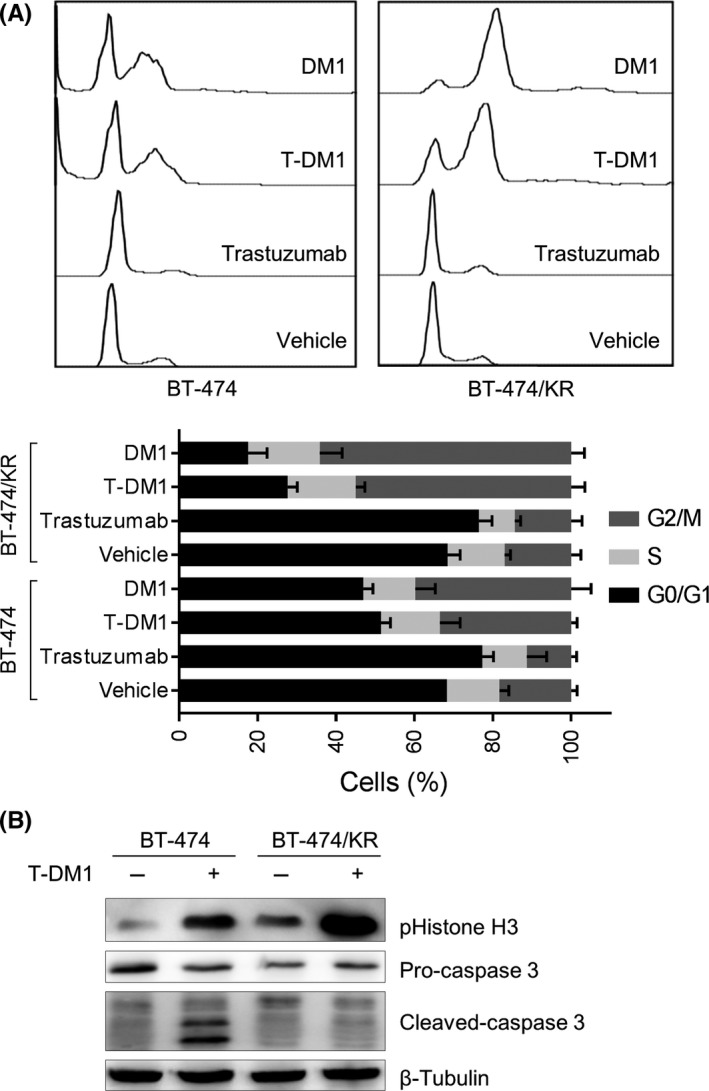
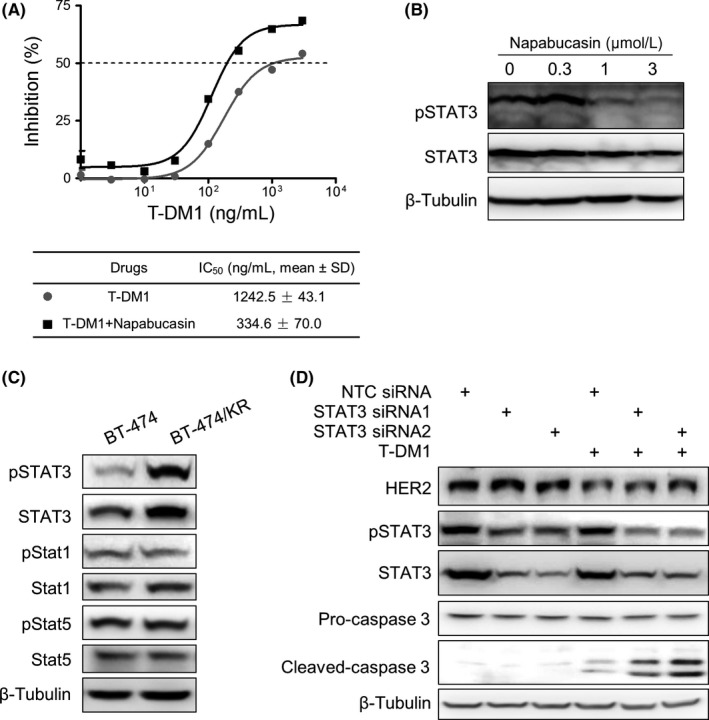
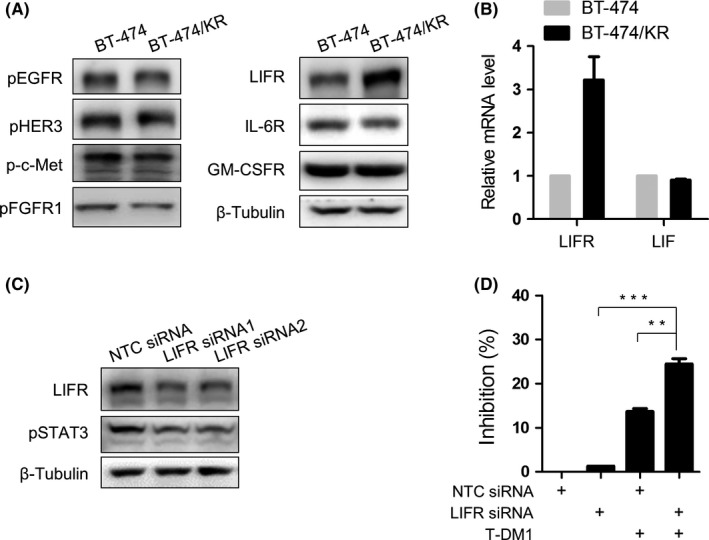
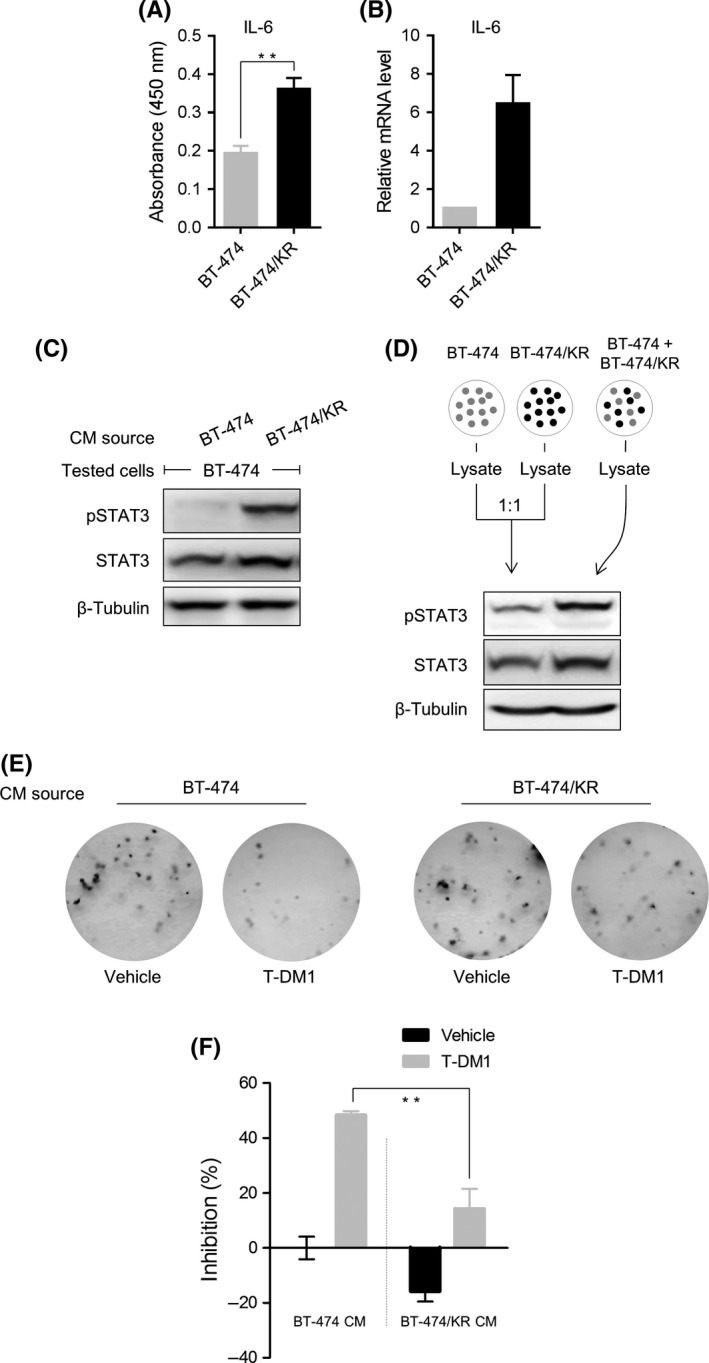
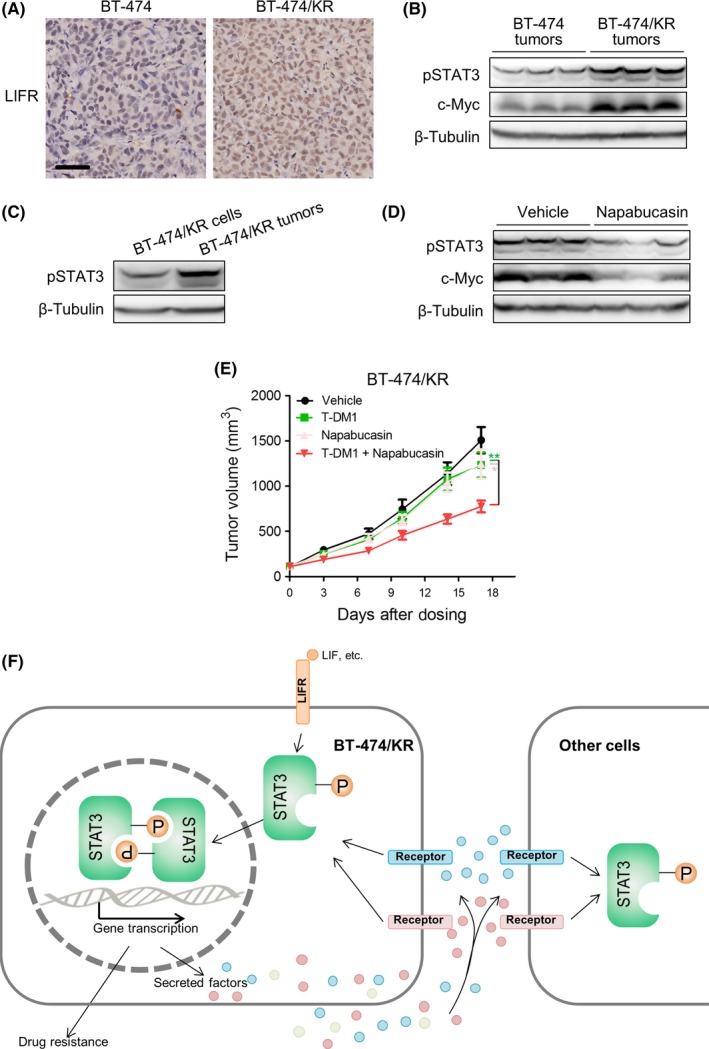
Trastuzumab-emtansine (T-DM1) is an antibody-drug conjugate that has been approved for the treatment of human epidermal growth factor receptor 2 (HER2)-positive metastatic breast cancer. Despite the remarkable efficacy of T-DM1 in many patients, resistance to this therapeutic has emerged as a significant clinical problem. In the current study, we used BT-474/KR cells, a T-DM1-resistant cell line established from HER2-positive BT-474 breast cancer cells, as a model to investigate mechanisms of T-DM1 resistance and explore effective therapeutic regimens. We show here for the first time that activation of signal transducer and activator of transcription 3 (STAT3) mediated by leukemia inhibitory factor receptor (LIFR) overexpression confers resistance to T-DM1. Moreover, secreted factors induced by activated STAT3 in resistant cells limit the responsiveness of cells that were originally sensitive to T-DM1. Importantly, STAT3 inhibition sensitizes resistant cells to T-DM1, both in vitro and in vivo, suggesting that the combination T-DM1 with STAT3-targeted therapy is a potential treatment for T-DM1-refractory patients.
Keywords: STAT3; drug resistance; leukemia inhibitory factor receptor; secreted factor; trastuzumab-emtansine.
© 2018 The Authors. Cancer Science published by John Wiley & Sons Australia, Ltd on behalf of Japanese Cancer Association.
Figures
Similar articles
-
Combination efficacy of pertuzumab and trastuzumab for trastuzumab emtansine-resistant cells exhibiting attenuated lysosomal trafficking or efflux pumps upregulation.Cancer Chemother Pharmacol. 2020 Nov;86(5):641-654. doi: 10.1007/s00280-020-04138-5. Epub 2020 Sep 30. Cancer Chemother Pharmacol. 2020. PMID: 32997196 Free PMC article.
-
Aberrant intracellular metabolism of T-DM1 confers T-DM1 resistance in human epidermal growth factor receptor 2-positive gastric cancer cells.Cancer Sci. 2017 Jul;108(7):1458-1468. doi: 10.1111/cas.13253. Epub 2017 May 23. Cancer Sci. 2017. PMID: 28388007 Free PMC article.
-
Targeting PLK1 overcomes T-DM1 resistance via CDK1-dependent phosphorylation and inactivation of Bcl-2/xL in HER2-positive breast cancer.Oncogene. 2018 Apr;37(17):2251-2269. doi: 10.1038/s41388-017-0108-9. Epub 2018 Feb 2. Oncogene. 2018. PMID: 29391599
-
Trastuzumab emtansine: mechanisms of action and drug resistance.Breast Cancer Res. 2014 Mar 5;16(2):209. doi: 10.1186/bcr3621. Breast Cancer Res. 2014. PMID: 24887180 Free PMC article. Review.
-
Ado-trastuzumab emtansine (T-DM1): a novel antibody-drug conjugate for the treatment of HER2-positive metastatic breast cancer.J Oncol Pharm Pract. 2015 Apr;21(2):132-42. doi: 10.1177/1078155214527144. Epub 2014 Mar 27. J Oncol Pharm Pract. 2015. PMID: 24682654 Review.
Cited by
-
Advances in the study of marketed antibody-drug Conjugates (ADCs) for the treatment of breast cancer.Front Pharmacol. 2024 Jan 30;14:1332539. doi: 10.3389/fphar.2023.1332539. eCollection 2023. Front Pharmacol. 2024. PMID: 38352694 Free PMC article. Review.
-
Pharmacological characterization of TQ05310, a potent inhibitor of isocitrate dehydrogenase 2 R140Q and R172K mutants.Cancer Sci. 2019 Oct;110(10):3306-3314. doi: 10.1111/cas.14152. Epub 2019 Aug 20. Cancer Sci. 2019. PMID: 31361380 Free PMC article.
-
STAT family of transcription factors in breast cancer: Pathogenesis and therapeutic opportunities and challenges.Semin Cancer Biol. 2022 Nov;86(Pt 3):84-106. doi: 10.1016/j.semcancer.2022.08.003. Epub 2022 Aug 19. Semin Cancer Biol. 2022. PMID: 35995341 Free PMC article. Review.
-
The next frontier in antibody-drug conjugates: challenges and opportunities in cancer and autoimmune therapy.Cancer Drug Resist. 2025 Jul 3;8:34. doi: 10.20517/cdr.2025.49. eCollection 2025. Cancer Drug Resist. 2025. PMID: 40843358 Free PMC article. Review.
-
STAT signaling as a target for intervention: from cancer inflammation and angiogenesis to non-coding RNAs modulation.Mol Biol Rep. 2022 Sep;49(9):8987-8999. doi: 10.1007/s11033-022-07399-w. Epub 2022 Apr 26. Mol Biol Rep. 2022. PMID: 35474053 Review.
References
-
- Ferlay J, Shin HR, Bray F, Forman D, Mathers C, Parkin DM. Estimates of worldwide burden of cancer in 2008: GLOBOCAN 2008. Int J Cancer. 2010;127:2893‐2917. - PubMed
-
- Ponde N, Brandao M, El‐Hachem G, Werbrouck E, Piccart M. Treatment of advanced HER2‐positive breast cancer: 2018 and beyond. Cancer Treat Rev. 2018;67:10‐20. - PubMed
-
- Ryan Q, Ibrahim A, Cohen MH, et al. FDA drug approval summary: lapatinib in combination with capecitabine for previously treated metastatic breast cancer that overexpresses HER‐2. Oncologist. 2008;13:1114‐1119. - PubMed
-
- Fornier M, Esteva FJ, Seidman AD. Trastuzumab in combination with chemotherapy for the treatment of metastatic breast cancer. Semin Oncol. 2000;27:38‐45; discussion 92‐100. - PubMed
-
- Madrid‐Paredes A, Canadas‐Garre M, Sanchez‐Pozo A, Calleja‐Hernandez MA. Non‐HER2 signaling pathways activated in resistance to anti‐HER2 therapy in breast cancer. Breast Cancer Res Treat. 2015;153:493‐505. - PubMed
MeSH terms
Substances
Grants and funding
LinkOut - more resources
Full Text Sources
Other Literature Sources
Medical
Research Materials
Miscellaneous
