

Degeneration of white matter and gray matter revealed by diffusion tensor imaging and pathological mechanism after spinal cord injury in canine
- PMID: 30076687
- PMCID: PMC6488901
- DOI: 10.1111/cns.13044
Degeneration of white matter and gray matter revealed by diffusion tensor imaging and pathological mechanism after spinal cord injury in canine
Abstract
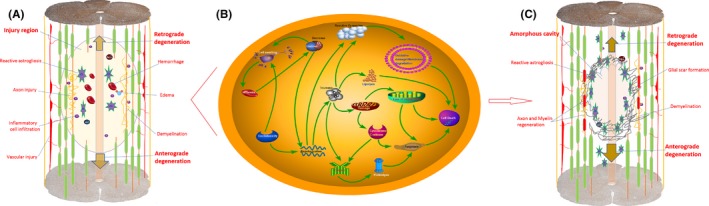
Aim: Exploration of the mechanism of spinal cord degeneration may be the key to treatment of spinal cord injury (SCI). This study aimed to investigate the degeneration of white matter and gray matter and pathological mechanism in canine after SCI.
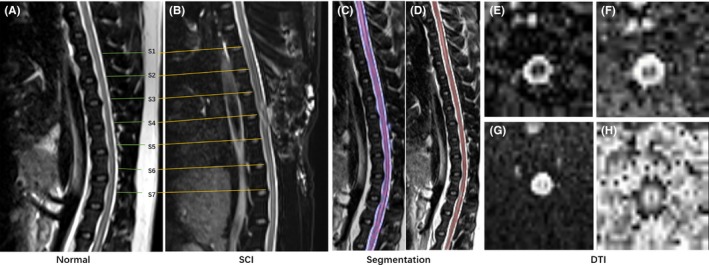
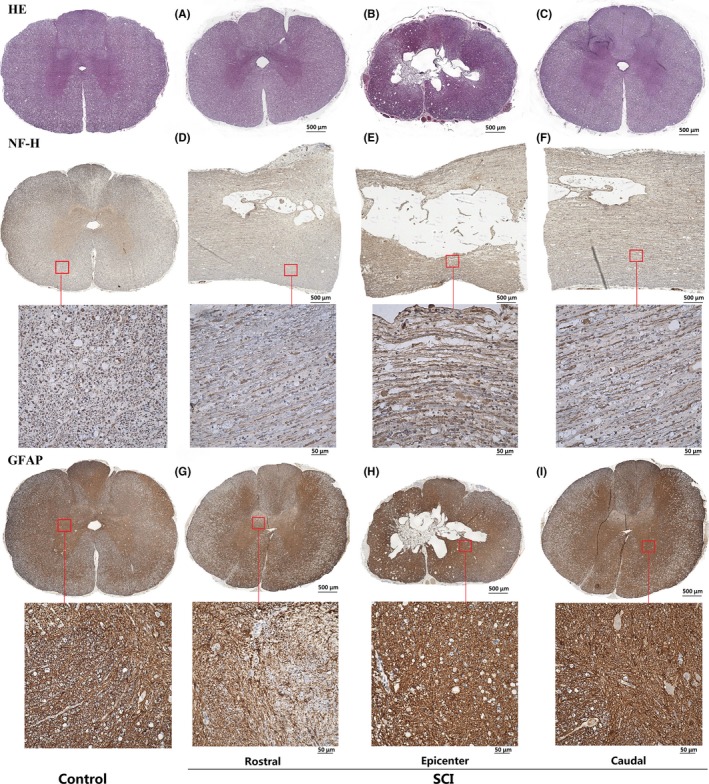
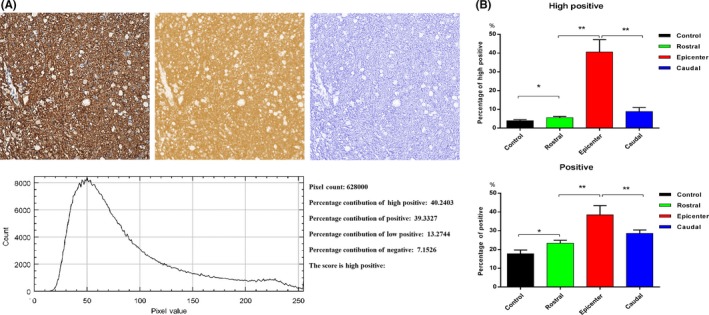
Methods: Diffusion tensor imaging (DTI) was performed on canine models with normal (n = 5) and injured (n = 7) spinal cords using a 3.0T MRI scanner at precontusion and 3 hours, 24 hours, 6 weeks, and 12 weeks postcontusion. The tissue sections were stained using H&E and immunohistochemistry.
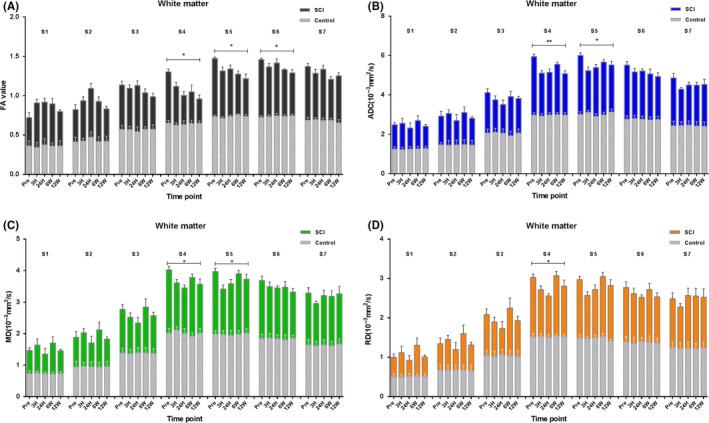
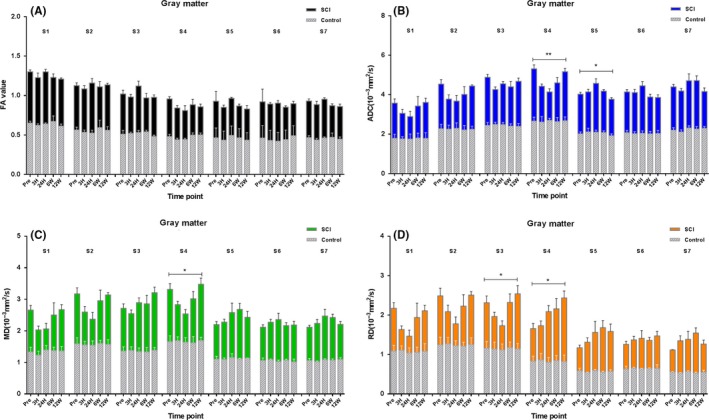
Results: For white matter, fractional anisotropy (FA) values significantly decreased in lesion epicenter, caudal segment 1 cm away from epicenter, and caudal segment 2 cm away from epicenter (P = 0.003, P = 0.004, and P = 0.013, respectively) after SCI. Apparent diffusion coefficient (ADC) values were initially decreased and then increased in lesion epicenter and caudal segment 1 cm away from epicenter (P < 0.001 and P = 0.010, respectively). There are no significant changes in FA and ADC values in rostral segments (P > 0.05). For gray matter, ADC values decreased initially and then increased in lesion epicenter (P < 0.001), and overall trend decreased in caudal segment 1 cm away from epicenter (P = 0.039). FA values did not change significantly (P > 0.05). Pathological examination confirmed the dynamic changes of DTI parameters.
Conclusion: Diffusion tensor imaging is more sensitive to degeneration of white matter than gray matter, and the white matter degeneration may be not symmetrical which meant the caudal degradation appeared to be more severe than the rostral one.
Keywords: canine model; diffusion tensor imaging; gray matter; pathological degeneration; spinal cord injury; white matter.
© 2018 John Wiley & Sons Ltd.
Conflict of interest statement
The authors declare no conflict of interest.
Figures
Similar articles
-
Diffusion tensor imaging of spinal cord parenchyma lesion in rat with chronic spinal cord injury.Magn Reson Imaging. 2018 Apr;47:25-32. doi: 10.1016/j.mri.2017.11.009. Epub 2017 Nov 14. Magn Reson Imaging. 2018. PMID: 29154896
-
Dynamic diffusion tensor imaging of spinal cord contusion: A canine model.J Neurosci Res. 2018 Jun;96(6):1093-1103. doi: 10.1002/jnr.24222. Epub 2018 Feb 27. J Neurosci Res. 2018. PMID: 29485189
-
Longitudinal study on diffusion tensor imaging and diffusion tensor tractography following spinal cord contusion injury in rats.Neuroradiology. 2016 Jun;58(6):607-614. doi: 10.1007/s00234-016-1660-7. Epub 2016 Mar 1. Neuroradiology. 2016. PMID: 26931783
-
The role of diffusion tensor imaging in the diagnosis, prognosis, and assessment of recovery and treatment of spinal cord injury: a systematic review.Neurosurg Focus. 2019 Mar 1;46(3):E7. doi: 10.3171/2019.1.FOCUS18591. Neurosurg Focus. 2019. PMID: 30835681
-
Diffusion Tensor Imaging in Acute Spinal Cord Injury: A Review of Animal and Human Studies.J Neurotrauma. 2019 Aug 1;36(15):2279-2286. doi: 10.1089/neu.2019.6379. Epub 2019 May 6. J Neurotrauma. 2019. PMID: 30950317 Review.
Cited by
-
Effect of b Value on Imaging Quality for Diffusion Tensor Imaging of the Spinal Cord at Ultrahigh Field Strength.Biomed Res Int. 2021 Jan 6;2021:4836804. doi: 10.1155/2021/4836804. eCollection 2021. Biomed Res Int. 2021. PMID: 33506018 Free PMC article.
-
Role of dendritic cells in spinal cord injury.CNS Neurosci Ther. 2024 Mar;30(3):e14593. doi: 10.1111/cns.14593. CNS Neurosci Ther. 2024. PMID: 38528832 Free PMC article. Review.
-
Human Umbilical Cord Mesenchymal Stem Cells Attenuate Ocular Hypertension-Induced Retinal Neuroinflammation via Toll-Like Receptor 4 Pathway.Stem Cells Int. 2019 Oct 15;2019:9274585. doi: 10.1155/2019/9274585. eCollection 2019. Stem Cells Int. 2019. PMID: 31737079 Free PMC article.
-
VDAC1 in the diseased myocardium and the effect of VDAC1-interacting compound on atrial fibrosis induced by hyperaldosteronism.Sci Rep. 2020 Dec 16;10(1):22101. doi: 10.1038/s41598-020-79056-w. Sci Rep. 2020. PMID: 33328613 Free PMC article.
-
Silencing VDAC1 to Treat Mesothelioma Cancer: Tumor Reprograming and Altering Tumor Hallmarks.Biomolecules. 2022 Jun 27;12(7):895. doi: 10.3390/biom12070895. Biomolecules. 2022. PMID: 35883451 Free PMC article.
References
-
- Farhadi HF, Kukreja S, Minnema AJ, et al. Impact of admission imaging findings on neurological outcomes in acute cervical traumatic spinal cord injury. J Neurotrauma. 2018;35(12):1398‐1406. - PubMed
-
- Hu AM, Li JJ, Sun W, et al. Myelotomy reduces spinal cord edema and inhibits aquaporin‐4 and aquaporin‐9 expression in rats with spinal cord injury. Spinal Cord. 2015;53:98‐102. - PubMed
-
- Hu R, Zhou J, Luo C, et al. Glial scar and neuroregeneration: histological, functional, and magnetic resonance imaging analysis in chronic spinal cord injury. J Neurosurg Spine. 2010;13:169‐180. - PubMed
-
- Cohen‐Adad J, Leblond H, Delivet‐Mongrain H, et al. Wallerian degeneration after spinal cord lesions in cats detected with diffusion tensor imaging. Neuroimage. 2011;57:1068‐1076. - PubMed
Publication types
MeSH terms
LinkOut - more resources
Full Text Sources
Other Literature Sources
Medical
Molecular Biology Databases
