. 2018 Aug 8;99(3):511-524.e5.
doi: 10.1016/j.neuron.2018.07.004. Epub 2018 Aug 1.

Homeostatic Control of Spontaneous Activity in the Developing Auditory System

Affiliations

Homeostatic Control of Spontaneous Activity in the Developing Auditory System

Travis A Babola et al. Neuron. .

Abstract

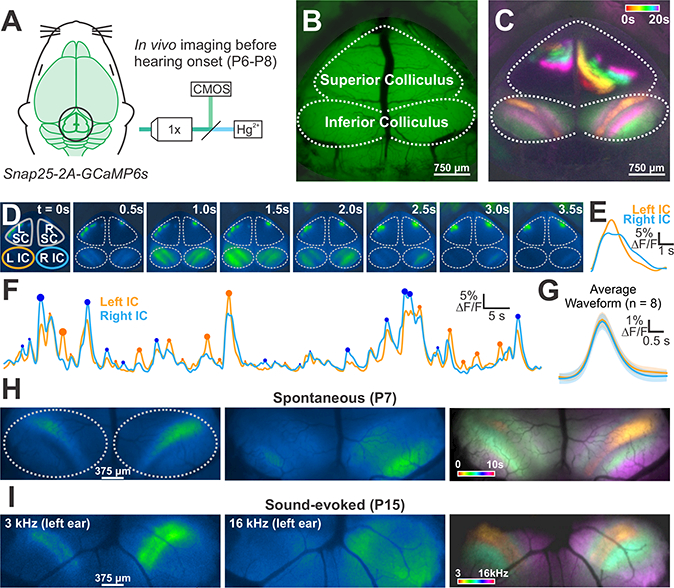
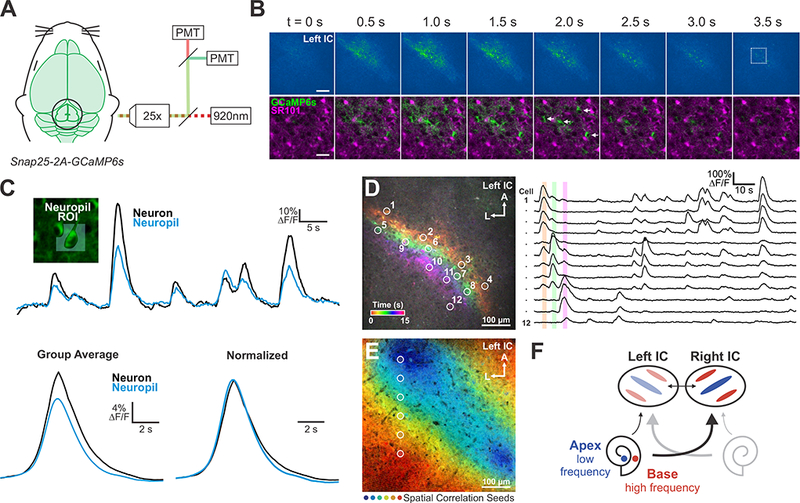
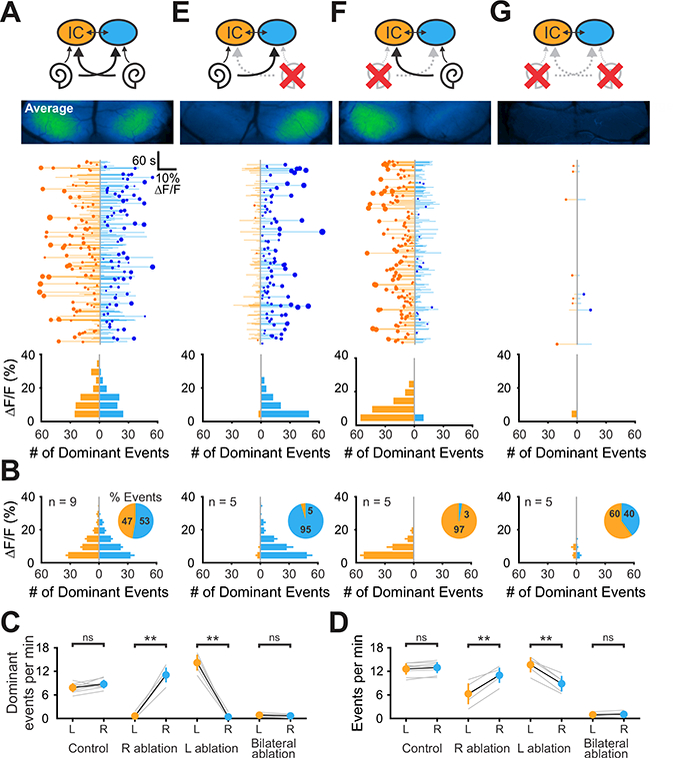
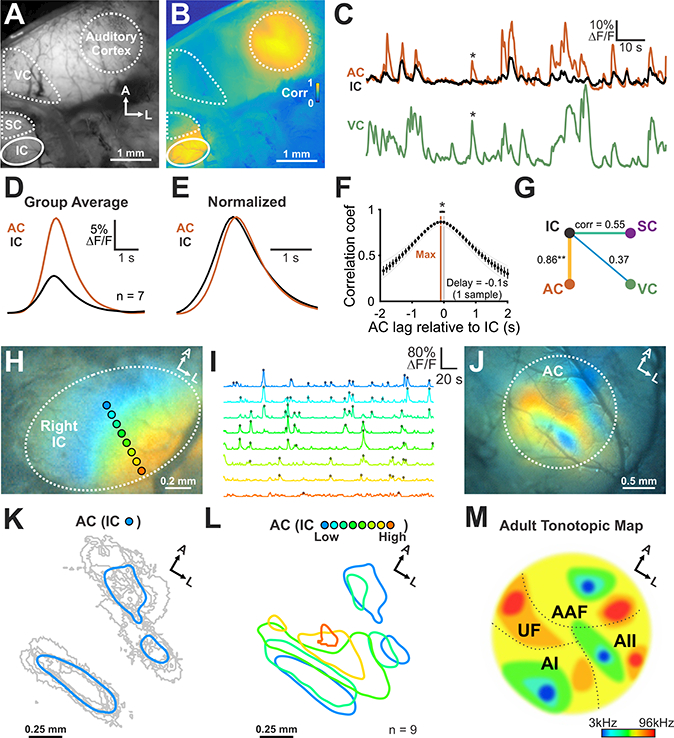
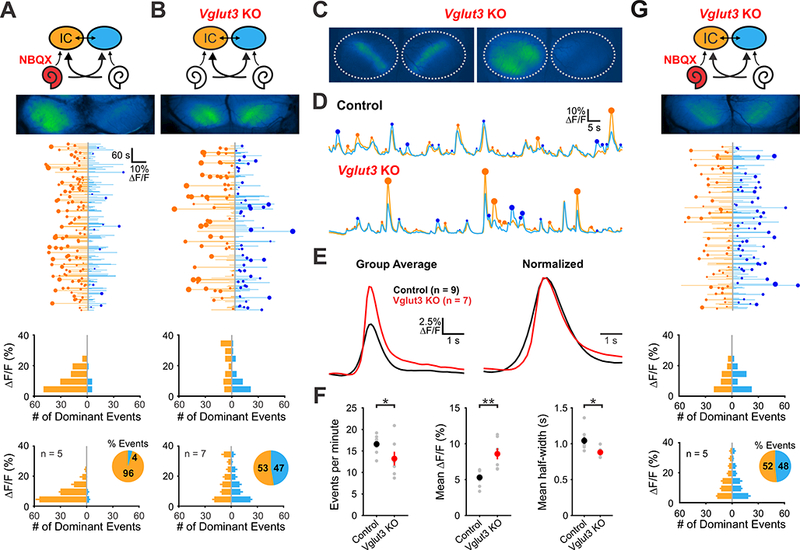
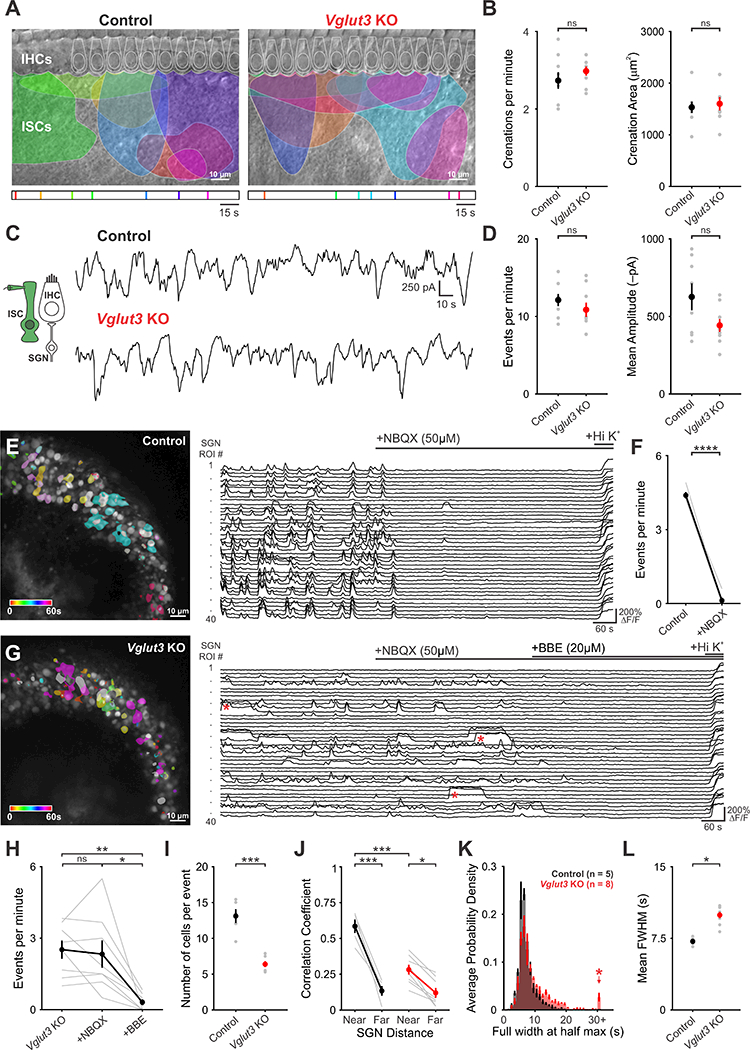
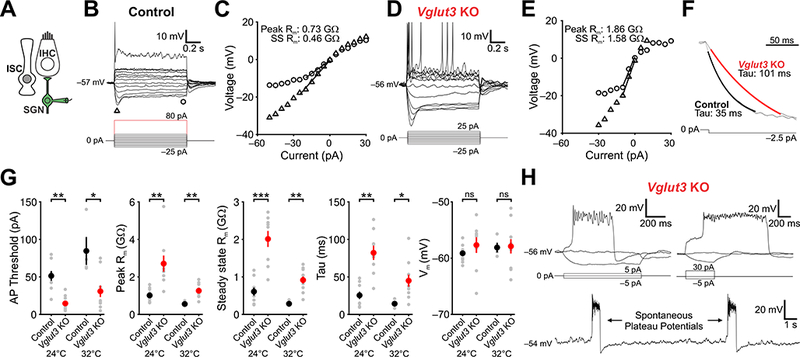
Neurons in the developing auditory system exhibit spontaneous bursts of activity before hearing onset. How this intrinsically generated activity influences development remains uncertain, because few mechanistic studies have been performed in vivo. We show using macroscopic calcium imaging in unanesthetized mice that neurons responsible for processing similar frequencies of sound exhibit highly synchronized activity throughout the auditory system during this critical phase of development. Spontaneous activity normally requires synaptic excitation of spiral ganglion neurons (SGNs). Unexpectedly, tonotopic spontaneous activity was preserved in a mouse model of deafness in which glutamate release from hair cells is abolished. SGNs in these mice exhibited enhanced excitability, enabling direct neuronal excitation by supporting cell-induced potassium transients. These results indicate that homeostatic mechanisms maintain spontaneous activity in the pre-hearing period, with significant implications for both circuit development and therapeutic approaches aimed at treating congenital forms of deafness arising through mutations in key sensory transduction components.


Conflict of interest statement

DECLARATION OF INTERESTS

The authors declare no competing financial interests.

Figures

Figure 1.
Figure 1.. Imaging spontaneous neural activity in awake neonatal mice.
(A) Spontaneous neural activity monitored in unanesthetized mouse pups (Snap25-T2A-GCaMP6s; P6-P8) with wide field epifluorescence. (B) Imaging field-of-view that includes the superior (visual) and inferior (auditory) colliculi (IC). (C) Calcium transients in the midbrain color-coded based on time of occurrence. (D) Time series of a discrete event in the IC. (E) Fluorescence trace from time series in (D) of left (orange) and right (blue) IC. (F) Fluorescence intensity over time for the two lobes of the IC. Circles highlight events that exhibit higher fluorescence compared to the contralateral lobe, and the size of the circle indicates the magnitude of difference between the two sides. (G) Average waveform of all transients in left and right IC. Shaded area is S.E.M, n = 8 animals. (H) Images of two spontaneous events before hearing onset. Image at right shows the spatial segregation of discrete events (color-coded based on time of occurrence), which were distributed throughout the IC. (I) Tone-evoked neuronal calcium transients in P12 Snap25-T2A-GCaMP6s mice (after hearing onset). Image at right shows the tonotopic segregation of discrete events (color-coded based on sound frequency).
Figure 2.
Figure 2.. Spontaneous activity occurs in neurons and neuropil.
(A) Spontaneous neural activity monitored in unanesthetized mouse pups (P6-P8) using two-photon microscopy. (B) Top: Time series of a representative spontaneous event recorded 150 μm below the pial surface. Scale bar = 100 μm. Bottom: Time series from box in top panel. SR101 was used to label astrocytes. Arrows indicate neuronal cell bodies. Scale bar = 25 μm. (C) Fluorescence transients seen in neurons and adjacent neuropil (see Methods for details). Bottom: Group average of detected events. Fluorescence is normalized as ΔF/Fo, where Fo is defined as the bottom 5th percentile of fluorescence values. (D) Transients in the IC color-coded by time of occurrence. Right: Fluorescence traces from ROIs around individual neurons indicated on left. (E) Spatial correlation map generated from seeds across the tonotopic axis; high spatial and temporal correlation indicated by color (see Methods for details). (F) Model to explain how local activation of IHCs in the cochlea induces spatially restricted bands of neuronal activity in the IC.
Figure 3.
Figure 3.. Spontaneous activity in the inferior colliculus originates in the cochlea.
(A) Top: Diagram illustrating flow of information through the auditory system and average intensity image over the 10-minute imaging session. Middle: Graph showing activity over time in left (orange) and right (blue) IC, where each line indicates the amplitude of the fluorescence change, the circle indicates the side which had the greatest intensity and the size of the circle indicates the difference in fluorescence. Bottom: Histogram showing the number of dominant events of different amplitudes. (B) Average histogram of events across the group. Inset: pie graphs indicating the relative percentage of dominant events for each lobe. (C) Graph of frequency of dominant activity in the left and right lobe of the IC across conditions. Gray lines indicate individual examples, black is the mean ± S.E.M. (n indicated in (B); two-tailed paired t-test, ns: not significant, **: P < 0.005). (D) Graph of frequency of all activity in the left and right lobe of the IC across conditions. (n indicated in (B); two-tailed paired t-test, ns: not significant, **: P < 0.005). (E - G) Similar to A, but for ablations of right, left, and both cochleae.
Figure 4.
Figure 4.. Auditory cortex receives tonotopically-organized information from inferior colliculus.
(A) Spontaneous neural activity across midbrain and cortex using wide field epifluorescence. (B) Correlation map generated by performing a pixel-by-pixel correlation against signals from the IC (see Methods for details). (C) Fluorescence transients seen in auditory cortex (AC), IC, and primary visual cortex (VC). Asterisk highlights cortical activity that was not correlated with IC activity. (D) Average transient from IC and AC (n = 7 animals). (E) Amplitude normalized transient from IC and AC (n = 7 animals). (F) Cross-correlogram of signals in IC and AC. n = 7 animals (two-tailed paired Student’s t-test, *: P < 0.05). (G) Diagram displaying the average correlation coefficient between brain regions. (n = 7 animals; one-way ANOVA, Tukey’s post-hoc, ** P < 0.005 for IC-AC versus all other correlations). (H) Illustration of ROIs aligned to the future tonotopic axis of the IC. Colors in image indicate high correlations with the ROIs indicated. (I) Normalized signals from ROIs indicated in (H). Detected peaks are indicated with filled circles. (J) AC spatial activity map generated using activity from distinct zones within the IC. Concurrent activity in the IC and AC was averaged based on location of the peak within the IC. Each color corresponds to the ROIs indicated in (H). (K) Individual (gray) and average area (blue) in the AC that exhibited correlated activity with future low frequency areas of the IC. Areas were defined by thresholding average response by 80% of maximum fluorescence. (L) Group average spatial map in the AC generated from events within distinct, future tonotopic zones of the IC. Note that high frequency regions of the IC are underrepresented, due to the limited visualization of these deeper regions using wide field epifluorescence imaging. (M) Schematic of AC organization in the adult mouse. AI: primary AC, AII: secondary AC, AAF: anterior auditory field, UF: ultrasonic field.
Figure 5.
Figure 5.. Spontaneous activity persists in mice lacking functional VGLUT3.
(A) Top: Diagram illustrating flow of information through the auditory system and average intensity image over the 10-minute imaging session. NBQX (50 mM) was applied to the left round window membrane. Middle: Activity over time in left and right IC in an individual where each line indicates the fluorescence intensity of each detected event, the circle indicates the dominant lobe, and the size of the circle indicated the difference in fluorescence. Bottom: Histograms showing the frequency of dominant events of a given amplitude for this experiment and for all experiments (n = 5 mice). (B) Similar to A, but in Vglut3 KO mice. (C) Spontaneous events observed in Vglut3 KO mice. (D) Example fluorescence transients from control and Vglut3 KO mice. (E) Average and amplitude normalized transients from control and Vglut3 KO mice. (F) Comparisons of average frequency, amplitude, and half-width from control and Vglut3 KO mice. (n = 9 control (Snap25-T2A-GCaMP6s; Vglut3+/+) and n = 7 Vglut3 KO animals; twotailed paired Student’s t-test with Bonferroni correction, *: P < 0.05, **: P < 0.005). (G) Similar to A, but in Vglut3 KO mice with NBQX applied to the left ear.
Figure 6.
Figure 6.. Coordinated activation of spiral ganglion neurons by inner supporting cells persists in Vglut3 KO mice.
(A) Intrinsic optical imaging performed in control and Vglut3 KO mice. The maximum size of detected crenations are outlined by colors based on time of occurrence, as indicated bytimelines below images. (B) Plots of crenation frequency and area. n = 7 cochlea from control and Vglut3 KO mice (twotailed Student’s t-test with Bonferroni correction applied, ns: not significant). (C) Spontaneous inward currents recorded from inner supporting cells from (inset) from control and Vglut3 KO mice. (D) Plots of event frequency and event amplitude n = 8 cells from control and Vglut3 KO cochlea (two-tailed Student’s t-test with Bonferroni correction applied, ns: not significant). (E) Time-lapse imaging of calcium transients from SGNs in Snap25-T2A-GCaMP6s mice (Left). Active cells are pseudocolored according to time of occurrence. Fluorescence traces from individual ROIs; bars indicate NBQX and high potassium application (Right). (F) Quantification of event frequency before and after application of NBQX (50 μΜ). n = 5 cochlea (two-tailed paired Student’s t-test, **** P < 0.0005). (G) Time-lapse imaging of calcium transients in SGNs in the Snap25-T2A-GCaMP6s;Vglut3 KO mice (Left). Active cells are pseudocolored according to time of occurrence. Fluorescence traces from individual ROIs; bars indicate NBQX, benzbromarone (BBE), and high potassium application (Right). Red asterisks highlight long duration, plateau calcium transients observed in Vglut3 KO mice. (H) Plot of event frequency before and after application of NBQX and BBE (n = 8 cochlea, oneway ANOVA, ns: not significant, * P < 0.05, ** P < 0.005). (I) Plot of number of cells active during each event in control and Vglut3 KO mice (n = 5 cochlea for control and n = 8 cochlea for Vglut3 KO; two-tailed Student’s t-test with Bonferroni correction, *** P < 0.0005). (J) Plot of average correlation coefficient between the 5 nearest cells or the 5 farthest cells in control and Vglut3 KO mice (n = 5 cochlea for control and n = 8 cochlea for Vglut3 KO; twoway ANOVA with Tukey post hoc, *: P < 0.05, *** P < 0.0005). (K) Probability density histograms of the duration (full width at half maximum, FWHM) of all events measured. Shown as mean ± S.E.M. Red asterisk highlights long duration events seen in Vglut3 KO mice. (L) Plot of mean duration of events (FWHM) (n = 5 cochlea for control and n = 8 cochleae for Vglut3 KO; two-tailed Student’s t-test, *: P < 0.05).
Figure 7.
Figure 7.. Spiral ganglion neurons in Vglut3 KO mice exhibit enhanced excitability.
(A) Schematic of the whole-cell recording configuration. (B) Membrane potential changes induced in an SGN from a control mouse in response to a series of current injections (indicated below) (−25 to 25 pA in 5 pA increments; first spike at 80 pA). Triangle and square indicate where the peak and steady-state voltage response were measured. (C) I-V plot showing the membrane response to different current injections. Input resistance was obtained from the slope of the function between 0 and 20 mV (peak) and 0 to 15 mV (steady-state). (D) Membrane potential changes induced in an SGN from a Vglut3 KO mouse in response to a series of current injections (indicated below) (−25 to 25 pA in 5 pA increments; first spike at 15 pA). (E) I-V plot showing the membrane response to different current injections. Input resistance was obtained from the slope between 0 and 20 mV (peak) and 0 to 15 mV (steady-state). (F) Membrane potential response to −2.5 pA current steps in control and Vglut3 KO mice. Tau measurements were obtained by fitting a single exponential between 10 and 90% max amplitude. Amplitudes were normalized. (G) Plots of action potential threshold, peak and steady-state input resistance, tau, and resting membrane potential. For recordings at 24°C, n = 9 c ells from 10 control cochleae and n = 8 cells from 6 Vglut3 KO cochlea; for recordings at 32°C, n = 4 cells fr om 3 control cochleae and n = 11 from 6 Vglut3 KO cochleae (two-tailed Student’s t-test with Bonferroni correction, ns: not significant, *: P < 0.05, **: P < 0.005, ***: P < 0.005). (H) Examples of plateau potentials evoked by current injection (top) and spontaneous plateau potentials observed at rest (bottom) in whole cell current clamp recordings from Vglut3 KO mice. Note that the plateau potentials (top right) can outlast the stimulus.

Comment in

  • And the Band Keeps Marching On.
    Kandler K. Kandler K. Neuron. 2018 Aug 8;99(3):427-429. doi: 10.1016/j.neuron.2018.07.043. Neuron. 2018. PMID: 30092211
  • Auditory advances.
    Whalley K. Whalley K. Nat Rev Neurosci. 2018 Oct;19(10):579. doi: 10.1038/s41583-018-0052-x. Nat Rev Neurosci. 2018. PMID: 30111776 No abstract available.

References

    1. Ackman JB, Burbridge TJ, and Crair MC (2012). Retinal waves coordinate patterned activity throughout the developing visual system. Nature 490, 219–225. - PMC - PubMed
    1. Allen-Sharpley MR, and Cramer KS (2012). Coordinated Eph-ephrin signaling guides migration and axon targeting in the avian auditory system. Neural Dev. 7, 1–14. - PMC - PubMed
    1. Barnstedt O, Keating P, Weissenberger Y, King AJ, and Dahmen JC (2015). Functional microarchitecture of the mouse dorsal inferior colliculus revealed through in vivo two-photon calcium imaging. J. Neurosci 35, 10927–10939. - PMC - PubMed
    1. Bobbin RP (1979). Glutamate and aspartate mimic the afferent transmitter in the cochlea. Exp. Brain Res 34, 389–393. - PubMed
    1. Clause A, Kim G, Sonntag M, Weisz CJC, Vetter DE, Rubsamen R, and Kandler K (2014). The precise temporal pattern of prehearing spontaneous activity is necessary for tonotopic map refinement. Neuron 82, 822–835. - PMC - PubMed

Publication types

MeSH terms