. 2018 Dec:183:532-543.
doi: 10.1016/j.neuroimage.2018.07.066. Epub 2018 Aug 2.

Evaluation of the accuracy and precision of the diffusion parameter EStImation with Gibbs and NoisE removal pipeline

Affiliations

Evaluation of the accuracy and precision of the diffusion parameter EStImation with Gibbs and NoisE removal pipeline

Benjamin Ades-Aron et al. Neuroimage. 2018 Dec.

Abstract

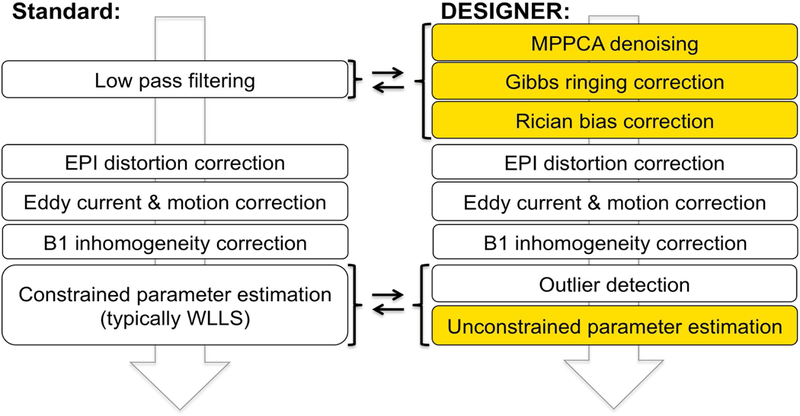
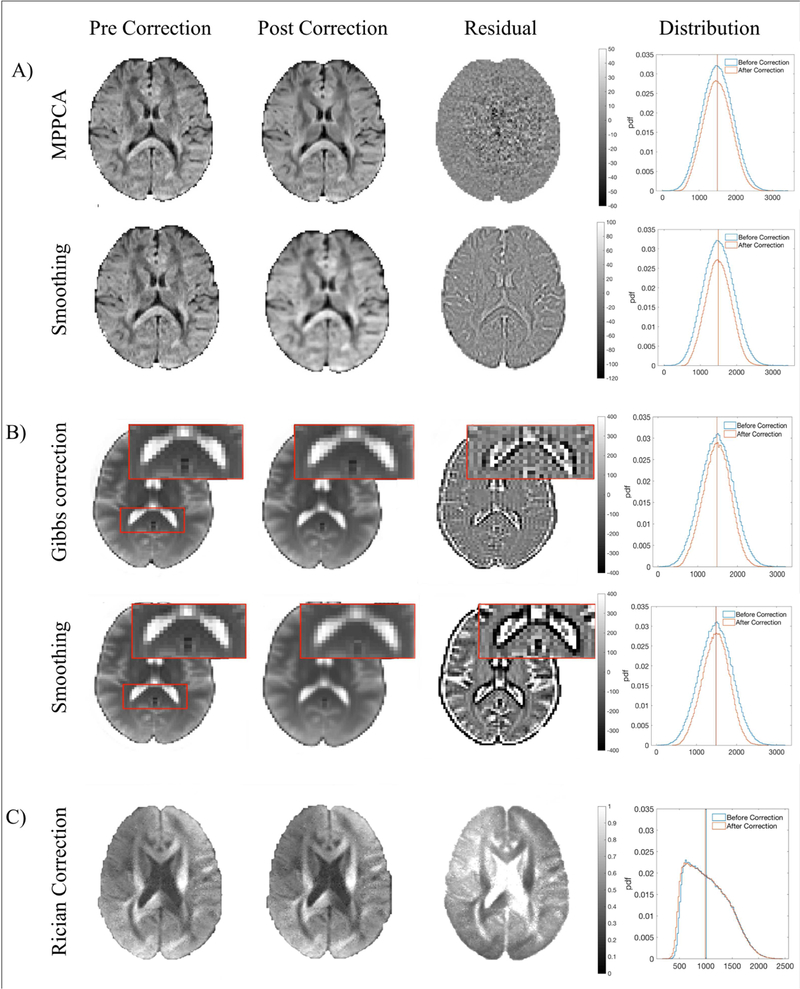
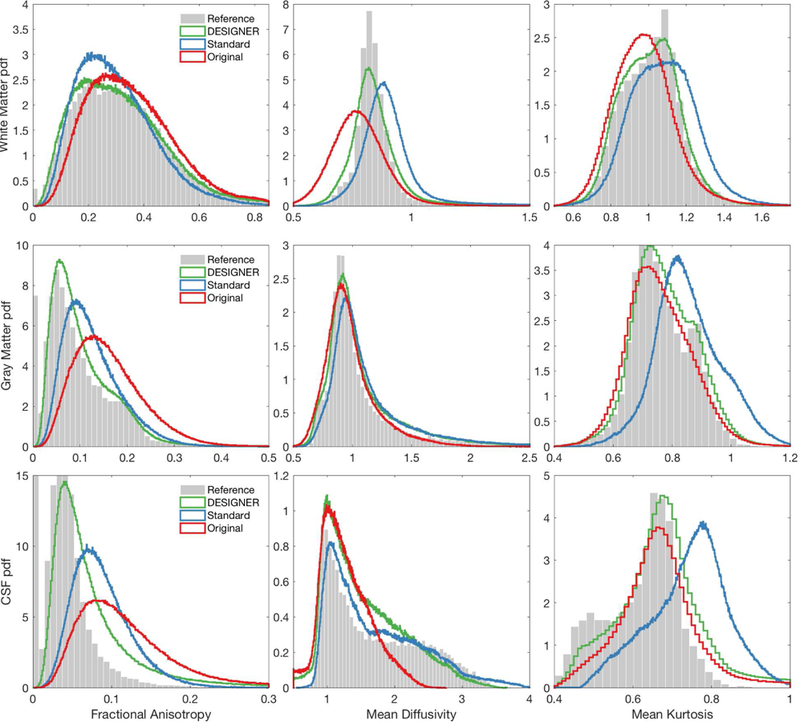
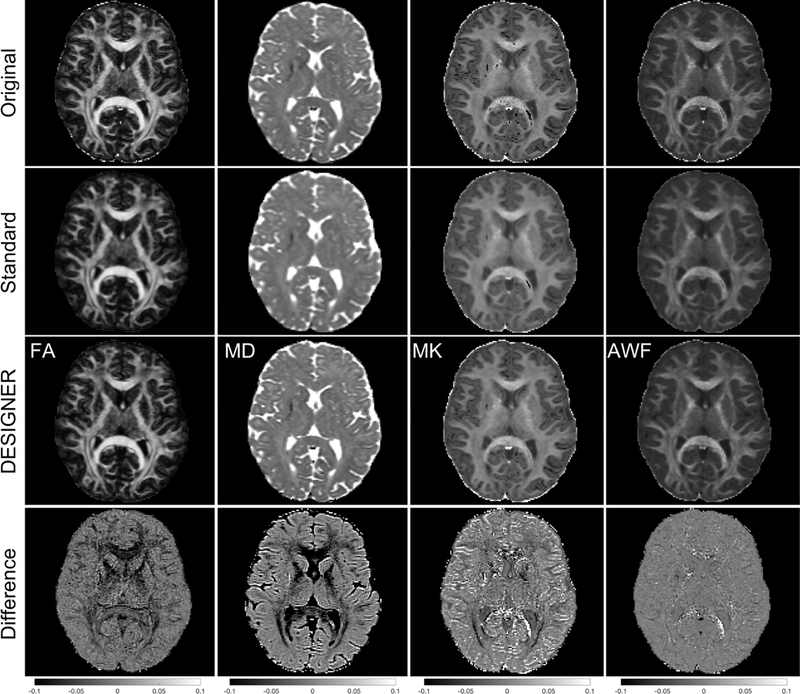
This work evaluates the accuracy and precision of the Diffusion parameter EStImation with Gibbs and NoisE Removal (DESIGNER) pipeline, developed to identify and minimize common sources of methodological variability including: thermal noise, Gibbs ringing artifacts, Rician bias, EPI and eddy current induced spatial distortions, and motion-related artifacts. Following this processing pipeline, iterative parameter estimation techniques were used to derive diffusion parameters of interest based on the diffusion tensor and kurtosis tensor. We evaluated accuracy using a software phantom based on 36 diffusion datasets from the Human Connectome project and tested the precision by analyzing data from 30 healthy volunteers scanned three times within one week. Preprocessing with both DESIGNER or a standard pipeline based on smoothing (instead of noise removal) improved parameter precision by up to a factor of 2 compared to preprocessing with motion correction alone. When evaluating accuracy, we report average decreases in bias (deviation from simulated parameters) over all included regions for fractional anisotropy, mean diffusivity, mean kurtosis, and axonal water fraction of 9.7%, 8.7%, 4.2%, and 7.6% using DESIGNER compared to the standard pipeline, demonstrating that preprocessing with DESIGNER improves accuracy compared to other processing methods.

Keywords: Artifact correction; Denoising; Diffusion MRI; Gibbs ringing; Image processing.


Figures

Figure 1:
Figure 1:
Overview of processing pipelines for dMRI: commonly used (left) and DESIGNER (right). The main difference is that smoothing has been replaced with MP-PCA denoising (by exploiting the redundancy of signal in the dMRI datset), followed by Gibbs artifact correction, and Rician bias correction. These steps (in this order) improve performance of the downstream artifact correction methods such as EPI/eddy distortion and motion corrections, and in our DKI example, can be followed by an unconstrained WLLS DKI fit due to an improved quality of the fit input.
Figure 2:
Figure 2:
Energy spectrum of residuals for b = 1000 s/mm2 human data that was Processed with DESIGNER. Residual maps were normalized by σ to give unitless energy values, therefore an energy of one implies that only noise with a standard deviation of σ was removed from the original image.
Figure 3:
Figure 3:
Effects of DESIGNER steps on HCP phantom. A) Effects of MP-PCA denoising (first row) versus smoothing (second row) on a b = 1000 s/mm2 image. Residuals show that MP-PCA remove only noise while smoothing removes additional signal. B) Effect of the Gibbs artifact correction on a b = 0 image with Gibbs artifacts evident in in the splenium of the corpus callosum before and after artifact correction, smoothing removes extra anatomy in addition to artifacts. C) Effect of the Rician bias correction on a b = 2000 s/mm2 image and the distribution of signal in the posterior limb of the internal capsule before and after correction.
Figure 4:
Figure 4:
A) The distribution of MD deviation from the ground truth in an ROI of randomly distributed voxels over the entire brain when denoising is applied prior to fitting and when no denoising is applied, compared to the distribution of MD in an ROI of the PLIC. This example illustrates that a correct signal model/representation works as well as denoising (i.e., in the perfect model case denoising should not yield extra benefit if the fitting is unbiased and no imaging artifacts are introduced). B) Variability of Diffusivity scales linearly with noise variance (PLIC of HCP phantom). The residual variance extrapolated to zero noise level provides an estimate for the inherent biological variability.
Figure 5:
Figure 5:
IRWLLS detection of outlier voxels due to a chemical shift in an example b = 1000 s/mm2 image. These voxels are reweighted during fitting to produce the corrected parametric maps.
Figure 6:
Figure 6:
Bias inherent to each pipeline and comparison to the ground truth. These images are based on ROIs of total white matter, gray matter, and CSF of the HCP brain phantom. Histograms are of FA, MD, MK, and AWF from left to right respectively. The distribution of parameters processed with DESIGNER hold more closely to that of the ground truth compared to processing using smoothing or no denoising methods.
Figure 7:
Figure 7:
Example, real-subject dataset - difference in contrast for FA, MD, MK, and AWF for DESIGNER, a standard pipeline (eddy current, motion correction, and smoothing), the original pipeline with (eddy current and motion correction), and the difference between DESIGNER and original processing.
Figure 8:
Figure 8:
Boxplots that show FA, MD, MK, and AWF values in 23 ROIs from the JHU White Matter atlas. ROIs over the left and right hemispheres have been averaged since there are very few differences across hemispheres that pertain to this analysis. Boxplots for HCP phantom data come from an ROI of the original phantom after averaging 50 noise realizations, boxplots of DESIGNER and standard pipelines represent the ROI after preprocessing and averaging over noise realizations.
Figure 9:
Figure 9:
Comparison of mean σn/μn over all 30 subjects for three cases: From left to right, the images show within subject variability when no processing is applied, when DESIGNER is applied, and when the standard processing pipeline with smoothing (1.25xVS) is applied. The coefficient of variation is lowest in parametric maps processed with DESIGNER compared to processing with both topup+eddy and with smoothing.

References

    1. Ades-Aron B, Veraart J, Kellner E, Lui YW, Novikov DS, Fieremans E, 2016. Diffusion parameter EStImation with Gibbs and NoisE Removal (DESIGNER) ISMRM, Singapore. - PMC - PubMed
    1. Aja-Fernandez S, Alberola-Lopez C, Westin CF, 2008. Noise and signal estimation in magnitude MRI and Rician distributed images: a LMMSE approach. IEEE Trans Image Process 17, 1383–1398. - PubMed
    1. Amartur S, Haacke EM, 1991. Modified iterative model based on data extrapolation method to reduce Gibbs ringing. Journal of Magnetic Resonance Imaging 1, 307–317. - PubMed
    1. Amartur S, Liang ZP, Boada F, Haacke EM, 1991. Phase-constrained data extrapolation method for reduction of truncation artifacts. Journal of Magnetic Resonance Imaging 1, 721–724. - PubMed
    1. Andersson JLR, Graham MS, Zsoldos E, Sotiropoulos SN, 2016. Incorporating outlier detection and replacement into a non-parametric framework for movement and distortion correction of diffusion MR images. Neuroimage 141, 556–572. - PubMed

Publication types

MeSH terms