. 2018 Aug 22;99(4):689-701.e5.
doi: 10.1016/j.neuron.2018.07.017. Epub 2018 Aug 2.

Enhancing Oligodendrocyte Myelination Rescues Synaptic Loss and Improves Functional Recovery after Chronic Hypoxia

Affiliations

Enhancing Oligodendrocyte Myelination Rescues Synaptic Loss and Improves Functional Recovery after Chronic Hypoxia

Fei Wang et al. Neuron. .

Abstract

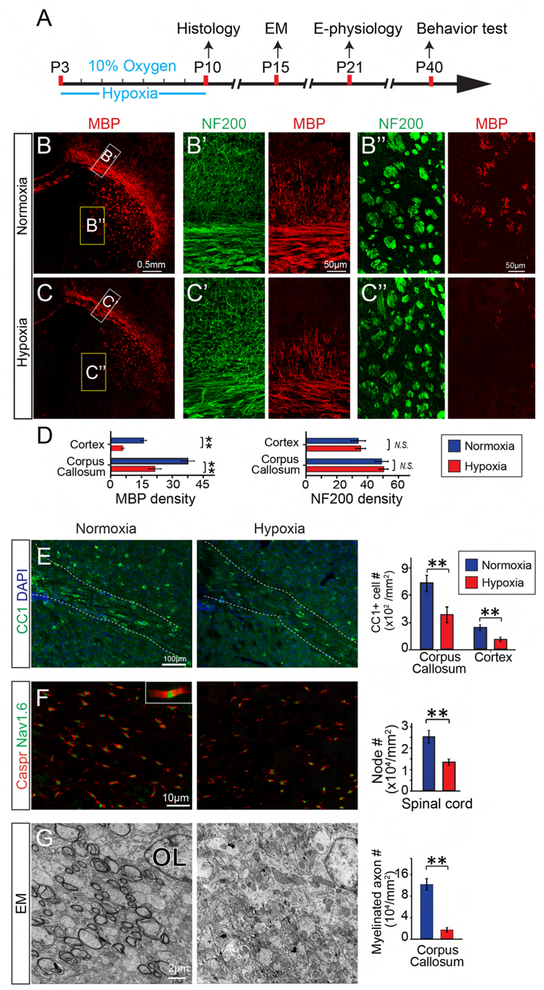
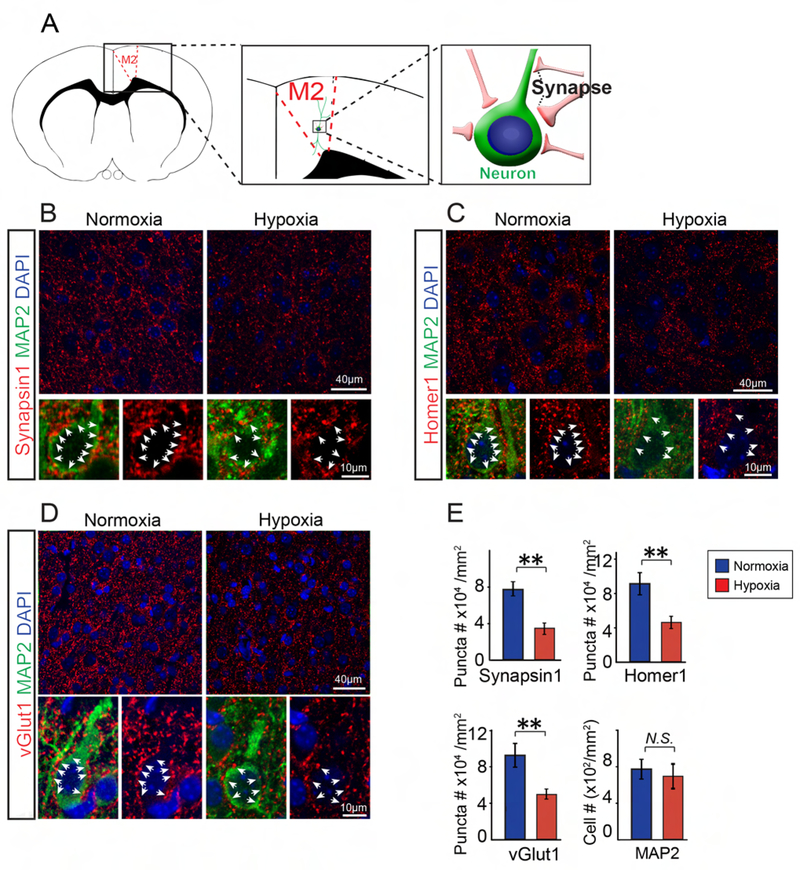
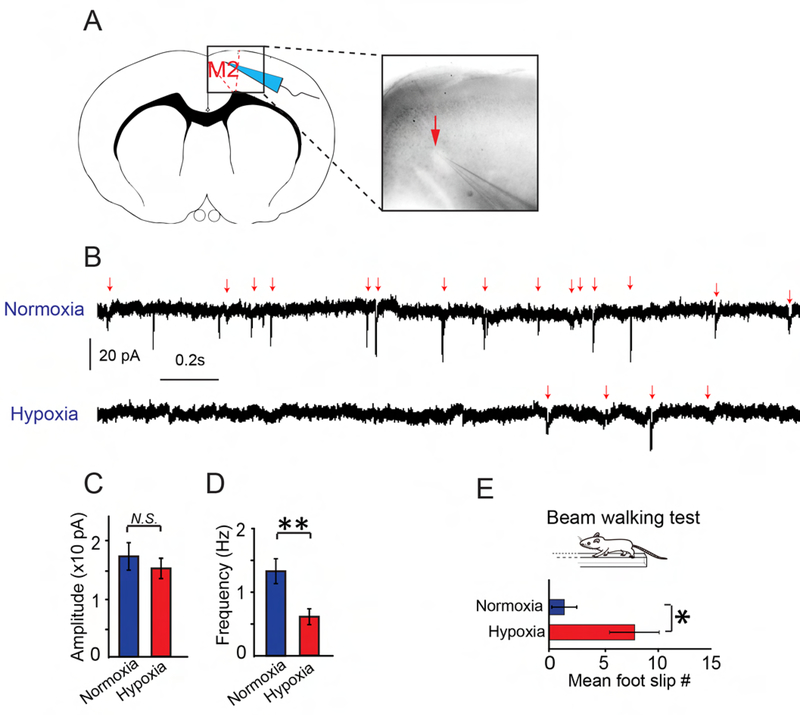
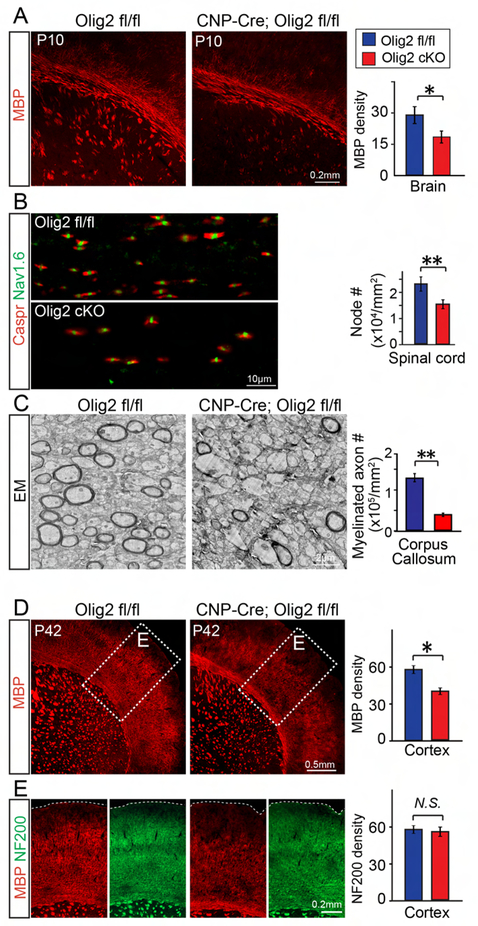
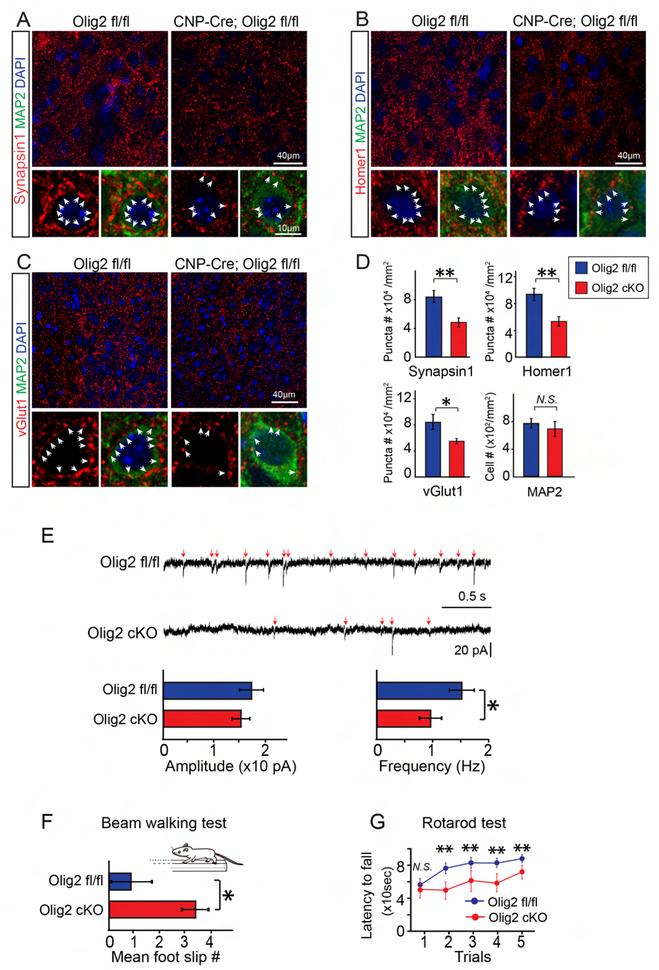
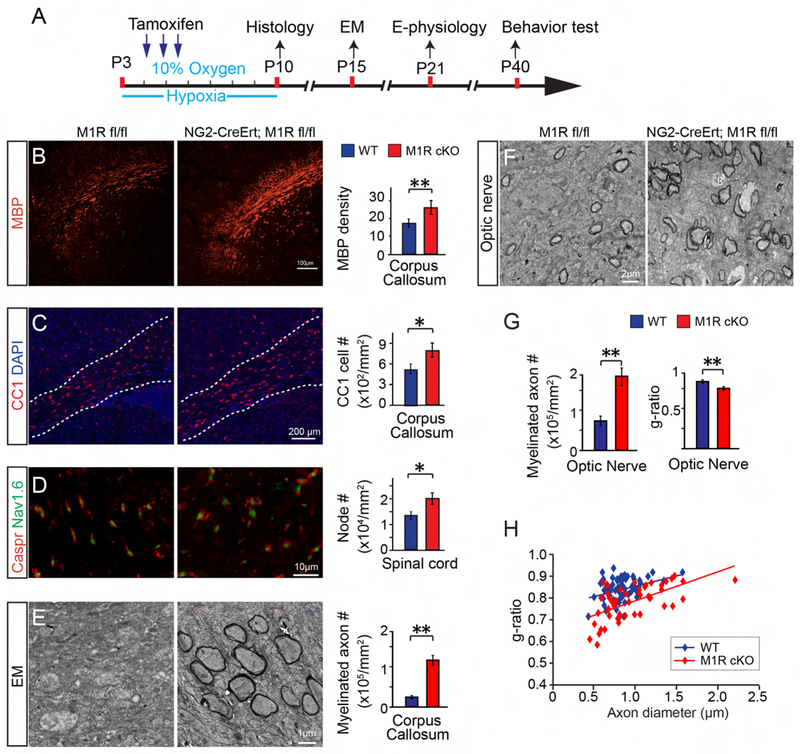
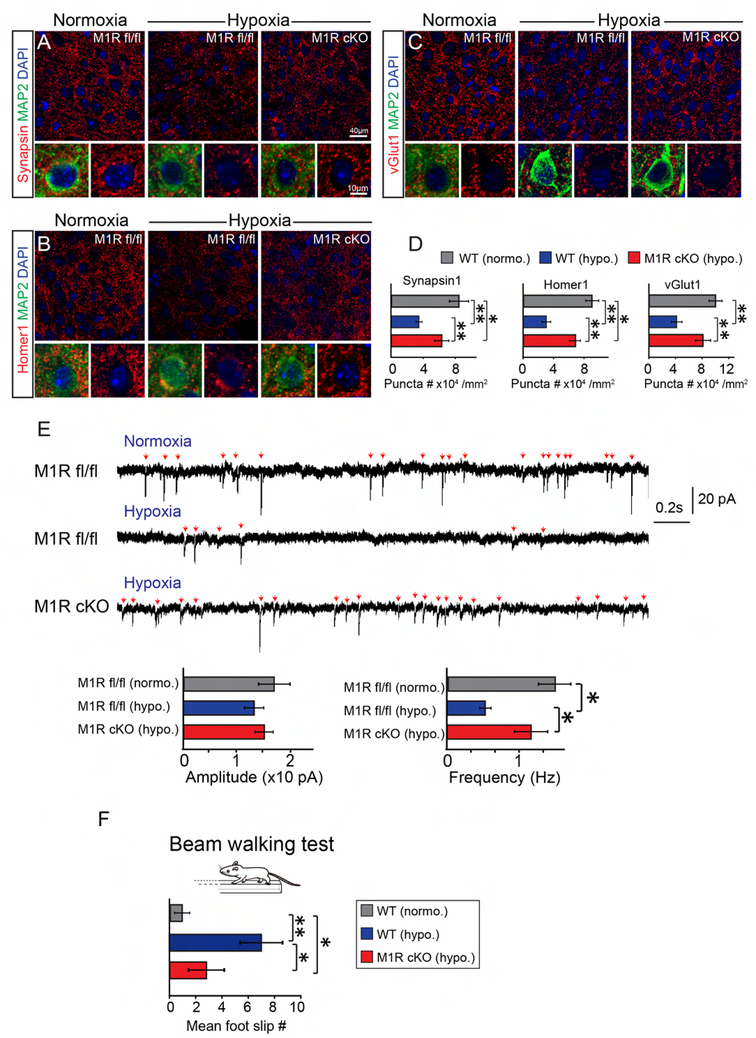
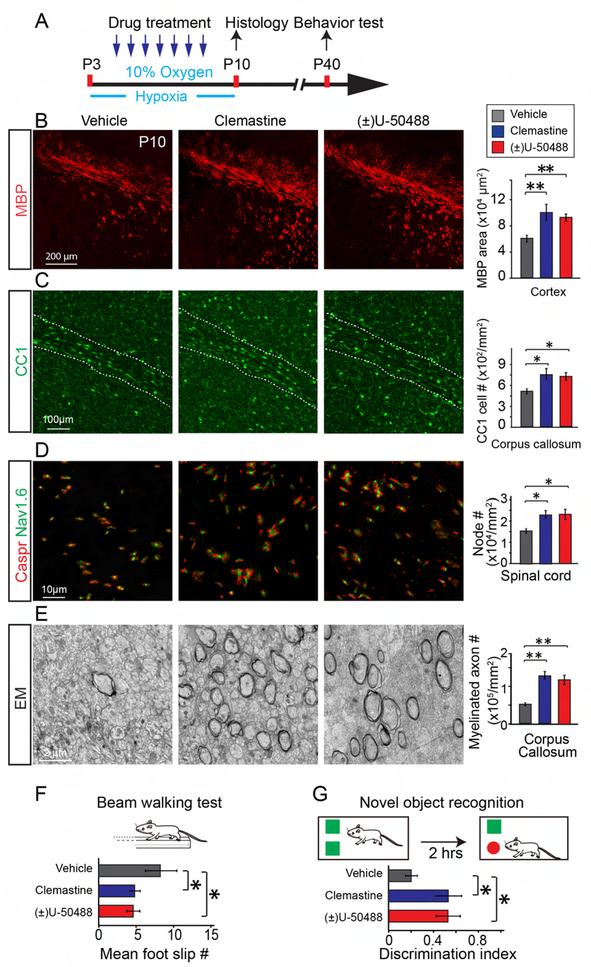
To address the significance of enhancing myelination for functional recovery after white matter injury (WMI) in preterm infants, we characterized hypomyelination associated with chronic hypoxia and identified structural and functional deficits of excitatory cortical synapses with a prolonged motor deficit. We demonstrate that genetically delaying myelination phenocopies the synaptic and functional deficits observed in mice after hypoxia, suggesting that myelination may possibly facilitate excitatory presynaptic innervation. As a gain-of-function experiment, we specifically ablated the muscarinic receptor 1 (M1R), a negative regulator of oligodendrocyte differentiation in oligodendrocyte precursor cells. Genetically enhancing oligodendrocyte differentiation and myelination rescued the synaptic loss after chronic hypoxia and promoted functional recovery. As a proof of concept, drug-based myelination therapies also resulted in accelerated differentiation and myelination with functional recovery after chronic hypoxia. Together, our data indicate that myelination-enhancing strategies in preterm infants may represent a promising therapeutic approach for structural/functional recovery after hypoxic WMI.

Keywords: M1R; Olig2; U-50488; beam-walking test; clemastine; hypomyelination; kappa opioid receptor; synaptogenesis; vGlut1; white matter injury.


Conflict of interest statement

DECLARATION OF INTERESTS: The authors declare no competing financial interests.

Figures

Figure 1.
Figure 1.. Chronic hypoxia results in hypomyelination in neonatal mice.
(A) Schematic diagram displaying the time course of hypoxic exposure and assays; (B, C) Representative immunofluorescent images displaying MBP expression in the normoxic (B) and hypoxic (C) brains; (B’, C’, B”, C”) Magnified images showing MBP and NF200 expression in the corpus callosum (B’, C’) and striatum (B”, C”). Scale bar, 0.5mm (B, C) and 50μm (B’-C”); (D) Quantification of MBP and NF200 density in the cortex and corpus callosum; (E) Immunostaining for CC1 displaying mature oligodendrocytes in the hypoxic and normoxic brains. (F) Representative images showing Nav1.6 positive nodal (green) and Caspr positive (red) paranodal regions on the longitudinal sections of spinal cords at P10. Numbers of CC1 positive cells (E) and Nav1.6/Caspr double positive nodes (F) were quantified in the brains and spinal cords respectively; (G) Representative EM images of corpus callosum at P15. Myelinated axon numbers were quantified. Scale bar, 100μm (E), 10μm (F) and 2μm (G). Error bars represent mean ± s.e.m. *p<0.05 or **p<0.01, significance based on Student’s t-test comparing hypoxia with normoxia conditions. n = 3 normoxic mice, n = 5 hypoxic mice for all the experiments. See also Figure S1.
Figure 2.
Figure 2.. Synaptogenesis in hypoxic mouse brains.
(A) Schematic diagram showing axonal terminals and synapses in the M2 cortex; (B-E) Representative images and quantification of synaptic puncta (red, white arrows) using a pan-presynaptic marker, synapsin-1 (B), a panpostsynaptic marker, homer1 (C) and an excitatory presynaptic marker, vGlut1 (D) in the normoxic and hypoxic M2 cortex at P10. Neurons were co-labeled with MAP2 staining and the numbers of MAP2 positive cells were quantified (E); Error bars represent mean ± s.e.m. *p<0.05 or **p<0.01, significance based on Student’s t-test as compared with the respective controls, n = 3 mice for all experiments. Scale bar, 40μm (upper panels in A-C) and 10μm (lower panels in A-C). See also Figure S1.
Figure 3:
Figure 3:. Chronic hypoxia impairs synaptic transmission and prolongs motor deficits.
(A) Schematic illustration showing the whole-cell patch clamp in the M2 cortex; (B-C) Sample recordings (3 s) of miniature EPSCs (mEPSC) recorded from the cortical pyramidal neurons of normoxic and hypoxic cortex at P21 (B), and average amplitude (C) and frequency (D) of mEPSCs were calculated (n = 9 cells from 2 normoxic mice, n=12 cells from 2 hypoxic mice). Error bars represent mean ± s.e.m. **p<0.01 significance based on Student’s t-test. (E) Mean number of foot slips of hypoxic and normoxic mice by using the beam walking test at P40. Error bars represent mean ± s.e.m. *p<0.05 significance based on non-parametric Mann-Whitney test comparing hypoxic to normoxic mice (n = 5 mice in each group). See also Figure S2.
Figure 4.
Figure 4.. Deletion of Olig2 in OPCs delays myelination.
(A, B) Representative images and quantification of MBP expression (A) in the brains and Caspr/Nav1.6 positive nodes (B) in the spinal cords of the Olig2 cKO mice (CNP-Cre; Olig2 fl/fl) and wildtype (Olig2 fl/fl) littermates at P10, Scale bar, 0.2mm (A) and 10μm (B); (C) Representative EM images of corpus callosum at P15. Myelinated axon numbers were quantified. (D) Representative images showing MBP in the Olig2 cKO and littermate wildtype brains at P42. (E) Magnified images showing MBP positive myelin and NF200 positive neurofilament in the cortex at P42. MBP and NF200 density was quantified in the cortex. Scale bar, 2μm (C), 0.5mm (D) and 0.2mm (E). Error bars represent mean ± s.e.m. *p<0.05, significance based on Student’s t-test comparing Olig2 cKO to wildtype, n = 3 mice for all experiments. See also Figure S3.
Figure 5.
Figure 5.. Hypomyelination attenuates synaptogenesis and synaptic transmission, and prolongs motor deficits in Olig2 cKO mice.
(A-D) Representative images of synaptic puncta (Red, white arrowheads) using synapsin-1 (A), homer1 (B), or vGlut1 (C) in the M2 cortex of Olig2 cKO and wildtype littermates at P10. Neurons were identified by MAP2 staining. Scale bar, 40μm (upper panels in A-C) and 10μm (lower panels in A-C). The numbers of MAP2 positive cells and the density of synaptic puncta were quantified (D), n = 3 mice in each group; (E) Sample recordings (3 s) of EPSCs from cortical pyramidal neurons at P14 and the average amplitude (left), and frequency (right) of EPSCs were quantified (n = 12 cells from 3 Olig2 fl/fl mice, n = 15 cells from 3 CNP-Cre; Olig2 fl/fl mice). Error bars represent mean ± s.e.m. *p<0.05, significance based on Student’s t-test with the respective controls. (F) Mean number of foot slips of Olig2 cKO mice and wildtype littermates revealed by the beam walking test at P40, n = 5 mice in each group; (G) The rotarod test revealed the latency in the time to fall from the spinning drum at P56, n = 7 mice in each group. *p<0.05 or **p<0.01, significance based on non-parametric Mann-Whitney test comparing with the respective controls.
Figure 6.
Figure 6.. Conditional knockout of M1R in OPCs rescues hypomyelination caused by hypoxia.
(A) Schematic diagram showing the time course of tamoxifen induction and hypoxic exposure; (B-D) Representative images showing MBP positive myelin (B), CC1 positive mature OLs (C) in the corpus callosum and Caspr/Nav1.6 positive nodes (D) in the spinal cord of M1R cKO (NG2-CreERt; M1R fl/fl) and wildtype (M1R fl/fl) mice at P10. Scale bar, 100μm (B), 200μm (C) and 10μm (D). MBP density, CC1 positive cell numbers and Caspr/Nav1.6 double positive nodes were quantified; (E, F) Representative EM images showing corpus callosum (E) and optic nerve (F) in the hypoxic M1R cKO mice and littermates. Scale bar, 1μm (E) and 2μm (F). Myelinated axon numbers in the corpus callosum (E) and optic nerve (G) were quantified. (H) Quantification of myelin sheath thickness and the scatterplot displays g-ratios of individual axons as a function of axonal diameter. Error bars represent mean ± s.e.m. *p<0.05 or **p<0.01, significance based on Student’s t-test by comparing M1R cKO to wildtype. n = 3 mice for all experiments. See also Figure S4.
Figure 7.
Figure 7.. Enhanced myelination rescues hypoxia induced synaptic deficits and promotes functional neuronal recovery.
(A-D) Representative images and quantification of synaptic puncta (red) using synapsin-1 (A), homer1 (B) and vGlut1 (C) in the M2 cortex of normoxic wildtype, hypoxic M1R cKO and wildtype littermates at P10. Neurons were identified by MAP2 (green) staining. Scale bar, 40μm (upper panels in A-C) and 10μm (lower panels in A-C). The number of synaptic puncta were quantified (D), n = 3 mice for all experiments, *p<0.05, ** p<0.01, significance based on Student’s t-test by comparing to respective control; (F) Sample recordings (3 s) of miniature EPSCs (mEPSC) recorded from cortical pyramidal neurons (n = 9 cells from 2 animals per group) and average amplitude (left), and frequency (right) of mEPSCs at P21. Error bars represent mean ± s.e.m. *p<0.05, ** p<0.01, significance based on Student’s t-test with the respective controls; (F) Beam walking test reveal the frequency of foot slips in the normoxic wildtype, hypoxic M1R cKO mice and wildtype littermates in at P40. ** p<0.01, *p<0.05, significance based on non-parametric Mann-Whitney by comparing to respective control, n = 5 mice in each group. See also Figure S5.
Figure 8.
Figure 8.. Myelin-enhancing drug treatment during hypoxia rescues hypoxia-induced hypomyelination and improves functional recovery.
(A) Experimental paradigm showing drug treatment and hypoxic exposure; (B, C) Representative images and quantification of MBP expression (red, B), CC1 positive OLs (green, C) in the brains and Caspr (red)/Nav1.6 (green) positive nodes (D) in the spinal cords of clemastine, (±)U50488 or vehicle treated mice. Error bars represent mean ± s.e.m. *p<0.05 or **p<0.01, significance based on Student’s t-test with the respective controls, n = 3 mice for each group. (E) Representative images and quantification of myelinated axons in the corpus callosum at P15. Error bars represent mean ± s.e.m. **p<0.01, significance based on Student’s t-test by comparing clemastine or (±)U50488 to vehicle, n = 3 mice for all experiments. Scale bar, 200μm (B), 100μm (C), 10μm (D) and 2μm (E). (F) The beam-walking test showing the frequency of foot slips of the clemastine, (±)U50488 or vehicle treated mice at P40, n = 7 mice for each group. *p<0.05, significance based on non-parametric Mann-Whitney test by comparing clemastine or (±)U50488 to vehicle; (G) The hypoxic mice treated with clemastine or (±)U50488 displayed significantly enhanced novel object recognition as compared to the vehicle controls, assessed 2 hours later after introduced to the objects, n = 7 mice for each group. *p<0.05, significance based on non-parametric Mann-Whitney test by comparing clemastine or (±)U50488 to vehicle. See also Figure S6–8.

References

    1. Aguirre A, Dupree JL, Mangin JM, Gallo V, 2007. A functional role for EGFR signaling in myelination and remyelination. Nat. Neurosci 10, 990–1002. - PubMed
    1. Back S. a, Han BH, Luo NL, Chricton C. a, Xanthoudakis S, Tam J, Arvin KL, Holtzman DM, 2002. Selective vulnerability of late oligodendrocyte progenitors to hypoxia-ischemia. J. Neurosci 22, 455–463. - PMC - PubMed
    1. Back SA, 2017. White matter injury in the preterm infant : pathology and mechanisms. Acta Neuropathol. 134, 331–349. - PMC - PubMed
    1. Back SA, 2015. Pediatric Neurology Brain Injury in the Preterm Infant : New Horizons for Pathogenesis and Prevention. Pediatr. Neurol 53, 185–192. - PMC - PubMed
    1. Back SA, Rosenberg PA, 2014. Pathophysiology of glia in perinatal white matter injury. Glia 62, 1790–1815. - PMC - PubMed

Publication types

MeSH terms

Substances