. 2018 Aug 23;174(5):1309-1324.e18.
doi: 10.1016/j.cell.2018.06.052. Epub 2018 Aug 2.

A Single-Cell Atlas of In Vivo Mammalian Chromatin Accessibility

Affiliations

A Single-Cell Atlas of In Vivo Mammalian Chromatin Accessibility

Darren A Cusanovich et al. Cell. .

Abstract

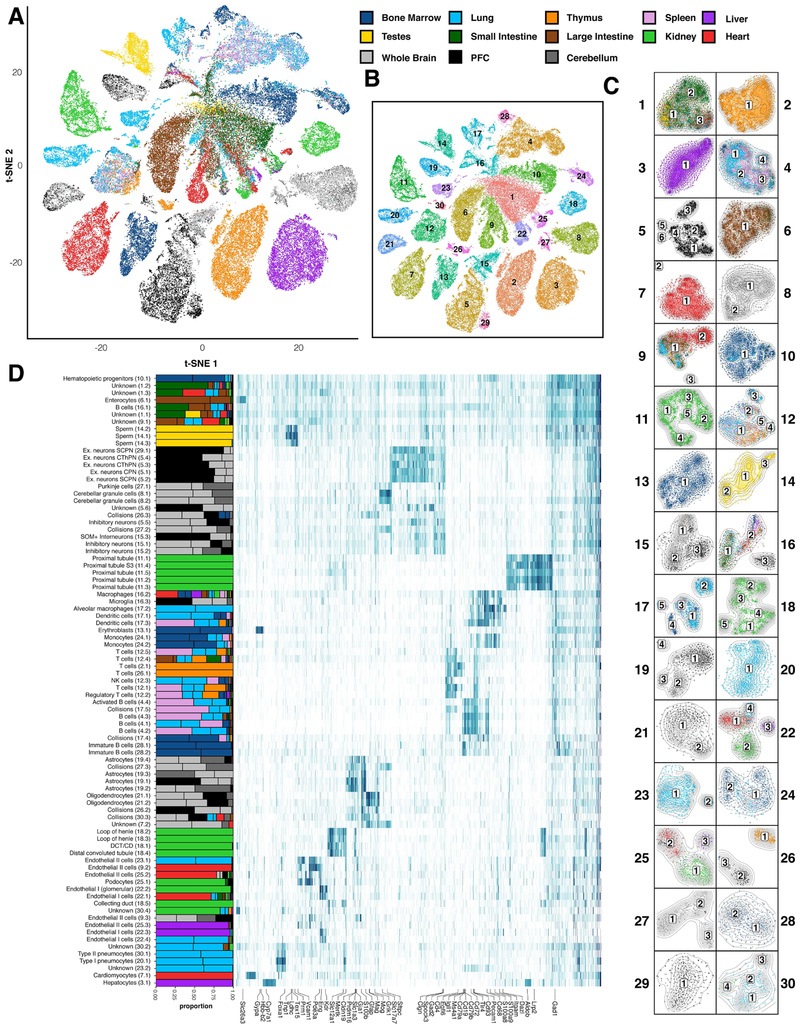
We applied a combinatorial indexing assay, sci-ATAC-seq, to profile genome-wide chromatin accessibility in ∼100,000 single cells from 13 adult mouse tissues. We identify 85 distinct patterns of chromatin accessibility, most of which can be assigned to cell types, and ∼400,000 differentially accessible elements. We use these data to link regulatory elements to their target genes, to define the transcription factor grammar specifying each cell type, and to discover in vivo correlates of heterogeneity in accessibility within cell types. We develop a technique for mapping single cell gene expression data to single-cell chromatin accessibility data, facilitating the comparison of atlases. By intersecting mouse chromatin accessibility with human genome-wide association summary statistics, we identify cell-type-specific enrichments of the heritability signal for hundreds of complex traits. These data define the in vivo landscape of the regulatory genome for common mammalian cell types at single-cell resolution.

Keywords: ATAC-seq; GWAS; chromatin; chromatin accessibility; epigenetics; epigenomics; regulatory; single cell.


Figures

Figure 1.
Figure 1.. Workflow for generating chromatin accessibility profiles from single cells in mouse.
(A) Schematic of collected tissues, “x2” indicates replicated tissues. (B) Schematic of sci-ATAC-seq protocol. Nuclei barcoded in wells of a plate during Tn5 tagmentation. After pooling and splitting onto a second plate, a second barcode is introduced via PCR. Unique combinations of barcodes identify reads from single cells. (C) Count of cells from each tissue passing QC. (D) Example of QC steps and peak calling (data shown from spleen). Low read depth barcodes and barcodes lacking strong banding patterns are filtered. Cells are scored for insertions in 5 kilobase (kb) windows across the genome, normalized using latent semantic indexing (LSI), and clustered. Peaks are called separately on each cluster. (E) Peaks from all clusters across all tissues are merged into a master peak set for a binary cell x peak matrix indicating any reads occuring in each peak for each cell. See also Fig. S1-S2.
Figure 2.
Figure 2.. Clustering of single cell chromatin accessibility identifies diverse cell types.
(A) t-SNE embedding of all cells from the dataset colored by tissue. (B) Same as A colored/labeled according to the 30 clusters in the first round of clustering. (C) Iterative t-SNE embeddings for cells from each cluster in A colored by tissue and labeled by their iterative cluster (85 total clusters). (D) Heatmap of beta values from differential accessibility tests relative to reference cells. The numbers in parentheses correspond to the clusters in Fig. 2C (major.iterative cluster). A sampling of 10,000 sites that are significantly more accessible than in the reference for at least one cluster are shown along with the promoters of relevant genes (highlighted along the bottom). The proportion of each cluster originating from each tissue is shown alongside the heatmap. See also Fig. S4, Table S1.
Figure 3.
Figure 3.. KNN-based approach allows for comparison of sc-ATAC-seq and sc-RNA-seq atlases.
(A and B) Heatmaps of spearman correlations between average normalized expression/activity score profiles for groups defined in Han et al. (sc-RNA-seq; x-axis) and our dataset (y-axis) for kidney and lung respectively. (C) Schematic of KNN-based approach for transferring labels from sc-RNA-seq data to sci-ATAC-seq data cell-by-cell in PCA embedding (see STAR Methods). (D) t-SNE embedding colored by labels made on sci-ATAC-seq data alone (left) and labels derived from KNN using Han et al. kidney data (right). Labels are annotated with “(A)” if present in ATAC study, “(R)” if present in RNA study, and “(A/R)” if present are in both. Similar colors indicate similar annotations. (E) Same as D for lung. (F-G) Matrix of the proportions of each sci-ATAC-seq category that maps to each category from Han et al. Note that some labels from Han et al. were shortened (see STAR Methods). Only cell types at or above a 0.5% frequency are shown for each study. sc-RNA-seq cells with fewer than 600 UMIs across genes common to both datasets and sci-ATAC-seq cells with fewer than 1,800 non-zero values in master peak set were excluded to improve KNN performance (also used to compute correlations with little impact on results). See also Fig. S5-S6.
Figure 4.
Figure 4.. Cell-type specific chromatin accessibility is associated with a complex sequence grammar.
(A) Schematic of steps for finding motifs specific to clusters by training a CNN and postprocessing of the first layer convolution nodes (called “filters”). DA sites from each cell cluster were fed into the Basset framework. Filters were annotated by similarity to known motifs and their influence on classification was evaluated. Usage of motifs was projected onto the t-SNE embedding of all cells. (B) Heatmap showing normalized influence of motif-annotated filters on classification. Only positive influence scores colored in heatmap. Barplot on top indicates proportion of cells in each cluster from each tissue. Selected filters matching known motifs are highlighted on left. (C) t-SNE embeddings of motif activity for selected filters.
Figure 5.
Figure 5.. Chromatin structure reflects cellular specialization and tissue spatial architecture.
(A) t-SNE embedding of endothelial cells (clusters 9.2-3, 22.1-4, 23.1, 25.2-3; colored by tissue). Numbers indicate resulting subclusters. (B) Proportion of each endothelial subcluster contributed by each tissue. (C) Cicero gene activity scores for selected marker genes. (D) Same as A, but for macrophages, monocytes and dendritic cells (clusters 16.2-3, 17.1-3, and 24.1-2). (E) Same as B, but for clusters in D. (F) Heatmap showing Cicero gene activity scores for selected marker genes. (G) Cells from the prefrontal cortex (PFC) visualized by t-SNE. Colored by major cluster from Fig. 2B. (H) Cicero gene activity scores for selected markers of cell types expected in the PFC. Oligodendrocytes (Oligo), interneurons (Inter), excitatory neuron (Ex neuron), endothelial (Endo). (I) Cicero gene activity scores for selected marker genes for different cortical layers (Lake et al., 2016). “Excitatory neurons layers II-IV” (Ex II - IV), “excitatory neurons layer VI” (Ex VI), “interneurons layer V-VI” (Inter V-VI), “interneurons of the medial ganglionic eminence” (Inter MGE). (J) Same as G but for kidney. (K) Cicero gene activity scores for GWAS disease genes with restricted expression patterns (Park et al., 2018). Proximal tubule (PT), Loop of Henle (LoH), distal convoluted tubule (DCT), collecting duct (CD). (L) Cicero gene activity scores for additional GWAS disease genes from Park et al.
Figure 6.
Figure 6.. Chromatin accessibility dynamics during hematopoiesis.
(A) t-SNE embedding of bone marrow cells colored by major cluster from Fig. 2B. (B) Branched hematopoietic trajectory colored by accessibility of lineage restricted enhancers (Lara-Astiaso et al., 2014). Color values represent normalized mean accessibility of peaks overlapping known enhancers (top: erythroid and erythroid progenitor, middle: lymphoid and lymphoid progenitor, bottom: myeloid and myeloid progenitor). (C) Cicero gene activity scores of selected marker genes (Cd19, Hbb-b1, Itgam and Cd34 for B cells, erythroid, myeloid, and hematopoietic stem cells, respectively) across pseudotime in each branch. Each line includes cells from the root to the named branch (from B). Activity scores plotted as a moving average over pseudotime(percent of total distance from the root). (D) Cicero co-accessibility at the β-globin locus control region (LCR) along erythroid differentiation (roughly equal size groups). Cells used to generate each plot are highlighted (right). Lymphoid and myeloid plots included for comparison. Boxes below each track indicate sci-ATAC-seq peaks (colored by overlap with elements in the β-globin locus diagrams below and in E). Arcs connecting peaks represent co-accessibility (height indicates strength of co-accessibility). Only connections originating in the LCR with co-accessibility above 0.25 (dashed line) are shown (LCR is red highlighted region) (E) Model of the β-globin locus adapted from (Noordermeer and de Laat, 2008).
Figure 7.
Figure 7.. Mouse chromatin profiles are associated with heritable human traits.
(A) Schematic of LDSC analysis workflow. (B) Heatmaps of −log10(q-value of enrichment). Trait/cluster pairs with no significant enrichment are white. Plots to the left of each heatmap indicate the number of cells in each cluster and proportion of cells from each tissue. Upper panel shows results when using peaks called on bulk tissues. Bottom panel shows results when using peaks that are positively differentially accessible for each of the 85 iterative clusters. Letters above the lower heatmap indicate the columns for traits highlighted in panels C-E. (C-E) Individual traits (columns) from the lower heatmap in panel B. Within each panel the following are shown: the proportion of each tissue composing that cluster and −log10(q-value of the enrichment). Clusters are sorted by q-value and the dotted line indicates a q-value of 0.05. See also Fig. S7.

References

    1. Adey A, Morrison HG, Asan Xun, X., Kitzman JO, Turner EH, Stackhouse B, MacKenzie AP, Caruccio NC, Zhang X, et al. (2010). Rapid, low-input, low-bias construction of shotgun fragment libraries by high-density in vitro transposition. Genome Biol 11, R119. - PMC - PubMed
    1. Amini S, Pushkarev D, Christiansen L, Kostem E, Royce T, Turk C, Pignatelli N, Adey A, Kitzman JO, Vijayan K, et al. (2014). Haplotype-resolved whole-genome sequencing by contiguity-preserving transposition and combinatorial indexing. Nat. Genet 46, 1343–1349. - PMC - PubMed
    1. Arendt D, Musser JM, Baker CVH, Bergman A, Cepko C, Erwin DH, Pavlicev M, Schlosser G, Widder S, Laubichler MD, et al. (2016). The origin and evolution of cell types. Nat. Rev. Genet 17, 744–757. - PubMed
    1. Bailey TL, Boden M, Buske FA, Frith M, Grant CE, Clementi L, Ren J, Li WW, and Noble WS (2009). MEME SUITE: tools for motif discovery and searching. Nucleic Acids Res 37, W202–W208. - PMC - PubMed
    1. Bello SM, and Eppig JT (2016). Inferring gene-to-phenotype and gene-to-disease relationships at Mouse Genome Informatics: challenges and solutions. J. Biomed. Semantics 7, 14.

Publication types