. 2018 Aug 23;174(5):1127-1142.e19.
doi: 10.1016/j.cell.2018.07.011. Epub 2018 Aug 2.

Dual Roles of Poly(dA:dT) Tracts in Replication Initiation and Fork Collapse

Affiliations

Dual Roles of Poly(dA:dT) Tracts in Replication Initiation and Fork Collapse

Anthony Tubbs et al. Cell. .

Abstract

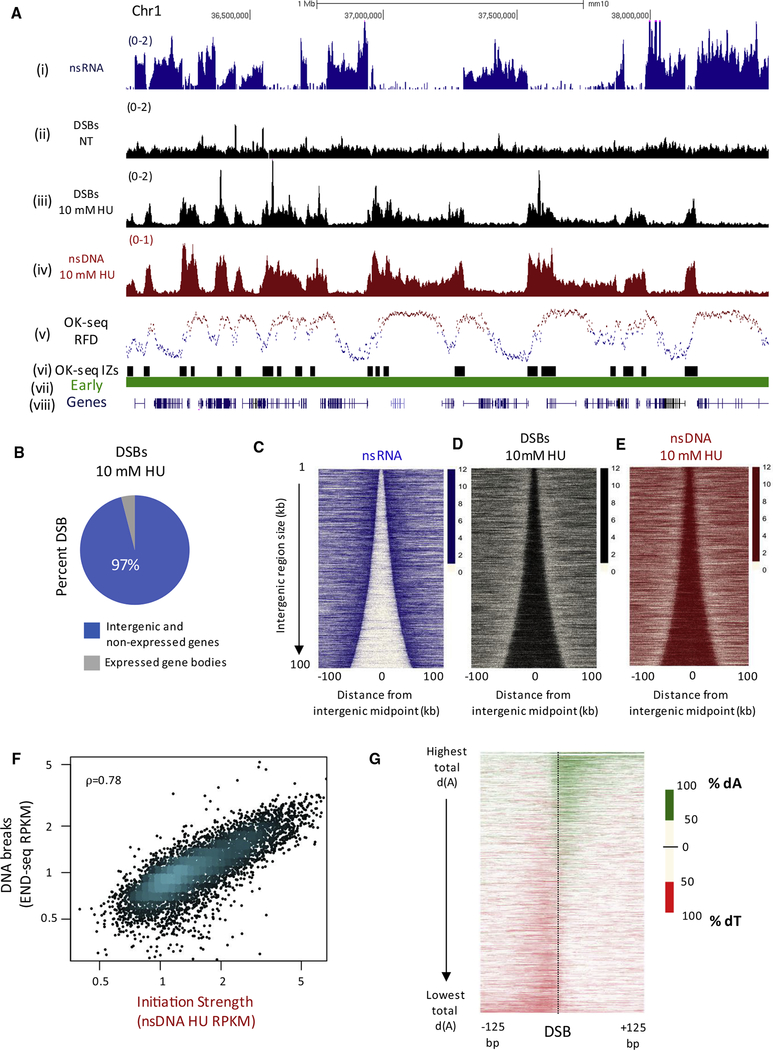
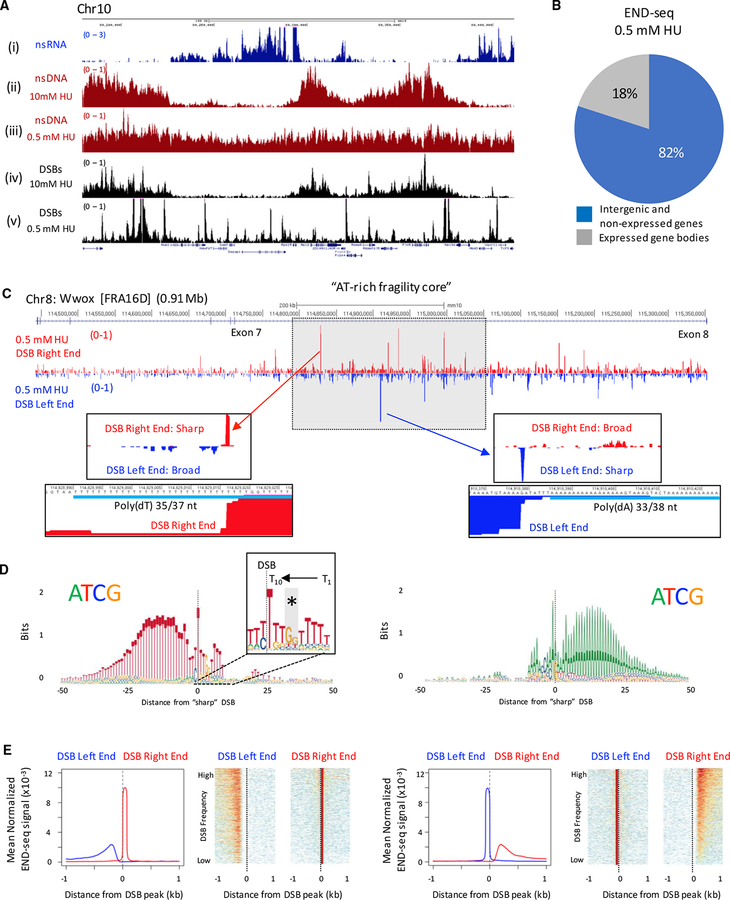
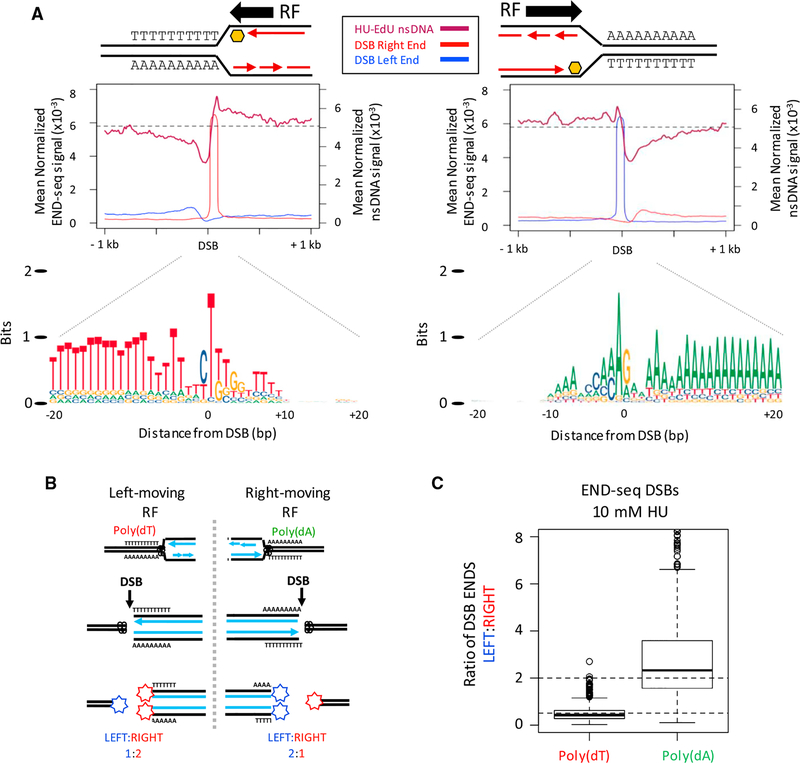
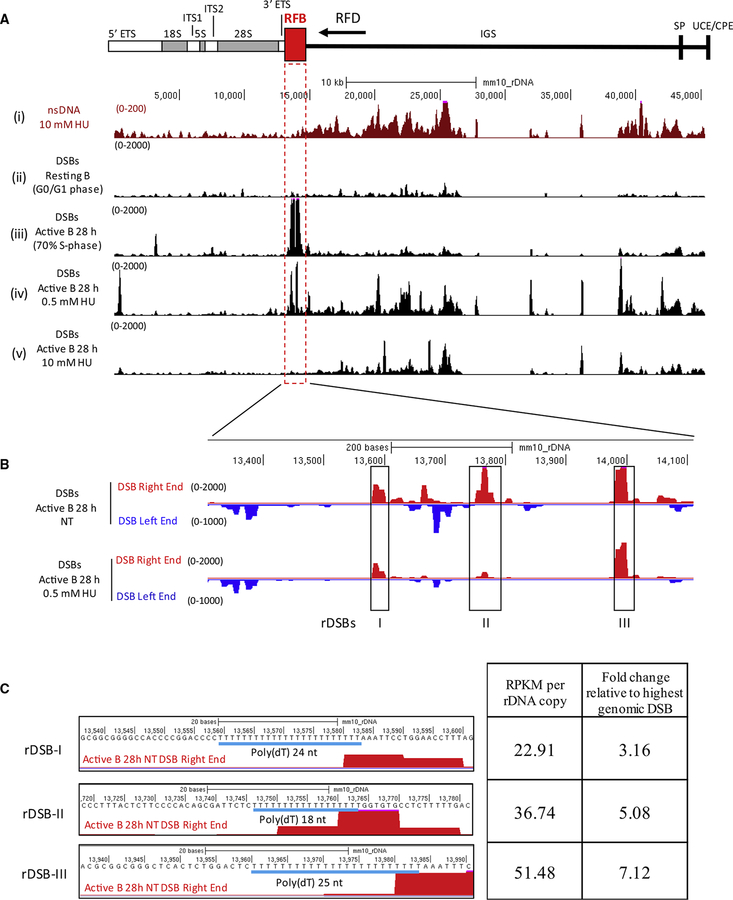
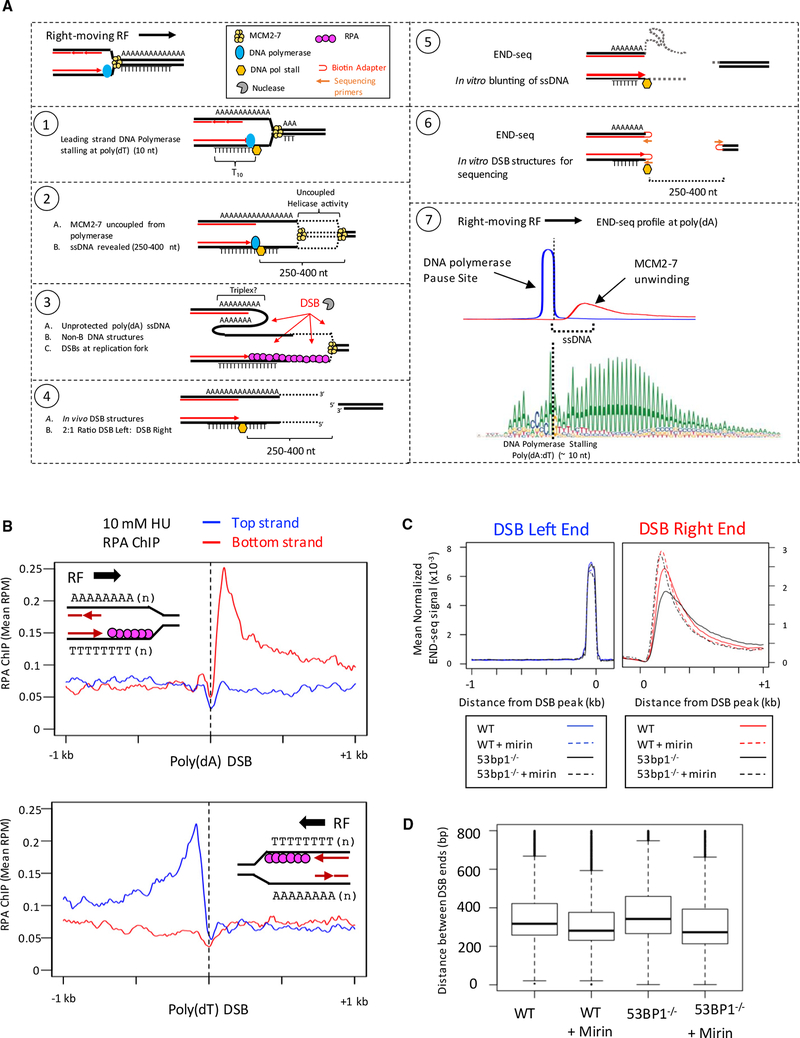
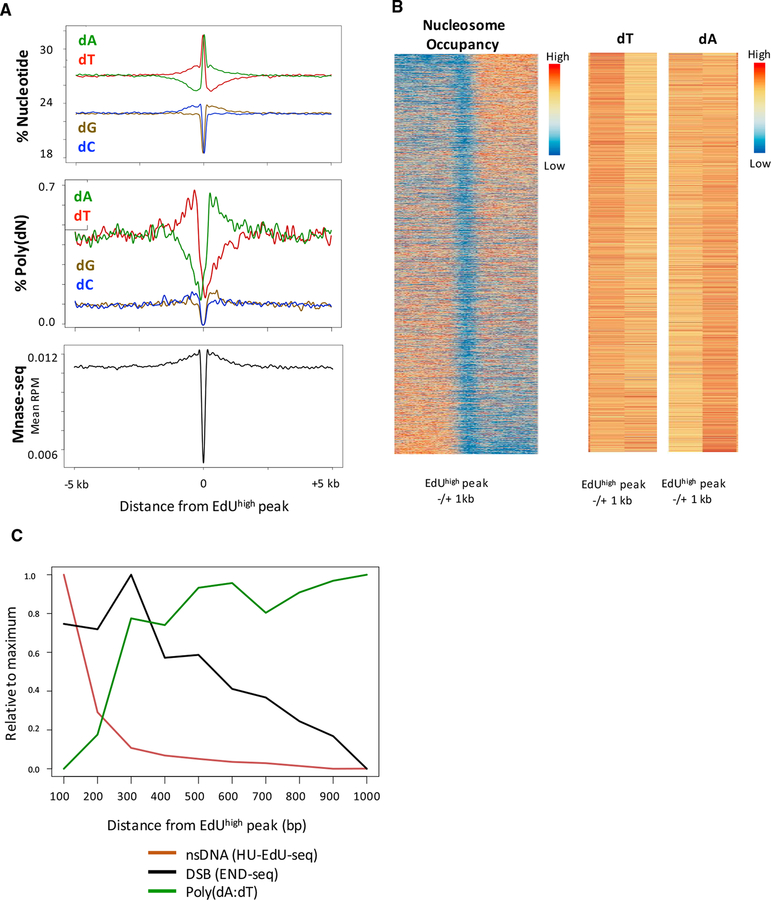
Replication origins, fragile sites, and rDNA have been implicated as sources of chromosomal instability. However, the defining genomic features of replication origins and fragile sites are among the least understood elements of eukaryote genomes. Here, we map sites of replication initiation and breakage in primary cells at high resolution. We find that replication initiates between transcribed genes within nucleosome-depleted structures established by long asymmetrical poly(dA:dT) tracts flanking the initiation site. Paradoxically, long (>20 bp) (dA:dT) tracts are also preferential sites of polar replication fork stalling and collapse within early-replicating fragile sites (ERFSs) and late-replicating common fragile sites (CFSs) and at the rDNA replication fork barrier. Poly(dA:dT) sequences are fragile because long single-strand poly(dA) stretches at the replication fork are unprotected by the replication protein A (RPA). We propose that the evolutionary expansion of poly(dA:dT) tracts in eukaryotic genomes promotes replication initiation, but at the cost of chromosome fragility.

Keywords: DNA breaks; fragile sites; genome instability; poly(dA:dT) tracts; replication fork barrier; replication origins; replication stress; ribosomal DNA.


Conflict of interest statement

DECLARATION OF INTERESTS

The authors declare no competing interests.

Figures

Figure 1.
Figure 1.. Replication Initiation Zones Are Prone to Fork Collapse
(A) Genome browser shots illustrating DSBs and replication initiation zones for activated B cells. (Top to bottom) Normalized read density (reads per million, RPM) for (i) nascent RNA (nsRNA), (ii and iii) DSBs from END-seq in activated B cells in non-treated (NT) and treated with 10 mM HU for 28 hr, (iv) nascent DNA from HU-EdU-seq (nsDNA) in activated B cells treated with 10 mM HU for 28 hr, (v) OK-seq replication fork direction (RFD), (vi) replication initiation zones from 48-hr activated B cells using OK-seq, (vii) replication timing determined using TimEX ratios from resting and activated B cells, and (viii) gene annotations from UCSC. (B) Genomic distribution of 43,585 DNA DSB sites in activated B cells treated with 10 mM HU for 28 hr. (C) Heatmaps showing the antagonistic relationship between transcription (nsRNA, blue), replication initiation, and HU-induced DSBs in activated B cells. For all heatmaps, gene pairs are ordered by the size of the intergenic region and centered on the midpoint of the intergenic region between the two active genes. (D) Heatmap of 10 mM HU-induced DSBs (black) in activated B cells. (E) Heatmap of replication initiation (nsDNA, red) in activated B cells. (F) Scatterplot demonstrating correlation between replication initiation strength (nsDNA levels) and DNA DSBs in activated B cells treated with 10 mM HU. ρ = 0.78, Spearman’s rank correlation. (G) Heatmap of asymmetric dA and dT distribution in a 20-bp sliding window around 43,585 DSB sites found in activated B cells treated with 10 mM HU.
Figure 2.
Figure 2.. Asymmetric Collapse of Progressing Forks at Poly(dA:dT) within Common Fragile Sites
(A) Genome browser shots showing (i) nsRNA, (ii and iii) nsDNA, and (iv and v) DSBs in activated B cells treated with 10 mM or 0.5 mM HU. (B) Genomic distribution of 76,382 DNA DSB sites in activated B cells treated with 0.5 mM HU. (C) Genome browser shots showing DSBs in the Wwox “AT-rich fragility core” in activated B cells treated with 0.5 mM HU. END-seq reads were separated by strand: bottom strand sequences represent a DSB left end (blue), and top strand sequences represent a DSB right end (red). DSB peaks with a sharp right end (middle left panel) or sharp left end (middle right panel) are displayed along with the poly(dA:dT) sequences associated with the sharp DSB end (bottom panels). (D) Composite motif at the sharp DSB end for the top-1,000 DSBs associated with poly(dT) (left panel) and poly(dA) (right panel) in activated B cells treated with 0.5 mM HU. The sharp DSB end is indicated with a vertical line at position 0, preferentially positioned 10 nt from the beginning of the dA/dT tract. Inset box shows conserved 10 nt dT tract at the sharp DSB end and GG interruption (*). (E) Composite plots and heatmaps depicting asymmetry between DSB ends for the top-1,000 DSB sites associated with poly(dT) (left panels) and poly(dA) (right panels) in activated B cells treated with 0.5 mM HU.
Figure 3.
Figure 3.. Spontaneous Replication Fork Breakage at Poly(dA:dT)
(A) Composite plot showing DSBs and nsDNA depletion at poly(dA) tracts in non-HU-treated (NT) 28-hr activated B cells. (B) Boxplots showing END-seq reads at the 2,000 poly(dA:dT) sites most frequently broken with 0.5 mM HU in activated B cells. (Right) Bar plot comparing the frequency of spontaneous DSBs to DSBs induced by 0.5 mM HU. *** p < 10−12; Wilcoxon rank-sum test. (C) Nucleotide composition ± 20 bp from the “sharp” DSB end for the top-1,000 DSBs in B cells activated for 28 hr with ATR inhibitor. (D) Composite plot showing DSBs at poly(dA) tracts in B cells activated for 28 hr with ATR inhibitor.
Figure 4.
Figure 4.. Unidirectional Replication Fork Stalling and Breakage Are Associated with poly(dA:dT)
(A) (Top panels) Composite plots for nsDNA and strand-separated END-seq reads (DSB left/right end) at the top-1,000 poly(dA) or poly(dT) DSB sites in activated B cells treated with 10 mM HU. Replication fork (RF) direction is inferred from the nsDNA signal surrounding the DSB. (Bottom panel) Composite motif ± 20 bp of the sharp DSB end for the regions analyzed in top panels, illustrating a unidirectional RF stall at poly(dA:dT) containing poly(dT) on the leading strand. (B) Proposed ratios of DSB ends at a poly(dA:dT) polar replication fork barrier. (C) Boxplots showing the ratio of DSB ends (left:right) for the top-1,000 DSB sites with poly(dA) or poly(dT) near the sharp DSB end in activated B cells treated with 10 mM HU.
Figure 5.
Figure 5.. Spontaneous Asymmetric DSBs at the rDNA Replication Fork Barrier
(A) (Top) Diagram of the rDNA locus. Replication fork barrier (RFB) and predicted replication fork direction (arrow, RFD) are indicated. (Bottom) UCSC genome browser shots for (i) replication initiation (nsDNA), DSBs in (ii) resting B cells, (iii) activated B cells (28 hr), (iv) activated B cells treated with 0.5 mM HU, and (v) activated B cells treated with 10 mM HU. (B) Genome browser shots of the three spontaneous DSBs at the rDNA RFB, separated by DSB ends. (C) Left panel: poly(dA:dT) sequences at the spontaneous rDSBs. Right panel: DSB frequency as determined by RPKM, relative to the highest spontaneous genomic DSB (RPKM = 7.2) in activated B cells.
Figure 6.
Figure 6.. Model for Replication Fork Breakage at Poly(dA:dT) Tracts
(A) Model for replication fork breakage at poly(dA:dT) and detection of replication fork DSBs by END-seq. END-seq reveals the site of DNA polymerase stalling on one end and the location where MCM2–7 helicase stops ahead of the polymerase on the other end. (B) ChIP-seq separated by strands at poly(dA) and poly(dT) sequences. (Top panel) Composite plot for RPA ChIP at poly(dA) sites broken in activated B cells treated with 10 mM HU. (Bottom panel) Composite plot for RPA ChIP at poly(dT) sites broken in activated B cells treated with 10 mM HU. (C) Composite plots showing the distribution of DSB ends at poly(dA) tracts in activated B cells treated with 0.5 mM HU. (D) Boxplots showing the distance between left and right DSB ends in activated B cells treated with 0.5 mM HU. Distances are divided into quartiles (box), with the line indicating the median. Median distances: wild-type (WT) = 328 bp; WT + mirin = 288 bp; 53BP−/− = 357 bp; 53BP1−/−+ mirin = 287 bp.
Figure 7.
Figure 7.. Poly(dA:dT) Tracts Are Associated with Replication Initiation
(A) Composite plots for nucleotide frequency, polynucleotide frequency, and nucleosome occupancy around 21,527 EdUhigh peaks in activated B cells. Poly(dN) is defined as a 20-bp window containing at least 75% dN. MNase-seq data are obtained from 72-hr activated B cells (Kieffer-Kwon et al., 2017). (B) (Left) Heatmap showing nucleosome occupancy (MNase-seq) centered on 21,527 EdUhigh peaks, sorted by nucleosome asymmetry around the EdUhigh peak. (Right) Heatmaps for total dT and dA frequency within 1 kb to the left or right of the EdUhigh peak. Higher frequency of dT (to the left of the EdUhigh peak) and dA (to the right of the EdUhigh peak) correlates with nucleosome depletion. (C) Histogram showing distributions of DNA DSBs, poly(dA:dT) tracts, and nsDNA relative to the summit of 21,527 EdUhigh peaks, for activated B cells treated with 10 mM HU. DNA DSB frequencies are coincident with increases in poly(dA:dT) tracts 100–1,000 bp downstream of EdUhigh peaks. Poly(dN) is defined as any 20-bp sequence with at least 75% dN.

Comment in

References

    1. Arlt MF, Ozdemir AC, Birkeland SR, Wilson TE, and Glover TW (2011). Hydroxyurea induces de novo copy number variants in human cells. Proc. Natl. Acad. Sci. USA 108, 17360–17365. - PMC - PubMed
    1. Arlt MF, Rajendran S, Birkeland SR, Wilson TE, and Glover TW (2012). De novo CNV formation in mouse embryonic stem cells occurs in the absence of Xrcc4-dependent nonhomologous end joining. PLoS Genet. 8, e1002981. - PMC - PubMed
    1. Aymami J, Coll M, Frederick CA, Wang AH, and Rich A (1989). The propeller DNA conformation of poly(dA).poly(dT). Nucleic Acids Res. 17, 3229–3245. - PMC - PubMed
    1. Barlow JH, Faryabi RB, Callén E, Wong N, Malhowski A, Chen HT, Gutierrez-Cruz G, Sun HW, McKinnon P, Wright G, et al. (2013). Identification of early replicating fragile sites that contribute to genome instability. Cell 152, 620–632. - PMC - PubMed
    1. Barnes RP, Hile SE, Lee MY, and Eckert KA (2017). DNA polymerases eta and kappa exchange with the polymerase delta holoenzyme to complete common fragile site synthesis. DNA Repair (Amst.) 57, 1–11. - PMC - PubMed

Publication types