. 2018 Aug 23;174(5):1229-1246.e17.
doi: 10.1016/j.cell.2018.07.007. Epub 2018 Aug 2.

Sensory Neuron Diversity in the Inner Ear Is Shaped by Activity

Affiliations

Sensory Neuron Diversity in the Inner Ear Is Shaped by Activity

Brikha R Shrestha et al. Cell. .

Abstract

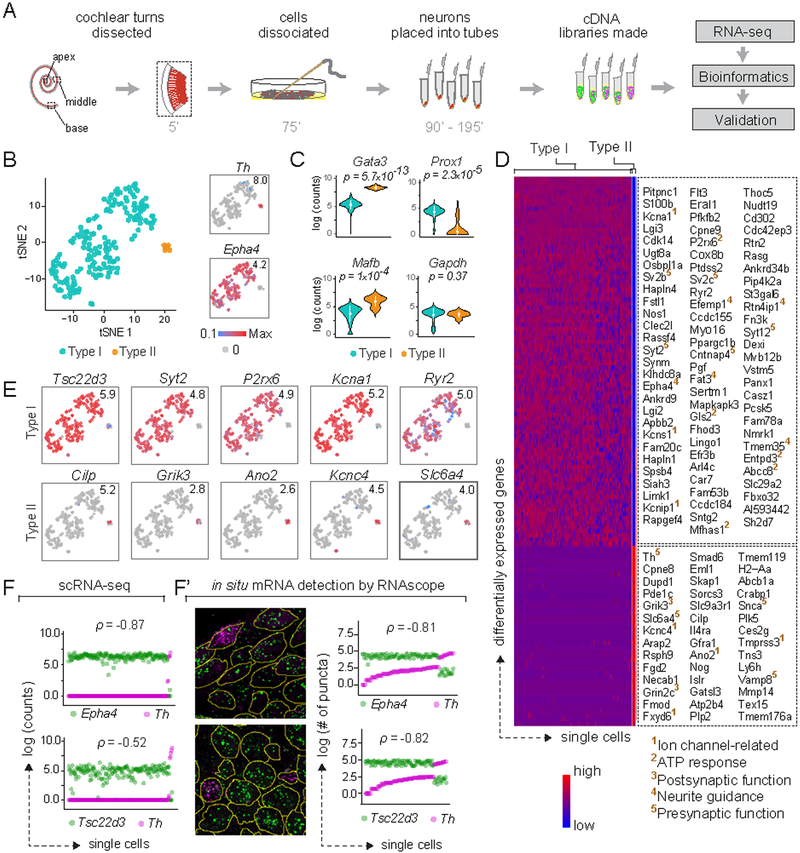
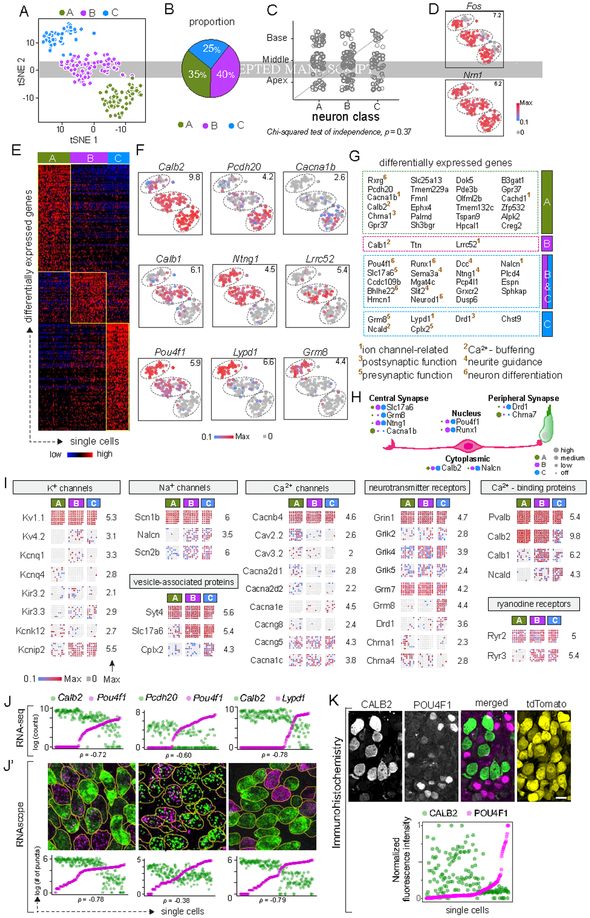
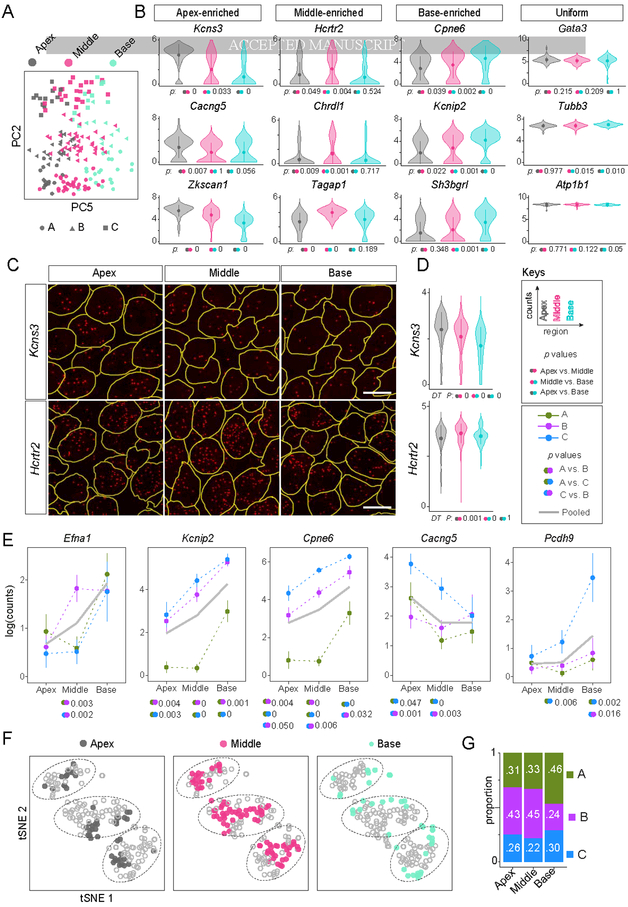
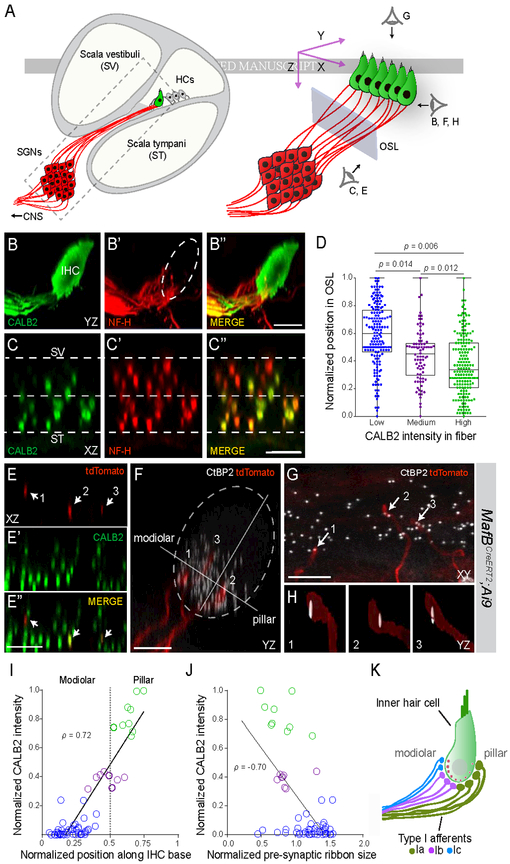
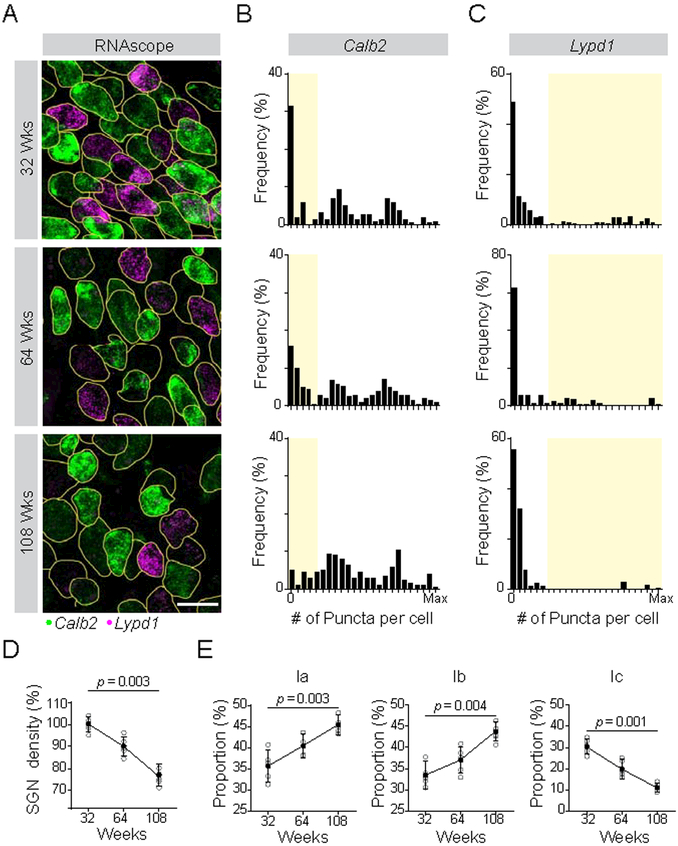
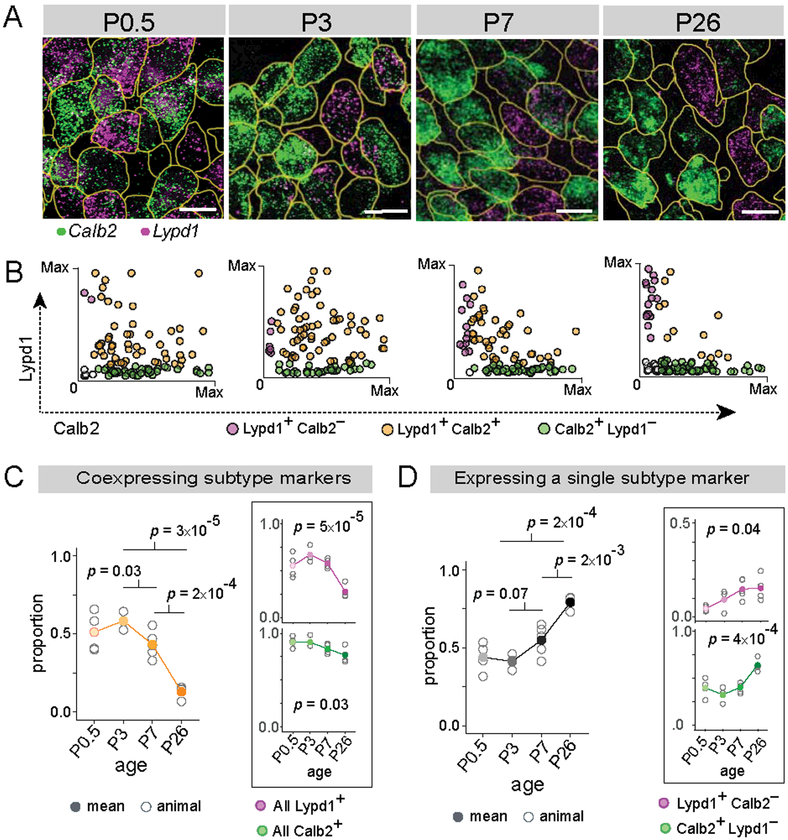
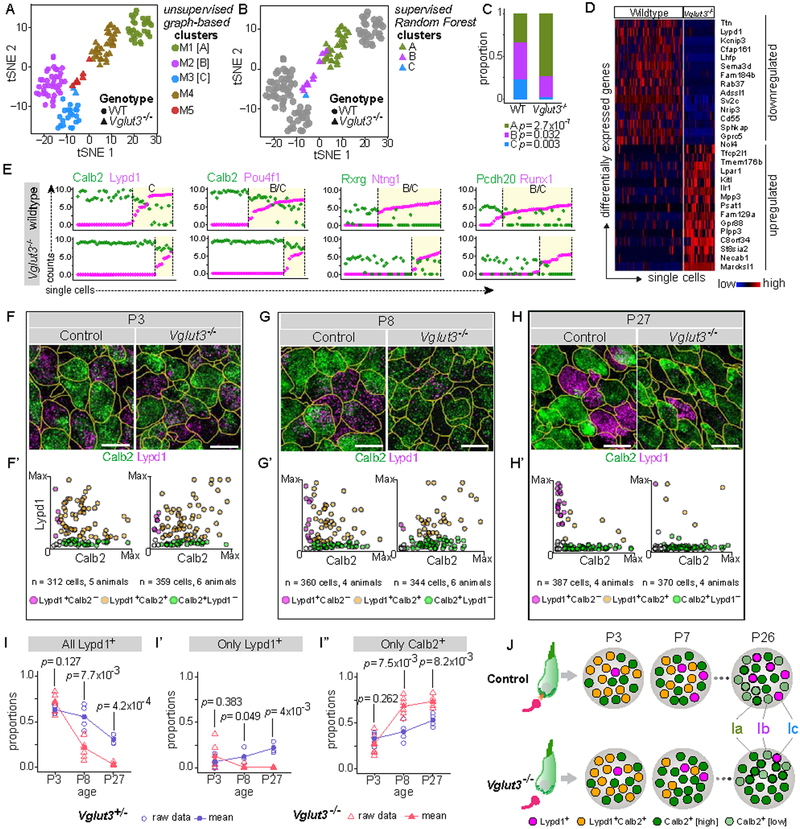
In the auditory system, type I spiral ganglion neurons (SGNs) convey complex acoustic information from inner hair cells (IHCs) to the brainstem. Although SGNs exhibit variation in physiological and anatomical properties, it is unclear which features are endogenous and which reflect input from synaptic partners. Using single-cell RNA sequencing, we derived a molecular classification of mouse type I SGNs comprising three subtypes that express unique combinations of Ca2+ binding proteins, ion channel regulators, guidance molecules, and transcription factors. Based on connectivity and susceptibility to age-related loss, these subtypes correspond to those defined physiologically. Additional intrinsic differences among subtypes and across the tonotopic axis highlight an unexpectedly active role for SGNs in auditory processing. SGN identities emerge postnatally and are disrupted in a mouse model of deafness that lacks IHC-driven activity. These results elucidate the range, nature, and origins of SGN diversity, with implications for treatment of congenital deafness.

Keywords: Vglut3; activity-dependent development; auditory; neuron heterogeneity; neuronal subtypes; single-cell RNA-seq; spiral ganglion neurons; spontaneous activity.


Conflict of interest statement

Declaration of Interests

The authors declare no competing interests.

Figures

Figure 1:
Figure 1:. Type I and II SGNs can be detected as molecularly distinct cell populations using scRNA-seq.
(A) Workflow for single cell RNA-seq (scRNA-seq) of spiral ganglion neurons (SGNs). Numbers indicate time elapsed (in minutes) since animal euthanization. (B) t-stochastic neighbor embedding (tSNE) of neuronal profiles (n = 186, 11 P25–P27 animals) revealed several clusters. Clusters of Type I (blue) and II (orange) SGNs were identified by expression of Epha4 and Th, respectively (insets). In this and all subsequent plots, numbers in the upper right corner indicate highest expression (Max) observed for each gene. (C) Violin plots comparing gene expression among Type I and II SGNs illustrate increased expression of Gata3 and Mafb in Type II SGNs (p = 5.7×10⁻¹³ and 1×10⁻⁴, respectively), and of Prox1 in Type I SGNs (p = 2.3×10⁻⁵), with no difference in expression of the housekeeping gene Gapdh (p = 0.37). White dot and bar indicate mean and standard deviation, respectively. (D) Heat map showing genes expressed differentially between Type I and II SGNs, with examples of Type I-enriched (top panel) and Type II-enriched (bottom panel) genes listed on the right. Superscripted numbers indicate gene functional groups annotated manually. (E-F) Several genes exhibit binary ON/OFF expression between the two subtypes (E), with clear correspondence between scRNA-seq (F) and RNAscope (F’) quantification in P25–P27 tissue sections for Epha4 and Th, as well as the novel Type I marker Tsc22d3. In images showing RNAscope puncta (F’), SGN cell bodies are outlined in yellow as visualized by immunostaining for parvalbumin (not shown). In scatterplots (F, F’), the two dots in each column indicate counts for two different genes in the same neuron, and neurons are sorted along the X-axis by the level of the gene in magenta. p represents Pearson’s correlation coefficient. See also Fig. S1.
Figure 2:
Figure 2:. Three molecular subtypes of Type I SGNs exist in the mouse inner ear.
(A-B) tSNE embedding of Type I SGN transcriptomes (A) depicting three clusters — A, B, C — predicted by graph-based clustering, which are indicated by dot color. Overall proportions are illustrated in B. (C-D) SGN subtypes are present in all regions of the cochlea (C) and show expression of the activity-induced genes Fos and Nrn1 in all clusters (D). (E-G) The clusters exhibit broad differences in their transcriptomes, illustrated in a heat map for the top 100 differentially expressed genes (E) and in tSNE plots for individual genes that show subtype-specific expression patterns (F). Numbers in the upper right corner indicate highest expression (Max) observed for each gene. (G) Genes enriched across the three subtypes encode proteins associated with many aspects of neuronal differentiation and function. Superscripted numbers indicate gene functional groups annotated manually. (H) Examples of differentially expressed genes that encode proteins localized to different neuronal compartments, indicating that input and output properties vary among SGNs. For each gene, expression level among SGN subtypes is indicated by the size of each colored dot. (I) Expression of select genes relevant to neuronal physiology is illustrated in dot matrix plots of individual libraries, which are grouped by subtype. Some genes are expressed uniformly across all libraries (top row for each group), whereas others vary across subtypes (all other rows). Numbers on the right indicate the highest expression (Max) observed for each gene. (J-K) Differentially expressed genes identified by scRNA-seq (J) showed the same patterns of expression in individual SGNs analyzed by RNAscope of P25–P27 tissue sections (J’). SGN cell bodies are outlined in yellow as visualized by immunostaining for parvalbumin (not shown). Similarly, immunostaining (K) for CALB2 (calretinin) (green), POU4F1 (magenta) and tdTomato (yellow) in tissue sections of P25–P27 bhlhb5Cre/+: Ai14/+ mice revealed inverse gradients of CALB2 and POU4F1 expression, quantified below. In scatterplots (J, J’, K), the two dots in each column indicate expression levels of two different markers in the same neuron, and neurons are sorted along the X-axis by the level of the gene in magenta. Scale bars: 10 μm (K). See also Fig. S1, S2, S3.
Figure 3:
Figure 3:. Type I SGNs exhibit both broad and subtype-specific tonotopic differences.
(A) Molecular heterogeneity exists along the tonotopic axis of the cochlea. Projection of single cell transcriptomes onto principal component analysis (PCA) space shows that PC2 reflects differences among the A, B, C subtypes while PC5 captures heterogeneity that corresponds to tonotopic origin. (B) Violin plots illustrate examples of genes that show either differential or uniform expression across the three tonotopic regions. Dunn’s test was used to assess significance for each possible comparison, as indicated by colored dots next to p values. See Keys. (C-D) Regional differences in expression of Kcns3 and Hcrtr2 were confirmed by RNAscope of P25 tissue sections (C), quantified in D. (E) Further analyses of scRNA-seq data revealed that some genes exhibit regional variation in a subtype-specific manner. Trends for all SGNs are shown in grey solid lines and for Ia (green), Ib (purple) and Ic (blue) SGNs in dashed lines. Error bars represent SEM. Pairs of dots indicate p values for comparisons across tonotopic regions by Tukey’s HSD test if the data were normally distributed and Dunn’s test otherwise. P values are reported only for statistically significant differences. (F) SGN subtypes are present in all regions of the cochlea, as revealed by tSNE plots showing the anatomic origin of cells (apex, middle, base) in each cluster. However, the proportions differ in the basal turn of the cochlea compared to the apex and the middle (G). Scale bars: 10 μm (C). See also Fig. S4.
Figure 4:
Figure 4:. Type I SGN peripheral processes and synapses are anatomically segregated by subtype.
(A) Schematic depicting a cross-section of the cochlea (left) with a magnified view of the boxed area on the right. The three perspectives corresponding to the cochlear wholemount images in BH are indicated (right). Blue rectangle represents the plane of section through confocal image stacks of afferent fibers (red) extending through the osseous spiral lamina (OSL) to terminate along the basolateral surface of the hair cell (HC) (green). (B-C) Side (B) and cross-sectional (C) views of a wholemount cochlea stained for CALB2 (green, B,C) and NF-H (neurofilament heavy chain) (red, B’,C’), with merged images (B”,C”). CALB2+ fibers preferentially project towards the pillar side of the inner hair cell (IHC) compared to the total population of all NF-H+ SGN processes and are segregated along the scala vestibuli (SV)-scala tympani (ST) axis in the OSL (C-C”). CALB2 antibody also labels IHCs. (D) Quantification of afferent fiber distribution in the OSL. CALB2 fluorescent intensity levels were measured for all NF-H+ fibers in the OSL cross-section (n = 5 animals). Fibers were split into three groups based on CALB2 levels: ‘low CALB2’ (n = 165 fibers), ‘medium CALB2’ (n = 82 fibers), and ‘high CALB2’ (n = 174 fibers). Distance from the median center of each nerve bundle was calculated for individual fibers from each cluster. P values indicate results of Tukey’s HSD test following one-way ANOVA. (E-H) Individual tdTomato-labeled fibers (red) (E, E”) were traced in cochlear wholemounts from MafbCreERT2;Ai9 animals that were also stained for CALB2 (green, E’, E”) to assign subtype identity. Presynaptic ribbons were defined by co-staining for CtBP2 (white, F-H). In this example, three individual tdTomato-labeled SGN fibers (arrows) express ‘high’ (2), ‘medium’ (3), and ‘low’ (1) levels of CALB2 as they project through the OSL (E, E”). The same three fibers segregate along the modiolar-pillar axis of the IHC, shown in side view in F. Each tdTomato-labeled fiber terminates opposite a single presynaptic ribbon, shown in high resolution reconstructions (H). (I-J) Quantification of all analyzed fibers (n = 61, 5 animals) revealed that both fiber position (I; p = 0.72) and ribbon size (J; p = −0.70) correlate with CALB2 intensity. (K) Type Ia (green), Ib (purple), and Ic (blue) SGNs extend peripheral processes that are segregated in the OSL and along the modiolar-pillar axis of the IHC where they are apposed by presynaptic ribbons that decrease in size along the same axis. These features match those described for high, medium, and low SR SGNs. Scale bars: 10 μm (B, C, E, F); 5 μm (G). See also Fig. S5.
Figure 5:
Figure 5:. Type I SGN subtypes show differential vulnerability to age-related hearing loss.
(A) SGN subtype identity was assessed using RNAscope to quantify levels of Calb2 and Lypd1 transcripts at 32, 64 and 108 weeks, shown in representative tissue sections. (B-C) Histograms show the frequency distribution of Calb2 (B) and Lypd1 (C) mRNA levels for all analyzed SGNs at each age (n = 212 at 32 weeks (top), 175 at 64 weeks (middle), 155 at 108 weeks (bottom)). The Type Ic population, defined by low levels of Calb2 and high levels of Lypd1, is shaded in yellow. (D-E) SGN density (% relative to the 32 wk time point) decreases over time (D) and this loss is matched by a decrease in the proportion of Ic SGNs (E). Type Ia and Ib SGNs increase in proportion over the same time frame, indicating that loss of Ic SGNs likely accounts for the overall decrease in density. P values indicate results of Dunn’s test following one-way ANOVA for 5 animals. Scale bar: 10 μm (A). See also Fig. S6.
Figure 6:
Figure 6:. Type I SGN subtypes emerge gradually over the first postnatal week.
(A-B) Representative images of Calb2 (green) and Lypd1 (magenta) mRNA detected using RNAscope in tissue sections of cochlea at various developmental stages (A). Scatterplots (B) show expression levels of Calb2 alone (green), Lypd1 alone (magenta) or both markers (orange) in individual SGNs (n = 100 randomly selected cells at each time point). (C-D) Over time, the proportion of cells expressing both Calb2 and Lypd1 decreases (orange, B, C), shown also for expression of each gene individually (magenta and green, insets). In parallel, there is an increase in the proportion that express a single subtype marker (D), shown for the whole population (black), as well as separately for Lypd1+ only SGNs (magenta, inset) and Calb2+ only SGNs (green, inset). Means are shown in solid dots, with raw data from each individual animal in open circles. P values indicate results of Tukey’s HSD test (left) and one-way ANOVA (right, inset). Scale bars: 10 μm (A).
Figure 7:
Figure 7:. SGN heterogeneity is altered in a mouse model of congenital deafness.
(A) tSNE embedding of single cell transcriptomic profiles from wildtype (WT, circles) and Vglut3−/− (triangles) animals, with 5 distinct clusters (M1–M5) predicted by graph-based unsupervised clustering indicated by color. M1, M2 and M3 correspond to WT Ia, Ib, and Ic SGNs, respectively, whereas M4 and M5 consist of SGNs from Vglut3−/− animals. (B) Subtype identities of neurons from Vglut3−/− animals were assigned using supervised clustering by the Random Forest method. WT cells are shown in grey, and cells from Vglut3−/− animals are shown in colors corresponding to their predicted subtype identities. Cluster M4 (brown, A) consists of Type Ia-like SGNs (green, B), whereas the remaining neurons in cluster M5 (red, A) are either more like Type Ib (purple, B) or Type Ic (blue, C) SGNs. (C) Subtype proportions are significantly altered in Vglut3−/− animals compared to WT, with a dramatic loss of Ic SGNs. P values indicate results of Test of Equal Proportions between Ia, Ib, and Ic subtypes in the two genetic backgrounds. (D-E) SGNs from WT and Vglut3−/− animals show broad differences in gene expression reflective of a shift from Ic to Ia identity, shown both in a heatmap (D) and in scatterplots (E) of the level of expression of Ia (Calb2, Rxrg, Pcdh20) and Ib/Ic (Lypd1, Pou4f1, Ntng1, Runx1) subtype markers (WT, top; Vglut3−/−, bottom). Yellow shading marks cells belonging to B/C or C clusters. (F-H) RNAscope of tissue sections from P3 (F), P8 (G), and P27 (H) WT (left) and Vglut3−/− (right) animals shows that expression of Calb2 (green) and Lypd1 (magenta) initiates normally at P3, quantified in F’. However, the proportion of Lypd1+ SGNs is decreased at P8 (G’), and there are almost no Lypd1+ SGNs remaining at P27 (H’). Scatterplots (F’-H’) show individual cells expressing Calb2 alone (green), Lypd1 alone (magenta) or co-expressing both markers (orange). (I-I”) Proportions of SGNs in control (blue circles) and Vglut3−/− (red triangles) animals that express any Lypd1 (I), that express only Lypd1 (I’), or that express only Calb2 (I”). Means shown in solid symbols, with raw data from individual animals in open symbols. P values refer to results of independent samples t-test between the two genetic backgrounds at each time point. (J) Schematic showing developmental emergence of mutually exclusive expression between Calb2 and Lypd1. In Vglut3−/− animals, in which glutamate release from IHCs is abolished, Lypd1+ SGNs are severely underrepresented compared to control animals, beginning after P3, resulting in overabundance of Ia SGNs by the fourth postnatal week. See also Fig. S7. Scale bars: 10 μm (F-H).

Comment in

  • Auditory advances.
    Whalley K. Whalley K. Nat Rev Neurosci. 2018 Oct;19(10):579. doi: 10.1038/s41583-018-0052-x. Nat Rev Neurosci. 2018. PMID: 30111776 No abstract available.

References

    1. Abraira VE, and Ginty DD (2013). The sensory neurons of touch. Neuron 79, 618–639. - PMC - PubMed
    1. Adamson CL, Reid M. a., Mo ZL, Bowne-English J, and Davis RL (2002). Firing features and potassium channel content of murine spiral ganglion neurons vary with cochlear location. J. Comp. Neurol 447, 331–350. - PubMed
    1. Appler JM, Lu CC, Druckenbrod NR, Yu W-M, Koundakjian EJ, and Goodrich LV (2013). Gata3 Is a Critical Regulator of Cochlear Wiring. J. Neurosci 33, 3679–3691. - PMC - PubMed
    1. El Barbary A (1991). Auditory nerve of the normal and jaundiced rat. I. Spontaneous discharge rate and cochlear nerve histology. Hear. Res 54, 75–90. - PubMed
    1. Berglund AM, and Ryugo DK (1987). Hair cell innervation by spiral ganglion neurons in the mouse. J. Comp. Neurol 255, 560–570. - PubMed

Publication types

Substances