. 2018 Aug 9;174(4):968-981.e15.
doi: 10.1016/j.cell.2018.07.010. Epub 2018 Aug 2.

Deep Profiling of Mouse Splenic Architecture with CODEX Multiplexed Imaging

Affiliations

Deep Profiling of Mouse Splenic Architecture with CODEX Multiplexed Imaging

Yury Goltsev et al. Cell. .

Abstract

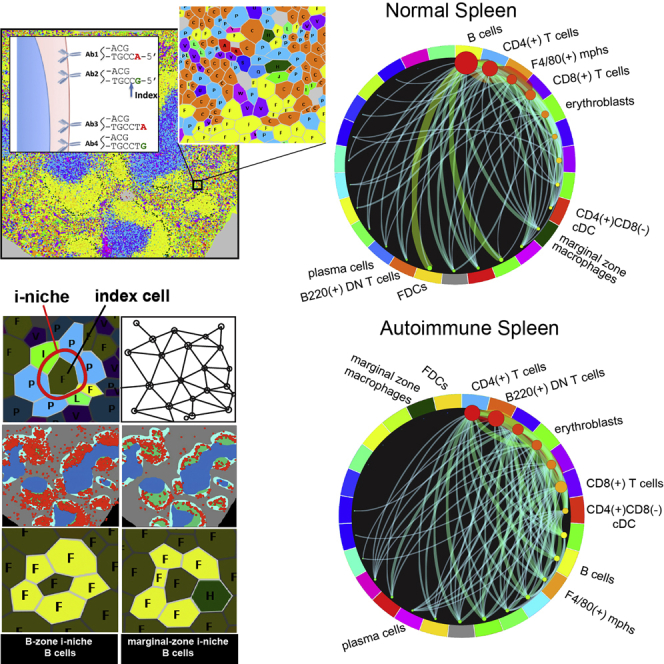
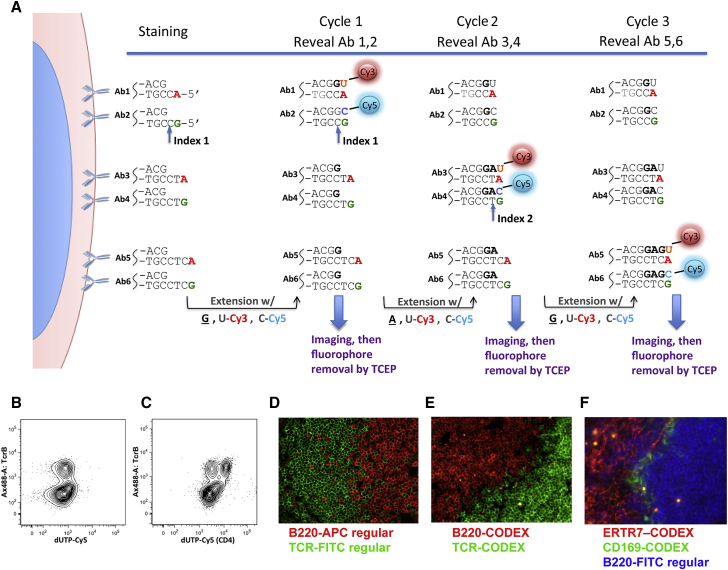
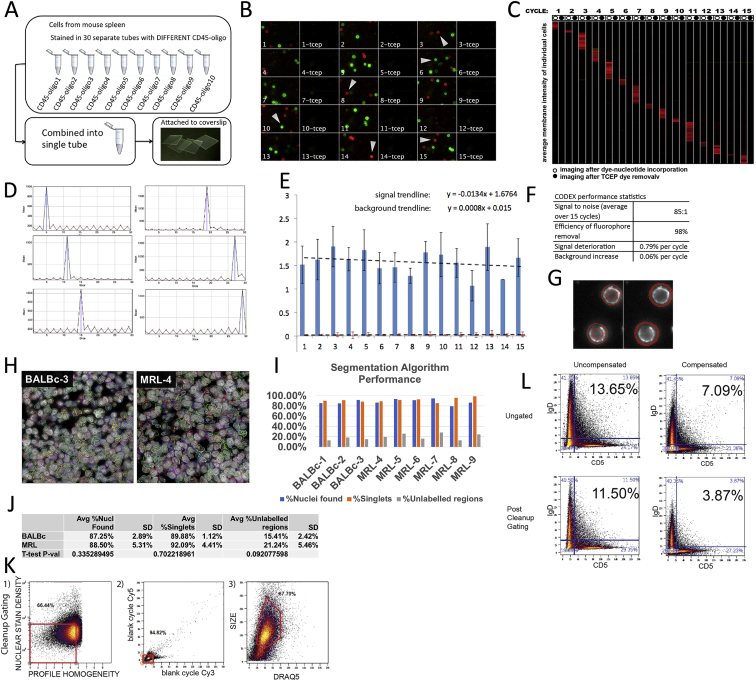
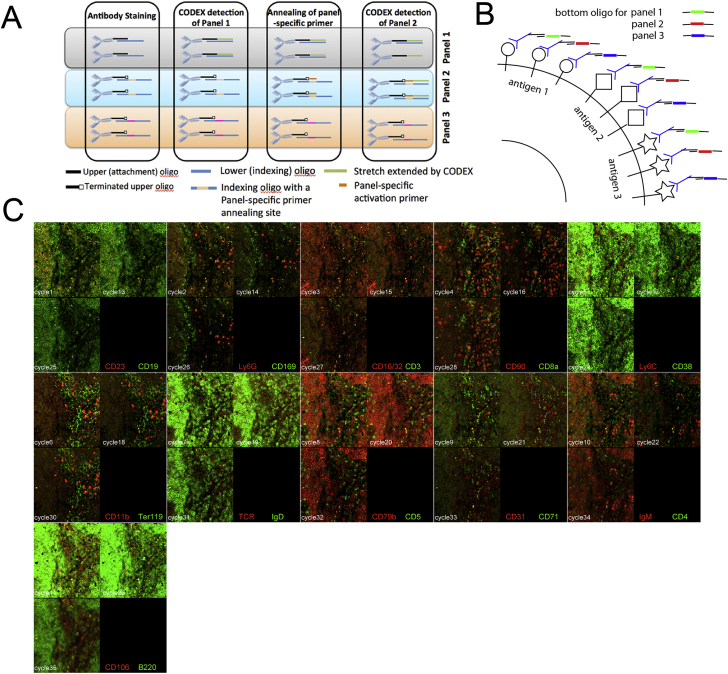
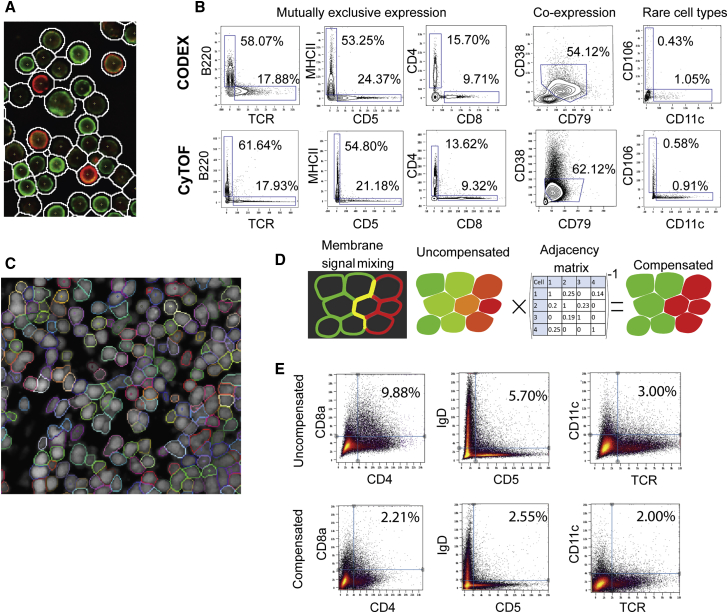
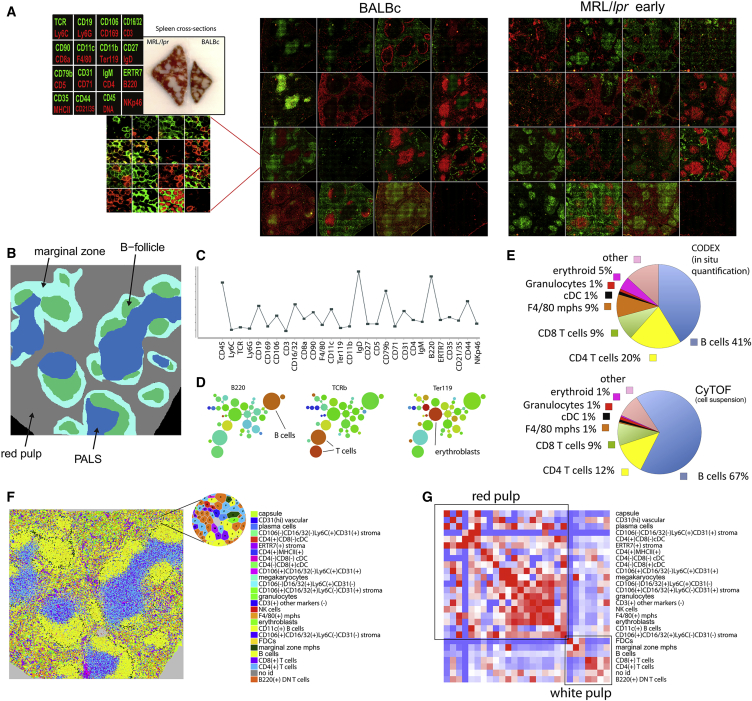
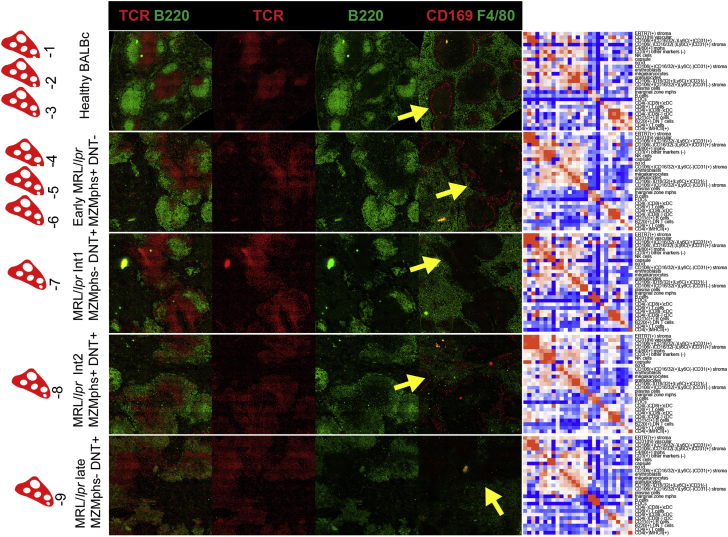
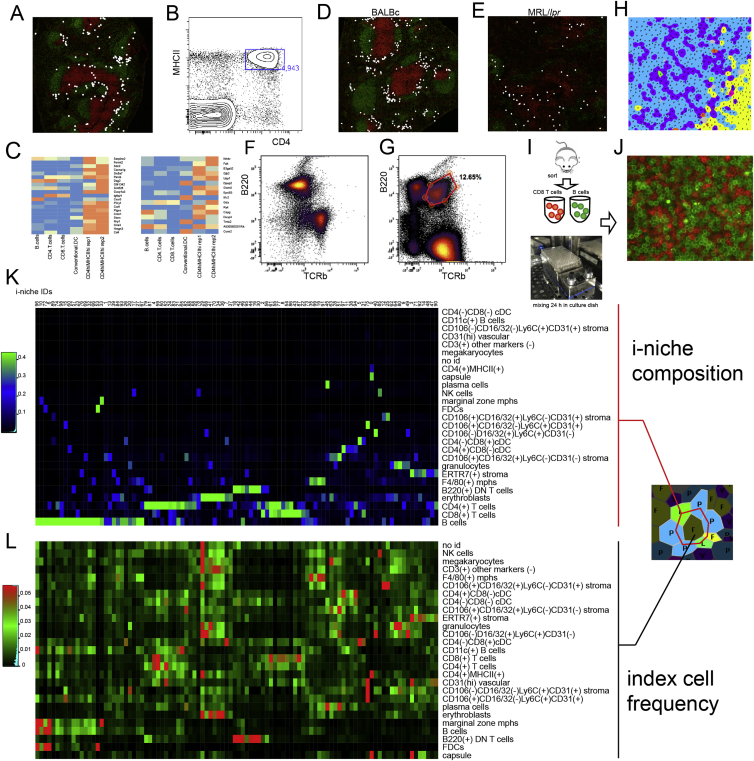
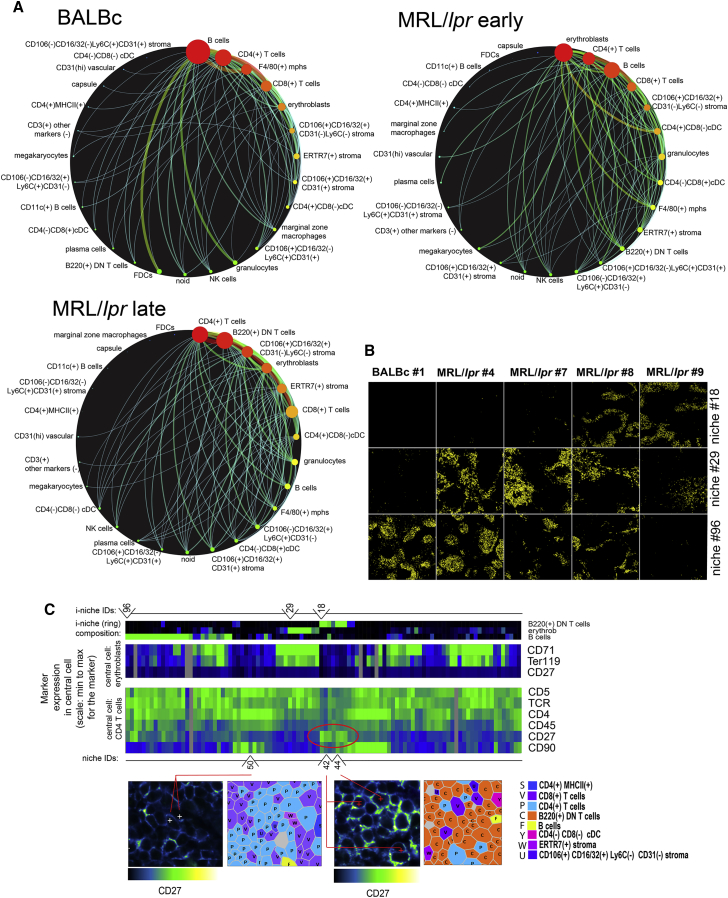
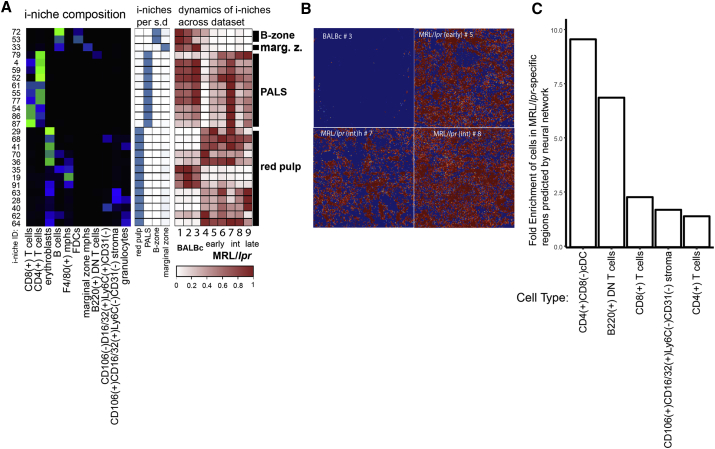
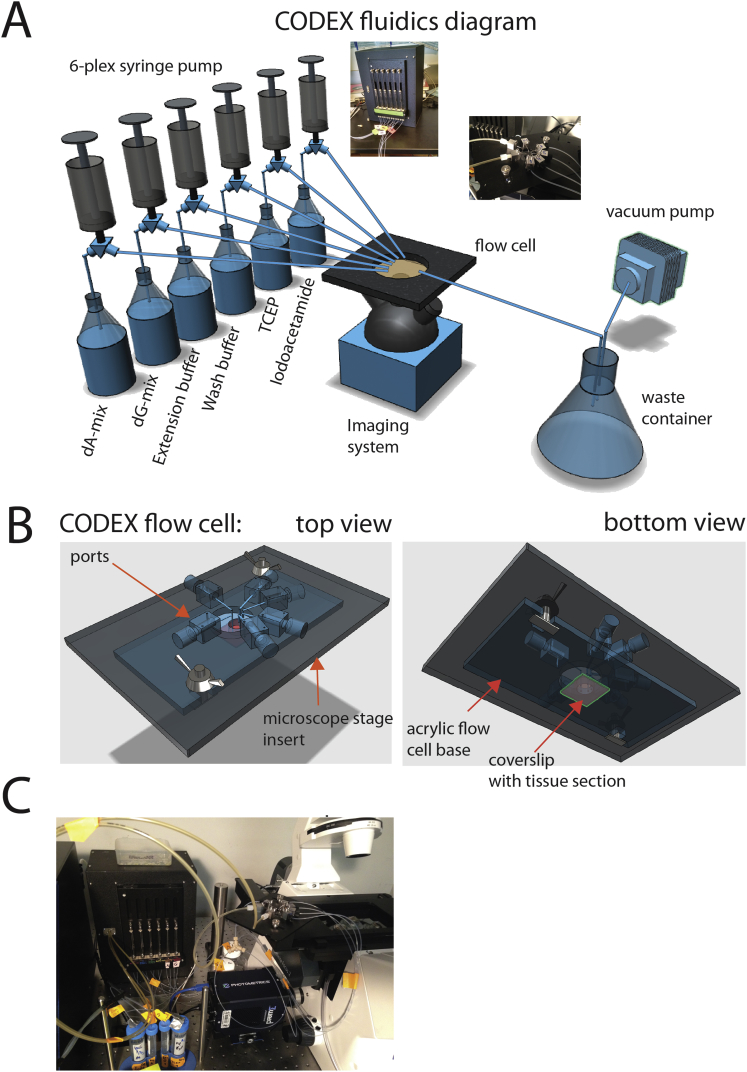
A highly multiplexed cytometric imaging approach, termed co-detection by indexing (CODEX), is used here to create multiplexed datasets of normal and lupus (MRL/lpr) murine spleens. CODEX iteratively visualizes antibody binding events using DNA barcodes, fluorescent dNTP analogs, and an in situ polymerization-based indexing procedure. An algorithmic pipeline for single-cell antigen quantification in tightly packed tissues was developed and used to overlay well-known morphological features with de novo characterization of lymphoid tissue architecture at a single-cell and cellular neighborhood levels. We observed an unexpected, profound impact of the cellular neighborhood on the expression of protein receptors on immune cells. By comparing normal murine spleen to spleens from animals with systemic autoimmune disease (MRL/lpr), extensive and previously uncharacterized splenic cell-interaction dynamics in the healthy versus diseased state was observed. The fidelity of multiplexed spatial cytometry demonstrated here allows for quantitative systemic characterization of tissue architecture in normal and clinically aberrant samples.

Keywords: CODEX; autoimmunity; immune tissue; microenvironment; multidimensional imaging; multiplexed imaging; niche; tissue architecture.


Figures

None
Graphical abstract
Figure 1
Figure 1
Sequential Primer Extension on Samples Stained with DNA-Barcoded Antibodies Enables Unlimited Level of Multiplexing (A) CODEX schematic diagram. (B and C) Mouse spleen cells were fixed and co-stained with conventional TCR-β Ax488 antibody and CD4 antibody conjugated to CODEX oligonucleotide duplex as in first round of (A). After staining, cells were incubated in extension buffer with dG and dUTP-Cy5 either without (B) or with (C) Klenow exo- polymerase. Note that TCR-β-positive T cells in (B) and (C) are indicated by Ax-488 staining. Dependent upon the addition of Klenow, TCR-β-positive CD4 positive T cells are seen as a Cy5 positive subset of TCR-β-positive T cells in (C). (D) Spleen cryosection stained with B cell-specific B220-APC (red) and T cell-specific TCR-fluorescein isothiocyanate (FITC) (green) show mutually exclusive staining pattern in the marginal area between B cell follicle and the white pulp. (E) Spleen cryosection stained with CODEX DNA-tagged B220 (red) and CODEX DNA-tagged TCR-β (green) shows staining similar to the one observed with regular antibodies in (D). (F) Spleen sections were co-stained with regular B220-FITC and two antibodies (ERTR7 and CD169) tagged with cycle 1 CODEX DNA duplexes. Localization of marginal zone CD169 positive macrophages in the area between the ERTR7 positive splenic conduit of the white pulp and the B220 positive follicular B cells (D) as reported previously has been observed. See also Figure S1 and Video S1, part 1.
Figure S1
Figure S1
Benchmarking CODEX, Related to Figures 1 and 2 (A) Experimental scheme for mimicking the tissue with 30 distinct cell types. (B) Montage of a fragment of imaging field of the 15 cycles of CODEX used to render the mix of 30 barcoded spleens – first cycle top left last cycle bottom right. (C) Heatmap (cycles in columns, cells in rows) showing mean fluorescence per cell membrane for each cell per in each of the 15 CODEX cycles performed on cells of 30 barcoded spleens. Odd columns correspond to imaging after labeled base incorporation. Even columns correspond to imaging after inactivation of staining by TCEP. (D) Time-lapse profile of median intensity per cell membrane for individual cells marked by white arrows on (B). (E) Average intensity of CD45 antigen expression in “positive” (blue columns) and “negative” (red columns) cells in 15 CODEX cycles of the experiment. (Similar results were obtained for Cy3-positive populations – data not shown). Linear regression was performed to indicate trends in accumulation of background and signal decline associated with cycle number. (F) Table summarizing CODEX performance stats. Average signal to noise ratio was estimated from ratio of average signal of all positive cells across all cycles to the signal of all “negative” cells across all cycles. Efficiency of fluorophore removal was estimated from average ratio of ([signal after TCEP in cycle N]- [signal after TCEP in cycle (N-1)])/[signal in cycle N] for cells positive in cycle N across all cycles. Average expected signal deterioration was estimated using the trendline equation from (E). Average background accumulation was estimated by fitting linear trendline into the per cycle ratio of average background to average signal (not shown). (G) Image quantification approach used on CODEX data from (A): best focal planes of CODEX stacks were segmented by Cell Profiler. To account for local background the value corresponding to difference between the mean intensity value inside “cell membrane” object (left panel) and the mean intensity inside the external ring object (right panel) was chosen as a representation of the intensity of the antibody signal. In all other experiments custom (see STAR Methods) segmantation developed in this study was used. (H) Sample 500x500 px regions from two samples (BALBc-3 and MRL-4) showing hand-labeled cell centers (yellow crosshairs) and cell outlines detected by the segmentation algorithm (randomly colored). (I) Comparison between the hand-labeled cell identification and algorithm-based algorithm identification, expressed in 3 measures: %Nuclei found (how many of the hand-labeled nuclei centers ended up inside the segmented regions), % Singlets (how many of the cell regions with at least one hand-labeled nuclei center contained exactly one cell center) and %Unlabelled regions (how many segmented regions did not contain a hand-labeled cell center). (J) Summary statistics comparing the segmentation quality between BALBc and MRL/lpr samples. (K) Three step cleanup gating strategy based on 1) stain density (nuclear signal divided by cell size) and profile homogeneity (relative variance of signal from cycle to cycle), 2) removing objects with high background by gating on the signal accrued in “blank”(no stain) cycles 3) constraining the cell size. (L) Percentage of artifactual double-positive cells in CODEX data from sample BALBc-2 (as seen in the upper right quadrant biaxial flow style plots of mutually exclusive lineage markers IgD and CD5) depending on gating and spill compensation.
Figure S2
Figure S2
Expanding the Multiplexing Limit of CODEX by “Panels and Activators” Design, Related to Figure 1A and STAR Methods (A) Diagram of “multipanel”/”activator oligo” CODEX approach. The list of antibodies can be divided in sets such that number of antibodies in each individual set does not exceed the capacity of the multiplexing protocol to render staining without significant signal loss (e.g.30). Each such set of antibodies will be conjugated to “terminated” (the last 3′ base is dideoxy- or propyl- modified) upper strand oligonucleotide of the same sequence as in the original version of the “missing base” approach. The lower strand oligonucleotides will incorporate an additional set-specific region, which will serve as a landing spot for the dedicated primer oligo which is to be on-slide hybridized to the particular subset of the total plurality of the antibodies at the time when they are to be rendered. This approach prevents extension of reads beyond certain threshold and at the same time have an unlimited potential number of antibodies in the sample. (B) Schematics of experiment demonstrating the “activator” method and its robustness. Each antigen of a set of 22 surface markers is redundantly detected by three CODEX tag conjugates of the same antibody. The first conjugate is detected during panel 1 rendering, second – during panel 2 etc.. Thus the signal for same antigen is detected at different cycles (e.g., 1st, 13th, and 24th). (C) Montage of a fragment of imaging field of the 36 cycles of CODEX used to render a mixture of 18 barcoded spleens (similar to design in Figure 2A). Cycles N,N+12 and N+24 all three of which render same pair of antigens are shown per tile for all 11 pairs of antigens (see annotation in the black rectangle of each tile).
Figure 2
Figure 2
Accuracy of Surface-Marker Quantitation by CODEX (A) Microscopic image of mouse splenocytes stained with a 24-color antibody panel, showing one cycle of CODEX antibody rendering. Cell contours show the outlines produced by the cell segmentation algorithm (B) Comparison of single-cell expression data derived from dissociated mouse splenocytes on an identical 24-color panel using CODEX and CyTOF. (C) Example segmentation in a mouse spleen section based on combining nuclear and membrane (CD45) channel. (D) Graphical explanation of the algorithm for compensating the spillover between neighboring cells using a cell-by-cell compensation matrix. (E) Biaxial plots of segmented CODEX data acquired in mouse (BALBc) spleen sections. The presence of double-positive cells in the upper quadrant is used as an estimate of lateral signal bleeding explained schematically in (D). Three combinations of mutually exclusive lineage markers are shown to demonstrate the range of effect of the compensation algorithm on reduction of lateral signal bleed. See also Figures S4 and S5.
Figure 3
Figure 3
CODEX Analysis of Mouse Spleen Cryosections Co-stained for 28 Antigens (A) Three collated images on the left correspond to the legend of antibody renderings per cycle, gross morphology photograph of MRL/lpr (left), and normal (right) spleen embedded in optimal cutting temperature (OCT) block prior to sectioning. Green corresponds to antibodies rendered by extension with dUTP-Cy5; red, dCTP-Cy3 On the right, collage of the CODEX multicycle data for normal spleen (BALBc-2) and early MRL/lpr spleen (MRL/lpr −4). All images are derived from a single scan with a 40× oil objective of an area covered by 63 tiled fields. (B) Schematic diagram of major known splenic anatomical subdivisions drawn based on cell distribution in BALBc-1 replicate. (C) An exemplary profile of Vortex cluster (B cells) used for manual matching of clusters to known cell types. (D) Minimal spanning tree (MSP) built for all clusters identified by Vortex analysis. On the left middle and right panels, the MSPs are colored by expression levels of B220, TCR, and CD71 accordingly to indicate location of B cells T cells and erythroblasts on the tree. (E) Circle chart showing for several major cell types their fraction of total cells as identified by CODEX analysis of splenic tissue and CYTOF analysis of isolated BALBc splenocytes (F) Post-segmentation-derived diagram of identified objects (cells) colored according to cell types in BALBc-1 replicate. Full-size diagrams for every tissue analyzed in this study are available online (see STAR Methods) (G) Average cell-type to cell-type interaction strength heatmap for BALBc samples. Color from blue (<0) to white (around 0) to red (>0) indicates log of odds ratio of interaction (ratio of observed frequency versus expected frequency of interaction). The rows and columns are in the same order (annotation on the right). Black outlines indicate two largely exclusive mega-clusters of cross-interacting cell types loosely matching the cell types populating the red and the white pulp. See also Figure S5 and Video S2.
Figure S3
Figure S3
Types of Samples in MRL/lpr Dataset, Related to Figure 5 MRL/lpr dataset has 9 samples: 3 control wild-type BALBc spleens (BALBc −1,-2,-3 and 6 MRL spleens MRL −4,-5,-6,-7,-8,-9). Based on disintegration of marginal zone as measured by frequency of marginal zone macrophages (MZM’s, – see black asterisk on Figure 5B and yellow arrow in this figure pointing to the area where CD169 positive (red) rim of MZMs is expected to be observed) and accumulation of double negative T cells expressing B220 B cell marker (B220 DN T cells – see red asterisk on Figure 5B) MRL spleens were grouped into early (MRL −4,-5,-6), intermediate (MRL −7,-8), and late (MRL −9) types. Early stage was represented by 3 MZM positive DN T cell-low spleens. Two spleens represented the intermediate stage: MZM low DN T cell-low spleen (Int1) and MZM positive DN T cell-positive spleen (Int2). Late stage was represented by single MZM positive DN T cell-positive spleen. A single representative spleen is shown for each stage together with interaction matrix. Color represents odd ratios (observed frequency of interaction/ expected frequency of interaction).
Figure S4
Figure S4
CODEX Pinpoints Splenic Location of Unique Cell Types, Related to Figures 3–5 (A) Distribution of CD4(+)MHCII(+) cells (marked with white circles) in BALBc #2 spleen stained with IgD (green) and CD90 (red) to indicate positions of B and T cells accordingly. (B) CD4 and MHCII expression in isolated mouse splenocytes gated negative for all CODEX panel markers and in addition 120 g8 (lineage depletion with BD 558451 and dump channel for FITC conjugated or biotinilated antibodies corresponding to the antigens stained with CODEX panel were used for negative gating) except CD4, MHCII, CD45 and CD44. (C) CD4(+)MHCII(+) cells within the gate shown in (B) were sorted out and subjected to microarray analysis. CD4 T cells, CD8 T cells, bulk B cells and Conventional CD11c positive dendritic cells were co–sorted as a control. Expression of Lti signature genes (two individual signature sets as inferred in (Robinette et al., 2015)) in sorted cells. (D and E) CD11c+ B cells (age associated B cells (ABCs) in normal nd M/lpr spleens. ABCs have been shown to be a key participant in the triggering of certain autoimmune responses (Rubtsova et al., 2017, Rubtsov et al., 2011)) their splenic location has not been previously described in the literature. We observed ABCs to tightly associate with conventional dendritic cells (cDC) and occupy a distinct peri-follicular space in the boundary between PALS and B-zone. Interestingly, these cells diminished in numbers and redistributed toward intra-follicular space in the MRL/lpr spleens. (F and G) Co-distribution of B220 and TCRb in isolated splenocytes of normal (BALBc) and autoimmune (MRL/lpr) mice. Gate in (G) points to significant (∼13%) presence of B220+ DN T cells in MRL spleen. (H–J) Thread like arrangement of CD8 T cells (purple, annotated with V-letter) has been noticed in PALS of splenic samples across dataset. To examine potential mechanisms driving these structures CD8 Tells and B220 positive B cells were sorted individually from BALBc spleen (I) and later combined in flat bottom microwell plates and mixed at 37C in culture medium. After mixing cells were stained for B220 (green) and CD8a (red) and imaged (J). Thread like structures similar to what was observed in spleen were detected. (K) Heatmap showing average frequencies of cell types (rows of heatmap) in the ring of index cell neighbors (see schematics on the right) for all niche clusters (0-99 in columns). (L) Heatmap shows how different cell types (in rows) are distributed between niches (in columns).
Figure S5
Figure S5
“Cell Passports” of Selected Cell Types Identified in Normal and MRL Spleens, Related to Figures 3F and 5B (A) Diagram of per cycle markers for CODEX cycle montages in B,C and D. (B, E, and H) High resolution montage of CODEX cycles with cells of interest (CD11c(+) B cells) marked with yellow crosses is shown in (B). Low resolution montage of distribution of cells of interest (marked with white circles) in all imaged samples is shown in (E). Average expression profile of all markers in the cells of the selected cell type is shown in (H). (C, F, and I) Same for CD4(+)MHCII(+) cells. (D, G, and J) Same for CD106(+)CD16/32(-)Ly6C(+)CD31(+) cells. More examples of “cell passports” can be found in associated online repository (see STAR Methods).
Figure 4
Figure 4
Unbiased Identification of i-niches in Multidimensional CODEX Data (A) On the left diagram explaining the terminology used for defining i-niche (a ring of first tier neighbors for central cell). On the right Delaunay triangulation graph used for identification of first tier of neighbors for every cell. (B) Heatmap depicting frequency of cell types in 100 types of i-niches identified by K-means (K = 100) clustering of all index cells in the dataset (each cell is an index cell for its i-niche) based on frequency of different cell types in the first tier of neighbors. The color indicates the average fraction of corresponding cell type in the the i-niche. (C) An example of marginal zone and follicular (B-zone) B cells defined by residence in distinct i-niches (e.g., marginal zone i-niche includes a marginal zone macrophage marked by letter H and green color). Positions of B cells in each i-niche is marked with red circles over the schematic of BALBc spleen. (D and E) Two heatmaps from top to bottom show average expression of selected surface markers measured in a central cell across 100 i-niches (same left to right order as in B) when central cell is B cells (D) or CD4 T cell (E) accordingly. The color indicates the relative level of surface-marker expression as measured across dataset. Gray columns indicate absence of cells in corresponding niches. Two orange rectangles over top heatmap indicates position of i-niches with high CD35 (containing FDCs and marginal zone macrophages). Cyan rectangle shows location of family of i-niches with high content of F4/80 macrophages and low B220 and CD19 in central B cells. Purple rectangle indicates family of i-niches enriched with ERTR-7 positive stroma. Below top heatmap, location of selected i-niches shown in (E) are indicated. Over bottom heatmap, yellow rectangle indicates the family of i-niches with dominating presence of B cells. Two green rectangles indicate family of niches with high levels of CD90 and CD27 in the index CD4 T cells. (F and G) Abundance of 100 i-niches in normal spleen (top bar graph) (F) and relative distribution of i-niches (G) between splenic histological subdivisions (PALS, red pulp, marginal zone, and B-zone) shown as a heatmap. To illustrate a variety of tissue distribution pattern by i-niches an overlay of selected i-niches over a schematic of normal spleen (BALBc-1) is shown. Heatmap color indicates fraction of corresponding i-niche per splenic anatomic subdivision. (H) Top right shows a biaxial plot of flow data for CD79b and B220 measured in isolated splenocytes. Top left shows levels of CD79b and B220 in central B cells as measured across all 100 i-niches. To illustrate i-niche-dependent variability of surface-marker expression, images of central cells (marked with red cross) with levels of surface marker indicated in pseudocolor palette are shown for selected exemplary i-niches in the bottom panels. See also Figures S4K and S4L.
Figure S6
Figure S6
Cross-Tissue and Cross-Samples Distribution of Interacting Cell Pairs for Selected Types of Cell-to-Cell Interactions, Related to Figure 5C Interacting cell pairs are marked with white and cyan circles on the montage of IgD CD90 (B cell and T cell markers) staining of every sample of the dataset. Due to cell proximity in most cases cyan circles practically completely overlay white. (A and B) Interaction of CD4 and CD8 T cells with ERTR stroma (change in odds ratio score correlates with change in interaction count). (C–E) Interaction of granulocytes with CD4 T cells, dendritic cells and erythroblasts. (F and G) Interaction of erythroblasts with stromal and B220(+) DN T cells. Interactions in (C-G) scored as increased in early MRL/lpr (−4,-5,-6) as compared to BALBc spleens (FDR of t test on normalized interaction counts between conditions < 0.05, difference in interaction counts > 0). (H and I) Interactions of B220(+) DN T cells with CD8 T cells and stromal cells. These interactions scored as increased in intermediate and late MRL/lpr (−7,-8,-9) as compared to early MRL/lpr spleens (FDR of t test on normalized interaction counts between conditions < 0.05, difference in interaction counts > 0). More examples of cell type pairs with change in interactions across dataset can be found in associated online repository (see STAR Methods).
Figure 5
Figure 5
Autoimmune Disease Drives Changes in Splenic Composition and Cell-to-Cell Interactions (A) Post-segmentation diagrams of all objects (cells) colored according to cell types (see color map in Figure 3F) for all normal and MRL/lpr tissue sections imaged in the study. Full-size diagrams are available for every tissue analyzed in this study are available online (see STAR Methods). (B) Stacked bar graphs show dynamics of cell counts across dataset for manually annotated Vortex clusters (cell types on the left) across progression from normal to afflicted spleen. Colored bar sections indicate fraction of the total cells as detected at a particular stage/samples (1–9 annotation on the top). Cell types were split into four types according to the dynamics of counts across dataset as represented by average relative (normalized to 1) count; see line graphs on the right; x axis corresponds to stage/sample id. (C) Two examples of change in cell-to-cell interaction frequency during disease progression between the B cells and dendritic cells in normal and early MRL/lpr spleen and between B220+ DN T cells and CD4 T cells during progression from early MRL/lpr to intermediate. (D) Co-distribution of odds ratio log fold [log(odds ratio in early MRL/lpr) – log(odds ratio in BALBc)] on x axis and change in counts of interactions for early MRL/lpr versus control (BALBc) comparisons (on y axis). (E) Co-distribution of cumulative cell-frequency change [celltype1 freq. change + celltype2 freq. change] on x axis and change in counts of interactions for early MRL/lpr versus control (BALBc) comparisons (on y axis). (F) Bar graph showing chi-square values across conditions computed for odds ratio and direct interaction counts. See also Video S2 and Figure S6.
Figure 6
Figure 6
Differential Effect of Disease over i-niche Presence across Dataset (A) Cell-interaction networks built for BALBc early MRL/lpr and late MRL/lpr based on the number of contacts observed between two cell types (only connections with more then 150 interactions per sample are shown on the diagrams). Thickness of connection correlates with number of contacts size of the node indicates number of cells per condition. (B) Evolution of i-niche abundance across dataset. Selected three i-niches (marked above heatmap in C depicting i-niche composition) differentially represented across dataset (changing between norm and disease) are shown. Yellow circles overlaid over blank rectangles corresponding to imaged area indicate location of i-niche. (C) Top heatmap shows frequencies of B220+ DN T cells, erythroblasts, and B cells in the i-niche rings. Line above top heatmap indicates the composition of i-niches 18, 29, and 96 described in (B). Color scheme is the same middle heatmap and indicates expression of selected markers when the i-niche central cell is an erythroblast—primarily to show that CD27 is not expressed on erythroblasts in the vicinity of B220+ DN T cells. Bottom heatmap indicates expression of selected markers when the i-niche central cell is a CD4 T cell. The color schemes in these three heatmaps are the same as in heatmaps in Figures 4B, 4D, and 4E. Red oval outline pinpoints i-niches with elevated CD27. Note that these i-niches as indicated by top heatmap have B220+ DN T cells as a prevailing component. Lower panels show examples of central cells in i-niches marked under the lower heatmap. i-niche 50 is an example of i-niche without B220+ DN T cells. Central cell does not express high CD27. i-niches 42 and 44 have high frequency of B220+ DN T cells and accordingly central cells express high CD27. See also Figures S4K and S4L.
Figure 7
Figure 7
i-niches and Neural Nets Provide Unbiased Way for Disease Monitoring (A) Selected i-niches (green heatmap shows i-niche composition, color scheme same as in Figure 4B) were chosen based on high (>90%) presence per single histological subdivision (blue heatmap color scheme same as in Figure 4G). Abundance of these i-niches (brown heatmap, color indicates relative abundance of corresponding i-niche as measured across full dataset) was used to judge the preservation or decay of a histological splenic subdivision corresponding to selected i-niches. (B) Red color over blue rectangle indicates regions of interest (MRL/lpr-specific regions) predicted by neural network in entire spleen images. From top left, clockwise: BALBc #3, MRL/lpr #5, MRL/lpr #7, MRL/lpr #8. (C) Cell types enriched (FDR <0.1) in MRL/lpr-specific regions (in red in B) predicted by neural network. See also STAR Methods “Neural network training.”
Figure S7
Figure S7
The Fluidic Setup and Stage for Running CODEX Experiments, Related to STAR Methods (A) General diagram of robotic fluidic setup used in this study. CODEX experiments are done in an open flow cell, which can be imaged in any inverted microscope. Six solutions have to be programmatically delivered and removed from the flow cell, which in the meantime sits in spatially defined position in the imaging system. A combination of 6-channel Tecan syringe pump equipped with 250ul syringes and USB-relay driven vacuum valve was used for iterative solution delivery and removal. Imaging was performed in Keyence BZ-X710 fluorescent microscope configured with 3 fluorescent channels (FITC, Cy3, Cy5) and equipped with Nikon PlanFluor 40x NA 1.3 oil immersion lens. Insets show photographs of actual microscope stage and fluidics robot. (B) Detailed 3D model of CODEX stage used in experiments. A metal insert was machined to be compatible with either ASI (Advanced Scientific Instrumentation) or Keyence 3d stages. Disposable (one per experiment) acrylic platform with a circular cutout in the middle was custom designed and lasercut such that it could be attached to the metal stage insert. Before multicycle run the coverslip with a sample was glued to the acrylic base which produced an open flow cell. As opposed to closed, open flow cell design ensures efficient (99.9%) and rapid solution exchange that is critical for CODEX protocol. (C) An exemplary photograph of full CODEX setup when attached to an inverted confocal microscope.

References

    1. Bendall S.C., Simonds E.F., Qiu P., Amir A.D., Krutzik P.O., Finck R., Bruggner R.V., Melamed R., Trejo A., Ornatsky O.I. Single-cell mass cytometry of differential immune and drug responses across a human hematopoietic continuum. Science. 2011;332:687–696. - PMC - PubMed
    1. Burrell B.E., Warren K.J., Nakayama Y., Iwami D., Brinkman C.C., Bromberg J.S. Lymph node stromal fiber ER-TR7 modulates CD4+ T cell lymph node trafficking and transplant tolerance. Transplantation. 2015;99:1119–1125. - PMC - PubMed
    1. Chattopadhyay P.K., Roederer M. Cytometry: Today’s technology and tomorrow’s horizons. Methods. 2012;57:251–258. - PMC - PubMed
    1. Gabriel K.R., Sokal R.R. A new statistical approach to geographic variation analysis. Syst. Zool. 1969;18:259.
    1. Gerdes M.J., Sevinsky C.J., Sood A., Adak S., Bello M.O., Bordwell A., Can A., Corwin A., Dinn S., Filkins R.J. Highly multiplexed single-cell analysis of formalin-fixed, paraffin-embedded cancer tissue. Proc. Natl. Acad. Sci. USA. 2013;110:11982–11987. - PMC - PubMed

Publication types