. 2018 Sep 6;71(5):858-871.e8.
doi: 10.1016/j.molcel.2018.06.044. Epub 2018 Aug 2.

Cicero Predicts cis-Regulatory DNA Interactions from Single-Cell Chromatin Accessibility Data

Affiliations

Cicero Predicts cis-Regulatory DNA Interactions from Single-Cell Chromatin Accessibility Data

Hannah A Pliner et al. Mol Cell. .

Abstract

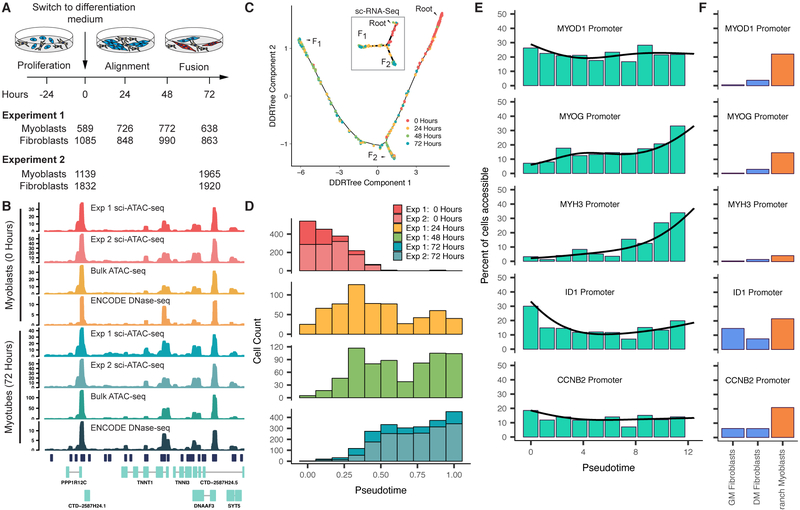
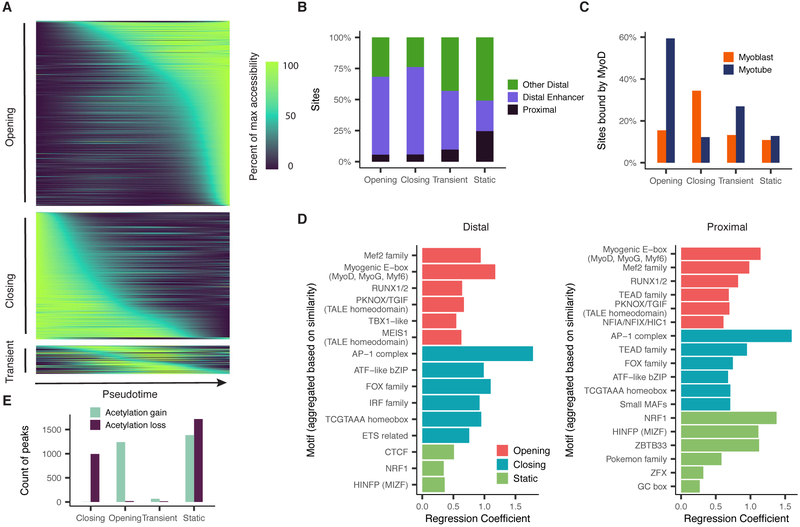
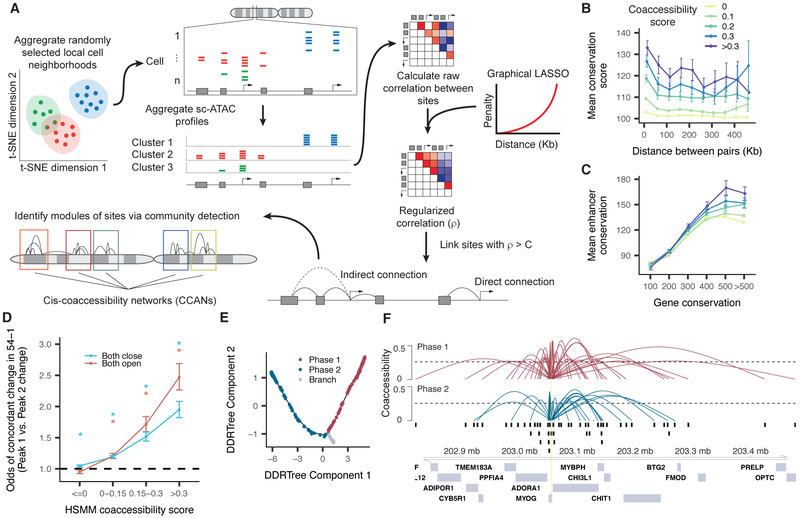
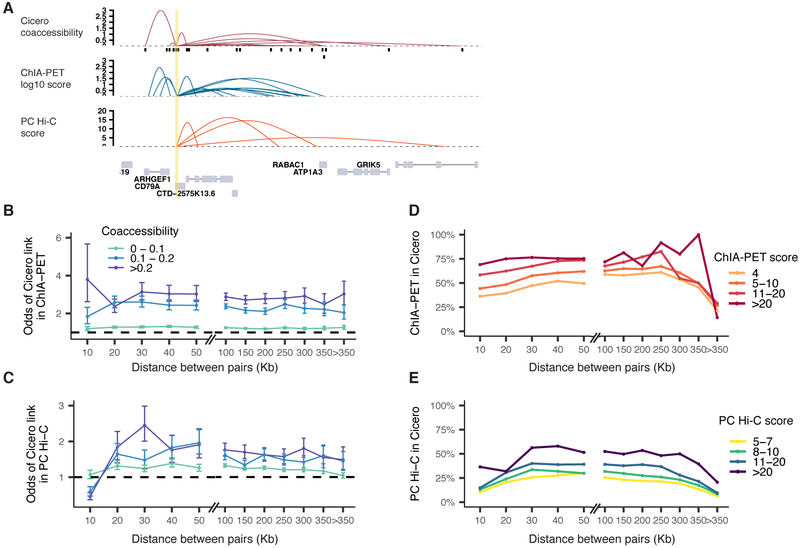
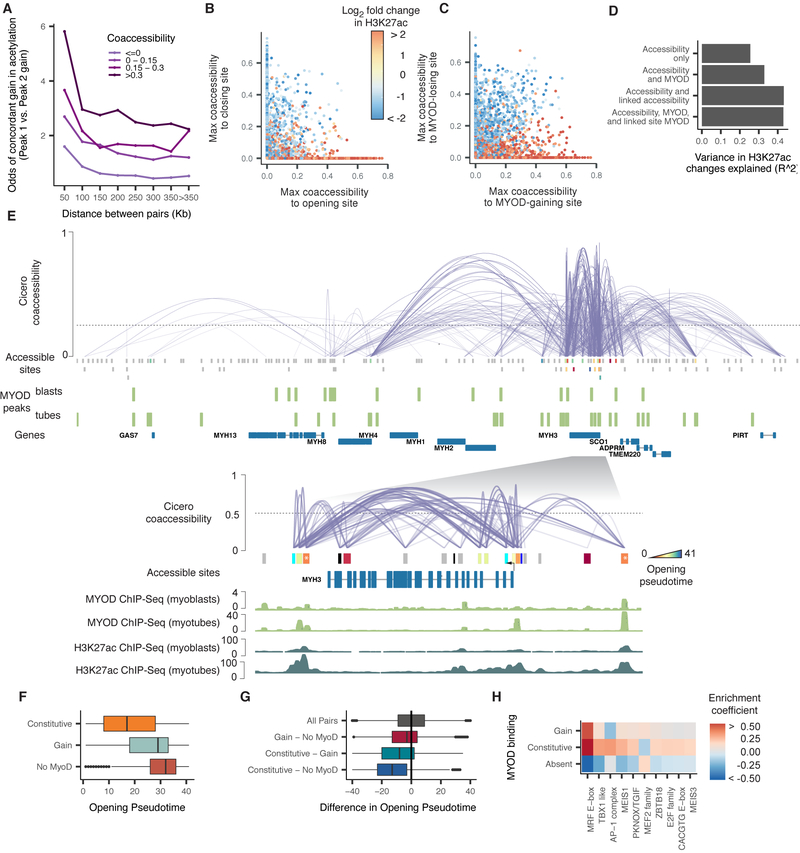
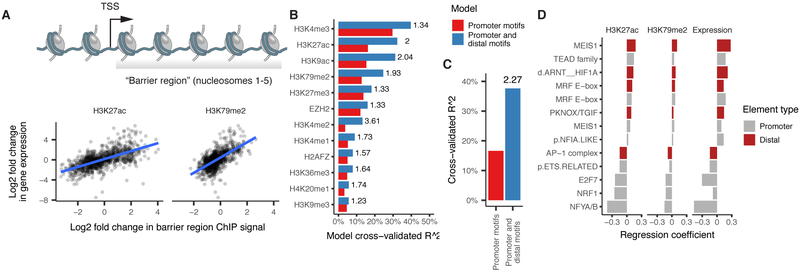
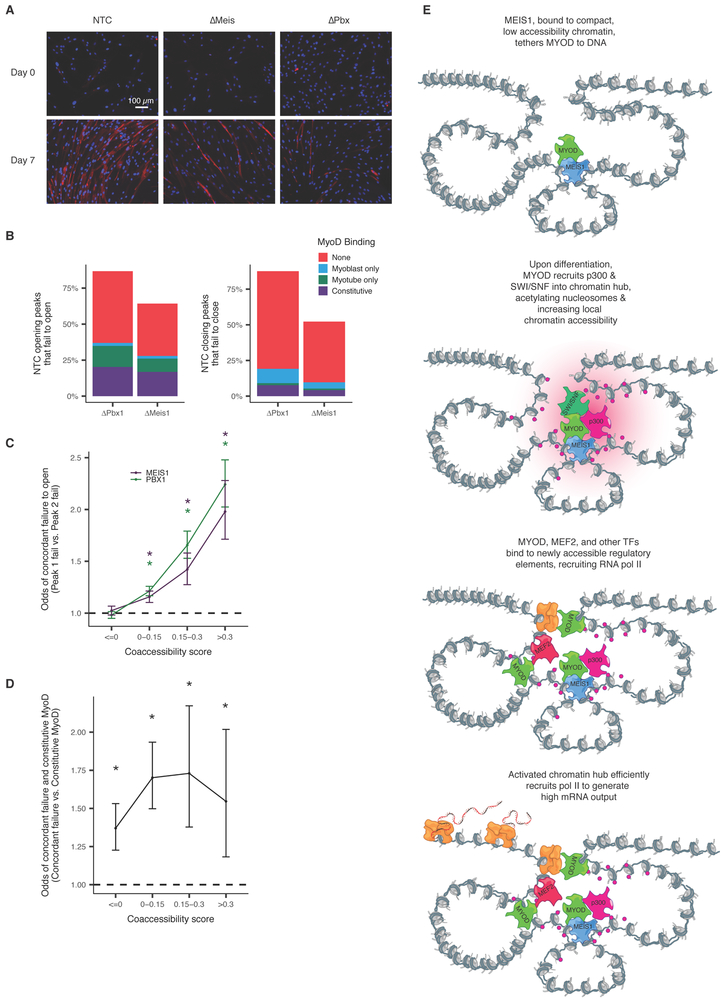
Linking regulatory DNA elements to their target genes, which may be located hundreds of kilobases away, remains challenging. Here, we introduce Cicero, an algorithm that identifies co-accessible pairs of DNA elements using single-cell chromatin accessibility data and so connects regulatory elements to their putative target genes. We apply Cicero to investigate how dynamically accessible elements orchestrate gene regulation in differentiating myoblasts. Groups of Cicero-linked regulatory elements meet criteria of "chromatin hubs"-they are enriched for physical proximity, interact with a common set of transcription factors, and undergo coordinated changes in histone marks that are predictive of changes in gene expression. Pseudotemporal analysis revealed that most DNA elements remain in chromatin hubs throughout differentiation. A subset of elements bound by MYOD1 in myoblasts exhibit early opening in a PBX1- and MEIS1-dependent manner. Our strategy can be applied to dissect the architecture, sequence determinants, and mechanisms of cis-regulation on a genome-wide scale.

Keywords: ATAC-seq; chromatin accessibility; co-accessibility; gene regulation; machine learning; myoblast differentiation; single-cell.


Conflict of interest statement

Declaration of Interests

LC and FJS have declare competing financial interests in the form of stock ownership and paid employment by Illumina, Inc. One or more embodiments of one or more patents and patent applications filed by Illumina may encompass the methods, reagents, and the data disclosed in this manuscript.

Figures

Figure 1.
Figure 1.
Differentiating myoblasts follow similar single cell chromatin accessibility and gene expression trajectories. A) Single cell chromatin accessibility profiles for human skeletal muscle myoblasts (HSMM) were constructed with sci-ATAC-seq. Contaminating interstitial fibroblasts (common in HSMM cultures) were removed informatically prior to further analysis. B) Aggregated read coverage from sci-ATAC-seq experiments in the region surrounding TNNT1 and TNNI3 in myoblasts (0 hours) and myotubes (72 hours). Bulk ATAC-seq prepared from the same wells as experiment 2 are shown alongside DNase-seq from ENCODE for comparison (ENCODE experiments ENCSR000EOO and ENCSR000EOP (The ENCODE Project Consortium, 2012)). C) The single cell trajectory inferred from 2,725 myoblast sci-ATAC-seq profiles from experiment 1 by Monocle (see Methods). In subsequent panels and throughout the paper, we exclude cells on the branch to outcome F2 unless otherwise indicated. Inset shows the sc-RNA-seq trajectory reported for HSMMs (reproduced from Figure 2 of (Qiu et al., 2017a), cells were from the same lot and were cultured under identical conditions to those for sci-ATAC-seq). D) Distribution of cells in chromatin accessibility pseudotime from the root to trajectory outcome F1. E) Percent of differentiating cells whose promoters for selected genes are accessible across pseudotime. Black line indicates the pseudotime-dependent average from a smoothed binomial regression. F) Percent of cells whose promoters for selected genes in E are accessible in fibroblasts collected in growth medium (GM) or differentiation medium (DM), as well as myoblasts localized to the branch to F2. See also Figure S1.
Figure 2.
Figure 2.
Thousands of DNA elements are dynamically accessible during myoblast differentiation. A) Smoothed pseudotime-dependent accessibility curves, generated by a negative binomial regression and scaled as a percent of the maximum accessibility of each site. Curve regressions are the same as regression for differential accessibility (see Methods). Each row indicates a different DNA element. Sites are sorted by the pseudotime at which they first reach half their maximum accessibility. B) Proportions of dynamic and static sites by site type. Color indicates whether a site is promoter-proximal (see Methods), a distal enhancer (defined as peaks that are not promoter-proximal, and are annotated by Segway as enhancers in either myoblasts or myotubes), or other distal (remaining sites). C) Percent of sites reported as bound by MyoD in either myoblasts or myotubes by (Cao et al., 2010). D) Motif enrichments in accessible sites. P-values result from logistic regression models that use the presence or absence of a given motif in each site to predict whether the site has a given accessibility trend (opening/closing/static). Plots show up to the top 6 Bonferroni-significant motifs by p-value. E) Counts of sites undergoing significant changes in H3K27 acetylation as measured by ChIP-Seq (Tang et al., 2015). See also Figure S2.
Figure 3.
Figure 3.
Cicero constructs cis-regulatory models genome-wide from sci-ATAC-seq data. A) An overview of the Cicero algorithm (see Methods for details) B) Mean phastCons 46-way placental conservation scores of distal peaks connected to promoters. Peaks were stratified by distance from the promoter and coaccessibility score between the promoter and the distal peak. C) Mean distal site conservation score versus connected gene conservation score stratified by coaccessibility score. D) Odds ratios of concordant accessibility dynamics across differentiation in 54-1 myoblasts between pairs of sites that are coaccessible in HSMM. For each bin of coaccessibility in HSMM, pairs of peaks that overlapped peaks in 54-1 non-targeting controls were assessed for concordant dynamics (>2 log2 fold change in both peaks or < −2 log2 fold change in both peaks). Error bars indicate 95% confidence intervals calculated using Fisher’s exact test. Asterisks represent estimates significantly different than 1 (p-values < 0.05 by Fisher’s exact test). E) Two “phases” of myoblast differentiation illustrated. F) A summary of the Cicero coaccessibility links between the MYOG promoter and distal sites in the surrounding region. The height of connections indicates the magnitude of the Cicero coaccessibility score between the connected peaks. The top set of (red) links were constructed from cells in phase 1, while the bottom (in blue) were built from phase 2. See also Figures S3 and S4.
Figure 4.
Figure 4.
Coaccessible DNA elements linked by Cicero are physically proximal in the nucleus. A) Cicero connections for the CD79A locus compared to RNA pol-II ChIA-PET (Tang et al., 2015) and promoter capture Hi-C (Cairns et al., 2016). Link heights for ChIA-PET are log-transformed frequencies of each interaction PET cluster and for promoter capture Hi-C are soft-thresholded log-weighted p-values from the CHiCAGO software. B) Odds ratio of pairs of sites within a given coaccessibility and distance bin found in RNA pol-II ChIA-PET compared to pairs of sites with coaccessibility <= 0. Color represents the coaccessibility bin. Error bars indicate 95% confidence intervals calculated using Fisher’s exact test. All points shown were significantly different than 1 (p-values < 0.05 by Fisher’s exact test). C) Similar to panel B, but comparing Cicero links to sites ligated in promoter-capture Hi-C. All points shown were significantly different than 1 (p-values < 0.05 by Fisher’s exact test) except for at the 10 kb bin which may be impacted by the resolution of Hi-C consequent to the use of a 6-cutter restriction enzyme. For panels B and C, we fit a linear model which included coaccessibility score and overall accessibility and found in both cases that coaccessibility had a significant effect on presence in comparison datasets even after correcting for this potential confounder (see Methods for details). D) Fraction of ChIA-PET contacts found in Cicero connections as a function of distance, stratified by multiplicity of ligation product detections. E) Promoter-capture contacts detected in Cicero CCAN connections as a function of distance, stratified by CHiCAGO score. See also Figure S5.
Figure 5.
Figure 5.
Coaccessible DNA elements linked by Cicero are epigenetically co-modified. A) Odds ratio of a site gaining H3K27ac during myoblast differentiation, given that it is linked to a site that is doing so. Color indicates the strength of the Cicero coaccessibility links. The lightest color indicates pairs of sites that are unlinked by Cicero. B) Correspondence between a statically accessible site’s gain or loss of H3K27ac and its maximum coaccessibility score to a site that is opening (x axis) or closing (y axis). Sites that are not linked to an opening or closing site are drawn at x = 0 or y = 0, respectively. C) Similar to panel B, but describing the correspondence between a site’s gain or loss of H3K27ac and its maximum coaccessibility score to a site that is gaining or losing MYOD. D) The variance explained in a series of linear regression models in which the response is the log2 fold change in H3K27ac level of each DNA element and the predictors are whether that site is opening, closing, or static, whether it gains or loses MYOD binding, and whether it is linked to neighbors that are doing so. See Methods for details on model specifications. E) The Cicero map for the 755 kb region surrounding MYH3 along with called MYOD ChIP-seq peaks from (Cao et al., 2010). Sites opening in accessibility are colored by their opening pseudotime (see Methods), sites not opening in accessibility are shown in grey. The inset shows the 60 kb region surrounding MYH3 along with MYOD ChIP-seq and H3K27ac ChIP-seq signal tracks from (Cao et al., 2010) and (The ENCODE Project Consortium, 2012). Only protein-coding genes are shown. F) Opening pseudotimes for all opening sites, subdivided by whether MYOD is bound in myoblasts and myotubes, myotubes alone, or neither. G) The difference in opening pseudotimes between pairs of linked DNA elements. The pairs are grouped based on whether one or both sites is constitutively bound by MYOD. H) TF binding motifs selected by an elastic net regression (alpha = 0.5), with a response encoding the MYOD binding status of each site. See also Figure S6.
Figure 6.
Figure 6.
Chromatin dynamics at distal DNA elements predicts gene regulation. A) Changes in histone acetylation in the first 1 kb downstream of each gene’s TSS, corresponding to the “barrier” to RNA pol II elongation posed by nucleosomes, are correlated with changes in its expression. B) Two regression models predict changes in the histone marks deposited throughout each gene’s barrier region. The first model predicts changes on the basis of TF binding motifs in gene promoters. The second model adds variables encoding the strength of coaccessibility with linked sites containing the motif. See Methods for details on the various models. Adjusted R^2 is computed as the fraction of null deviance explained. The number to the right of each bar indicates the ratio of variance explained between the first and second model. C) Similar to panel B, with changes in expression as the response. D) Coefficients from the model incorporating sequence at distal sites for each motif surviving model selection via elastic net. Note that the model considers each motif twice: once at promoters and again at distal sites, and both can be selected by elastic net. See also Figure S7.
Figure 7.
Figure 7.
MEIS1 and PBX1 knockout myoblasts fail to differentiate and show coordinated accessibility defects. A) Immunofluorescence microscopy images of non-template control, MEIS1 knockout and PBX1 knockout 54-1 cells at day 0 and day 7 post induction of differentiation. Nuclei are stained using DAPI, MYH3 is stained using anti-myosin MF20 and Alexa Fluor 594. B) Percent of peaks that open during differentiation in the NTC that fail to open in PBX1 and MEIS1 knockouts. Colors indicate the presence of MyoD binding in myoblasts and myotubes by ChIP-seq in HSMM. C) Odds ratios of concordant failure in accessibility gain across differentiation in 54-1 knockout myoblasts between pairs of sites that are coaccessible in HSMM. For each bin of coaccessibility in HSMM, pairs of peaks that overlapped peaks in 54-1 non-template controls were assessed for concordant failure to open (peaks that open in NTC but do not do so in knockouts). Color indicates knockout. Error bars indicate 95% confidence intervals calculated using Fisher’s exact test. Stars represent estimates significantly different than 1 (p-values < 0.05 by Fisher’s exact test). D) Similar to C. Odds ratios of concordant failure in accessibility gain given constitutive MyoD binding in one of the peaks. For each bin of coaccessibility in HSMM, pairs of peaks that overlapped peaks in 54-1 were assessed for presence of constitutive binding of MyoD in one or both of sites as well as coordinated failure to open. Only pairs of sites where both open in NTCs were included. Data is for MEIS1 knockout only due to a lack of sufficient power in PBX1. E) A model of how chromatin hub activation could be nucleated by a subset of “precociously” opening DNA elements. Such sites are occupied by TFs competent to bind relatively closed, inactive DNA elements, such as MEIS1, which may tether less competent factors such as MYOD to the hub. Subsequent recruitment of p300 and the BAF complex, possibly through intermediary factors (e.g. MYOD), leads to remodeling and acetylation of histones throughout the hub. These newly available sites are then bound by other transcriptional activators (e.g. MEF2), leading to the recruitment of Pol II. Moreover, acetylation of the histones downstream of assembled pre-initiation complexes reduces the barrier they pose to elongation, enhancing efficient transcription of genes within the hub.

References

    1. Benezra R, Davis RL, Lockshon D, Turner DL, and Weintraub H (1990). The protein Id: a negative regulator of helix-loop-helix DNA binding proteins. Cell 61, 49–59. - PubMed
    1. Berkes CA, Bergstrom DA, Penn BH, Seaver KJ, Knoepfler PS, and Tapscott SJ (2004). Pbx marks genes for activation by MyoD indicating a role for a homeodomain protein in establishing myogenic potential. Mol. Cell 14, 465–477. - PubMed
    1. Beygelzimer A, Kakadet S, Langford J, Arya S, Mount D, and Li S (2013). FNN: fast nearest neighbor search algorithms and applications. R Package Version 1.
    1. Blondel VD, Guillaume J-L, Lambiotte R, and Lefebvre E (2008). Fast unfolding of communities in large networks.
    1. Breiman L (1996). Bagging predictors. Mach. Learn. 24, 123–140.

Publication types

LinkOut - more resources